Pullback GBPNZD trade idea 07/04/2025GBPNZD has maintained a strong bullish structure since 2023, forming consistent higher highs and higher lows.
After each new high, we’ve seen 400–600 pip pullbacks before price continues bullish.
With a fresh high now in at 2.26481 and signs of exhaustion showing, I’m eyeing potential swing sell setups to target the previous intrahigh at 2.17900 (approx. 550 pips).
This is a high risk, high reward swing play and I’ll only enter after a clear momentum shift on the daily or 4H.
Bias flips back bullish if we break and hold above the high with momentum.
GBPNZD trade ideas

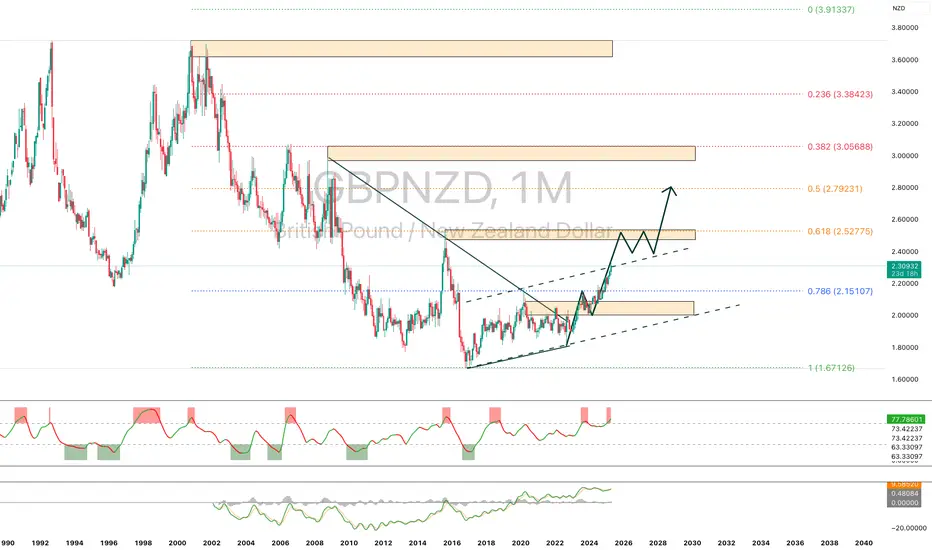
GBPNZD – Technical Analysis (1M)Following a breakout from a multi-year narrowing channel, GBPNZD has established a bullish trend above a key resistance level. Price is now approaching a major supply zone around 2.52–2.55, where a consolidation or pullback may occur. A breakout above this zone could pave the way toward the 0.5 Fibonacci level at 2.79 – a major upside target.
Momentum indicators are in overbought territory, suggesting potential correction or sideways action before further continuation. Chart structure indicates a potential bullish flag or accumulation range forming.
Main scenario: price pulls back to 2.42–2.45 before continuing upward to 2.79.
Alternative scenario: rejection below 2.30, leading to a deeper retracement toward 2.15.
GBPNZDRemember, when I was doing this analysis and setting the high target, the environment I was working in did not allow for such an ambitious idea that the parity rate in the GBPNZD symbol would even come close to my desired price range!!
I must say that since the date of the analysis, this symbol has grown by 800 pips and the final target shows a range of 1600 pips!
Finally, I must say that in my opinion, the current downward fluctuations are a good situation for a BUY position for the desired goals.

GBP/NZD Sterling vs Kiwi Forex Bank Heist Plan (Swing/Day Trade)🌟Hi! Hola! Ola! Bonjour! Hallo! Marhaba!🌟
Dear Money Makers & Robbers, 🤑💰💸✈️
Based on 🔥Thief Trading style technical and fundamental analysis🔥, here is our master plan to heist the GBP/NZD "Sterling vs Kiwi" Forex Bank. Please adhere to the strategy I've outlined in the chart, which emphasizes long entry. Our aim is the high-risk Red Zone. Risky level, overbought market, consolidation, trend reversal, trap at the level where traders and bearish robbers are stronger. 🏆💸"Take profit and treat yourself, traders. You deserve it!💪🏆🎉
Entry 📈 : "The heist is on! Wait for the MA breakout (2.28000) then make your move - Bullish profits await!"
however I advise to Place Buy stop orders above the Resistance level (or) Place buy limit orders within a 15 or 30 minute timeframe most recent or swing, low or high level.
📌I strongly advise you to set an "alert (Alarm)" on your chart so you can see when the breakout entry occurs.
Stop Loss 🛑:
Thief SL placed at the recent/swing low level Using the 4H timeframe (2.25300) Day / swing trade basis.
SL is based on your risk of the trade, lot size and how many multiple orders you have to take.
🏴☠️Target 🎯: 2.31500 (or) Escape Before the Target
🧲Scalpers, take note 👀 : only scalp on the Long side. If you have a lot of money, you can go straight away; if not, you can join swing traders and carry out the robbery plan. Use trailing SL to safeguard your money 💰.
GBP/NZD "Sterling vs Kiwi" Forex Bank Heist Plan (Day/Scalping Trade) is currently experiencing a bullishness,., driven by several key factors.
📰🗞️Get & Read the Fundamental, Macro, COT Report, Quantitative Analysis, Sentimental Outlook, Intermarket Analysis, Future trend targets.... go ahead to check 👉👉👉🔗
⚠️Trading Alert : News Releases and Position Management 📰 🗞️ 🚫🚏
As a reminder, news releases can have a significant impact on market prices and volatility. To minimize potential losses and protect your running positions,
we recommend the following:
Avoid taking new trades during news releases
Use trailing stop-loss orders to protect your running positions and lock in profits
💖Supporting our robbery plan 💥Hit the Boost Button💥 will enable us to effortlessly make and steal money 💰💵. Boost the strength of our robbery team. Every day in this market make money with ease by using the Thief Trading Style.🏆💪🤝❤️🎉🚀
I'll see you soon with another heist plan, so stay tuned 🤑🐱👤🤗🤩

gbpnzd is bullish The h4 timeframe is bullish, and I am waiting for the market to retrace back to the 38.2 fib level, which is in confluence with the structure to create HL

GBP_NZD LONG FROM RISING SUPPORT|
✅GBP_NZD is trading along
The rising support
And as the pair will soon retest it
I am expecting the price to go up
To retest the supply levels
Above at 2.2659
LONG🚀
✅Like and subscribe to never miss a new idea!✅
Disclosure: I am part of Trade Nation's Influencer program and receive a monthly fee for using their TradingView charts in my analysis.

GBPNZD: Bullish Forecast & Outlook
Looking at the chart of GBPNZD right now we are seeing some interesting price action on the lower timeframes. Thus a local move up seems to be quite likely.
Disclosure: I am part of Trade Nation's Influencer program and receive a monthly fee for using their TradingView charts in my analysis.
❤️ Please, support our work with like & comment! ❤️
The Allure of GBPNZDSomeone once claimed money can’t buy happiness, but they clearly never met my portfolio. I mused, 'Happiness is just a shiny bar away plus a few extra puns for good measure!

Lingrid | GBPNZD potential UPWARD Breakout. LongThe price perfectly fulfilled my last idea . It hit the target zone. FX:GBPNZD price is making higher highs and higher closes, indicating that the market is in a bullish phase. Recently, it tested the previous resistance zone and then bounced back because the markets usually breaks through key levels on the third or fourth attempt. If the market rebounds from the support level, we can expect a continuation of the current bullish trend. Additionally, the market is forming an ABC pattern, suggesting that the price may reach the 2.3000 level in the near future. My goal is resistance zone around 2.29000
Traders, if you liked this idea or if you have your own opinion about it, write in the comments. I will be glad 👩💻

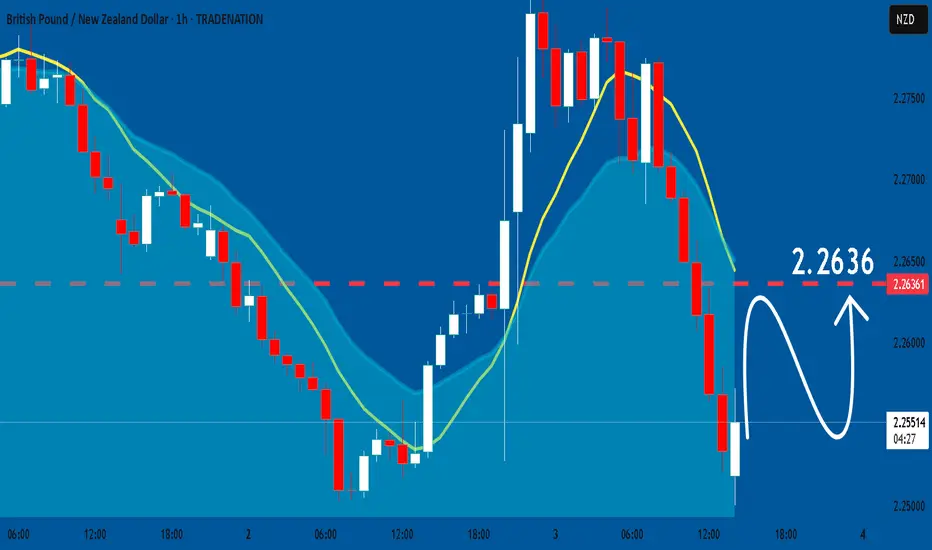
GBP/NZD BULLISH BIAS RIGHT NOW| LONG
Hello, Friends!
GBP/NZD is making a bearish pullback on the 1H TF and is nearing the support line below while we are generally bullish biased on the pair due to our previous 1W candle analysis, thus making a trend-following long a good option for us with the target being the 2.264 level.
Disclosure: I am part of Trade Nation's Influencer program and receive a monthly fee for using their TradingView charts in my analysis.
✅LIKE AND COMMENT MY IDEAS✅


GBPNZD SellNZD looking for a recovery after the huge drop after the tariff news, gbp gaining some strength but i feel like its going to be short lived in the coming days

GBPNZD BUY TRADE PLAN🔥 GBP/NZD TRADE PLAN
📅 Date: April 2, 2025
🔖 Plan Type: Main Swing Plan
📈 Bias & Trade Type: Bullish Reversal – D1 Discount Rejection
📌 Trade Idea: Buying into D1 pullback structure for continuation to weekly range high
📥 Entry Type: H4 Demand Zone + Liquidity Sweep + FVG Alignment
🔰 Confidence Level: ⭐⭐⭐⭐ (80%)
Reasons / Confluences:
– D1 strong bullish BOS structure still intact
– Pullback into clean H4 OB zone + unfilled FVG
– 1H wick rejection & MACD weakening bear momentum
– Volume compression near discount zone
– NZD softening + GBP stable = sentiment favoring GBP
📌 Status: Waiting for clean LTF confirmation inside zone (1st touch pending)
📍 Entry Zones:
Primary Buy Zone: 2.2575 – 2.2605
(Refined H4 OB with liquidity pocket and imbalance overlap)
Secondary Buy Zone: 2.2520 – 2.2540
(Deeper sweep zone below intraday liquidity; last defense)
❗ Stop Loss:
SL: 2.2470 (Below OB, last liquidity wick, and invalidation structure)
🎯 Take Profit Targets:
TP1: 2.2720 🥉 (Last minor swing high)
TP2: 2.2805 🥈 (Equal highs + H4 inefficiency)
TP3: 2.2890 🏆 (D1 supply zone & range high)
📏 Risk:Reward: Minimum R:R = 1:3.1
🧠 MANAGEMENT STRATEGY:
– Risk 1%–2% depending on account type
– Once TP1 hits → move SL to BE
– Secure partials at TP2
– Let runner target TP3 with trailing SL above structure lows
– Re-entry only allowed on fresh confirmation post TP1
⚠️ Confirmation Criteria:
– H1 bullish engulfing or pin bar inside entry zone
– Volume uptick on entry candle close
– Preferably during London or NY session
– Bonus: M15–M30 divergence or inducement confirmation
⏳ Trade Validity:
Valid for 2–4 days (HTF swing structure – moderate cycle)
❌ Invalidate if price closes below 2.2470 or H4 BOS to downside
🌐 Fundamentals & Sentiment Confluence:
✅ COT shows GBP neutral-to-positive flow
✅ NZD weakness driven by soft dairy exports + RBNZ dovish tone
✅ Global sentiment = neutral to mild risk-on, favoring GBP cyclical strength
✅ No major red news for either currency in next 24h = ideal execution window
📋 Final Summary:
Looking to buy GBPNZD on a retracement into refined demand zone between 2.2575–2.2605, aligned with D1 bullish structure and H4 rejection confluence. Tight institutional structure, optimal risk curve, and clean invalidation zone. Confirmation required – DO NOT ENTER EARLY. This is a controlled swing entry with >1:3 R:R potential.


GBPNZD Approaching Key Resistance ZoneGBPNZD Approaching Key Resistance Zone
The 4-hour chart shows that GBPNZD is forming a large megaphone pattern. This pattern's resistance line could trigger selling pressure, leading to a potential price drop from the current zone.
Keep an eye out for signs of a reversal and watch the support levels where the price might react. Key areas to monitor: 2.2670, 2.2560, 2.2445, and 2.2200.
PS: Be careful as this is a counter trend trade. Very risky overall
You may find more details in the chart!
Thank you and Good Luck!
❤️PS: Please support with a like or comment if you find this analysis useful for your trading day❤️
Disclosure: I am part of Trade Nation's Influencer program and receive a monthly fee for using their TradingView charts in my analysis.

GBPNZD Will Grow! Long!
Here is our detailed technical review for GBPNZD.
Time Frame: 12h
Current Trend: Bullish
Sentiment: Oversold (based on 7-period RSI)
Forecast: Bullish
The market is approaching a significant support area 2.253.
The underlined horizontal cluster clearly indicates a highly probable bullish movement with target 2.277 level.
P.S
Overbought describes a period of time where there has been a significant and consistent upward move in price over a period of time without much pullback.
Disclosure: I am part of Trade Nation's Influencer program and receive a monthly fee for using their TradingView charts in my analysis.
Like and subscribe and comment my ideas if you enjoy them!

GBP/NZD 1-HRGBPNZD Approaching Key Resistance: A Closer Look at the Megaphone Pattern and Potential Reversal Zones
The current price action of GBPNZD on the 1-hour chart reveals the formation of a prominent megaphone pattern, a significant technical formation characterized by fluctuating price swings and widening ranges. This pattern, which often indicates increased market volatility and uncertainty, is an important signal to watch as it nears the upper resistance zone. Understanding the intricacies of this pattern and the key levels that are in play can provide valuable insights for traders seeking to capitalize on the upcoming potential price movements.
What is the Megaphone Pattern?
A megaphone pattern, also known as an expanding triangle or broadening formation, is typically seen when the price creates higher highs and lower lows. This type of formation suggests that market participants are uncertain, leading to erratic price swings. The pattern often serves as a warning of increased volatility and potential reversals, which is exactly what we may be witnessing with GBPNZD.
As the price moves toward the upper boundary of the megaphone formation, it’s essential to recognize that this resistance line represents a crucial point for potential market exhaustion. Typically, price reactions around this zone can lead to significant retracements or reversals. This creates an opportunity for traders to anticipate potential short positions or to watch for signs of reversal before making their move.
Key Resistance Levels and Potential Reversal
The current price is fast approaching the upper resistance line of the megaphone pattern, which has proven to be a critical zone where selling pressure could build up. If the market fails to break above this resistance, we could see a shift in momentum, where sellers step in, pushing the price lower. This could be triggered by a number of factors such as exhaustion of buying pressure, a failure to sustain higher prices, or the onset of bearish sentiment in the broader market.
Here are the key resistance and support zones to monitor carefully:
Resistance Zone (Key Upper Boundary of Megaphone Pattern):
This is the critical level where the price may encounter substantial selling pressure. A failure to break above this resistance could lead to a swift reversal. Watch for candlestick patterns like bearish engulfing, shooting stars, or evening stars, which could indicate that the market is ready to turn.
Support Zones:
Should the price fail to breach the resistance level, it's crucial to keep a close eye on the support areas where the market could react and potentially reverse upward. These levels include:
2.2670: A strong support area where the price has historically shown signs of consolidation and upward movement. If the price retraces to this level, we may see a bounce, especially if it coincides with other technical indicators such as RSI or MACD signaling oversold conditions.
2.2560: This level represents another potential support zone where previous price action has indicated short-term reversals. If the market consolidates around this level, it could provide the foundation for a potential bullish reaction.
2.2445: As we move further down, this level represents a deeper support zone. A price drop to this point could trigger more significant buying interest, especially if the broader market sentiment remains favorable for the pair.
2.2200: This is one of the most critical support levels to watch. A price move toward this zone would suggest a strong bearish trend, and if it holds, it could lead to a more substantial price correction or the continuation of a downtrend.
What to Look For: Signs of a Reversal
When approaching key resistance levels such as the upper boundary of the megaphone pattern, it’s important to watch for signs of a reversal. These may include:
Candlestick Patterns: Reversal candlestick formations such as doji, shooting star, or bearish engulfing patterns around the resistance level could signal that the market is losing momentum and that sellers may step in.
Volume Indicators: A decrease in volume at the upper boundary or increased volume on bearish candles could provide additional confirmation of a potential reversal. A sudden surge in volume after a failed breakout could signify that the price is ready to move lower.
Momentum Indicators: Tools such as the Relative Strength Index (RSI), Moving Average Convergence Divergence (MACD), or Stochastic Oscillator could also help identify overbought conditions or divergences, suggesting that a reversal may be imminent.
The Bigger Picture
Traders need to consider both the short-term and long-term outlook when analyzing GBPNZD. On a broader scale, the megaphone pattern may indicate a market that is in a state of indecision, but as the price moves toward key levels, the likelihood of a major price shift increases. A breakout above the upper resistance would suggest continued strength for the bullish trend, while a failure to break above and a subsequent price rejection could set the stage for a bearish move down to the key support levels outlined.
Conclusion
In summary, GBPNZD is at a pivotal moment. The formation of the megaphone pattern is signaling increased volatility, with the price nearing key resistance levels. Traders should remain vigilant, monitoring the price action closely around these levels, looking for signs of reversal or confirmation of a breakout. The key support levels at 2.2670, 2.2560, 2.2445, and 2.2200 should be watched carefully, as they will likely play a significant role in the upcoming price movements. By staying informed of these levels and patterns, traders can position themselves effectively for potential price shifts in the near future.


GN UpdateThe GBP/NZD pair is expected to rise from its current levels
If it breaks this resistance, further gains to are possible but would require stronger momentum.

GBPNZA BUYINGOANDA:GBPNZD buying possible
reason is weakly support reject
1 day consoltaion
4hr conformation

Sell gbpnzdStrong sell expected this month
Weekly and monthly too overbought pair
Monthly sell levels

GBPNZD BULLISH TREND CONTINUES Price recently broke out of the symmetrical triangle pattern after bouncing off the pullback support level of 2.23463 we might continue to experience more bullish price movement from the current high.
