GBPNZD trade ideas

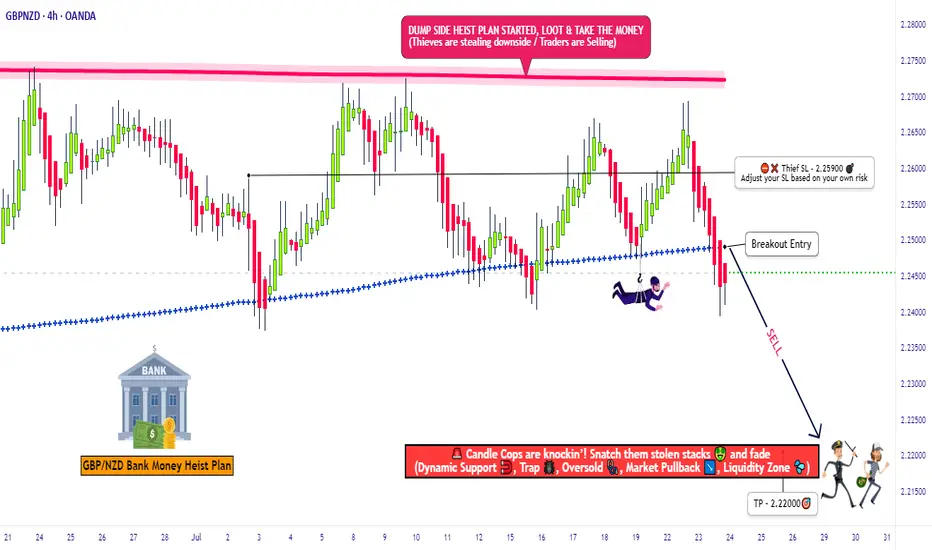
"GBP/NZD: Bearish Storm Brewing – Get Ready!🚨 GBP/NZD HEIST ALERT: "Pound vs Kiwi" Bearish Trap Setup! 🚨 (Scalping/Day Trade)
🌟 Attention, Market Robbers & Profit Pirates! 🌟
🔥 Thief Trading Strategy Activated – Time to short the GBP/NZD like a pro! This pair is setting up for a bearish heist, and we’re locking in entries before the drop. High-risk, high-reward? You bet.
🎯 TRADE PLAN (Bearish Ambush)
Entry Zone (Short) 📉:
Optimal: Sell limit orders on retests (15m/30m timeframe).
Thief’s Trick: Layer entries (DCA-style) near recent highs for max efficiency.
"Enter like a sniper, escape like a ghost." 👻
Stop Loss 🛑:
4H Swing High/Wick (Near 2.25900) – Adjust based on your risk & lot size.
"A smart thief always has an exit route." 🏃💨
Target 🎯: 2.22000 (or escape early if the trap snaps shut!)
💣 WHY THIS HEIST? (Bearish Triggers)
Technical Setup: Oversold bounce? Nah. Consolidation → Reversal trap.
Fundamentals: Weak GBP sentiment? Strong NZD data? Check the news!
Market Psychology: Bulls are getting trapped at resistance—time to fade them.
⚠️ THIEF’S WARNING
News = Volatility Bomb 💣 – Avoid new trades during high-impact events.
Trailing SLs = Your Best Friend – Lock profits & dodge reversals.
💎 BOOST THIS IDEA & JOIN THE HEIST!
🔥 Hit 👍 LIKE, 🚀 BOOST, and FOLLOW for more lucrative robberies!
💸 "Steal the market’s money—before it steals yours." 🏴☠️
🔔 Stay tuned—next heist coming soon! 🔔
Short IdeaFor educational purposes, the trend is currently bullish, however expecting a correctional sell to the downside after reaching the POI on top. Overall trend bullish so will be looking for buyers after the brief sell move

short on gbpnzdafter price reach to a strong resistace had a reaction and go down and now pullback to a broken support and consider the risk and enter...
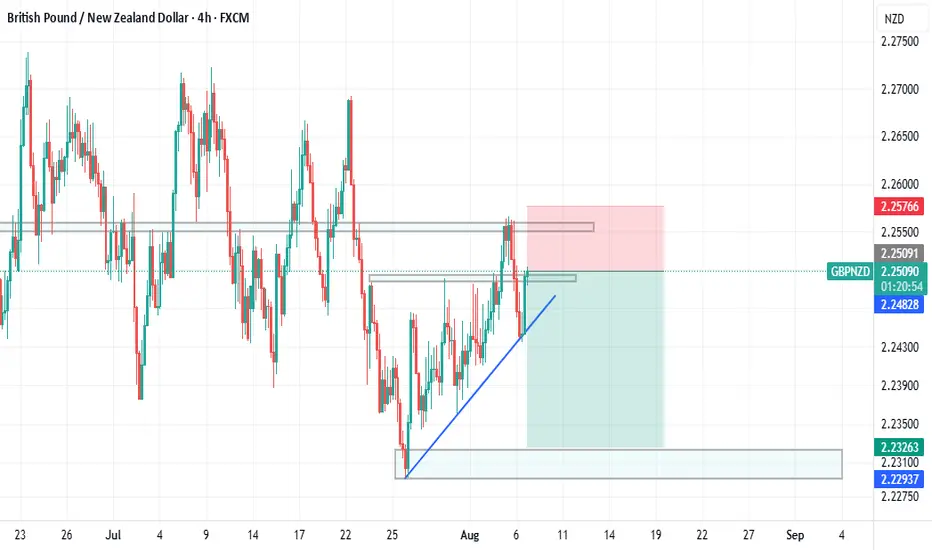
GBPNZD--LONG---looking at multi-timeframe, monthly,weekly,daily bullish.
--Entry around:2.249, Tp is around 2.268


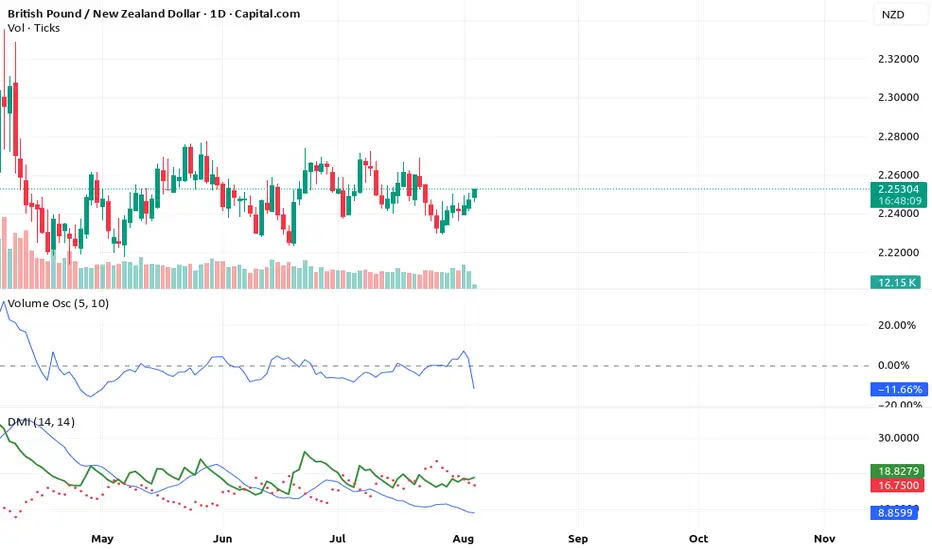
3 Powerful Buy Signals on GBP/NZD – Rocket Booster Strategy 🚀 3 Powerful Buy Signals on GBP/NZD – Rocket Booster Strategy Ignites!
Pair: GBP/NZD
Timeframe:
Bias: Bullish Reversal Setup
Strategy: Rocket Booster Strategy
Signal Strength: ✅✅✅
🔍 Breakdown of the 3 Signals:
1️⃣ Volume Oscillator – Reversal Underway
Buy-side volume is increasing after a dry spell, suggesting a potential trend reversal and accumulation phase.
2️⃣ MACD – Bullish Cross Below Zero Line
Early momentum shift detected — this is where smart entries begin before full confirmation.
3️⃣ ADX + DI+ – Buyers Taking Control
ADX rising above 20 → Strengthening trend
DI+ crossing up → Buyers are clearly stepping in
🔧 Rocket Booster Strategy Criteria Met:
✅ Price is above EMA 50 and EMA 200
✅ Momentum, volume, and trend all aligned
✅ Ideal launch conditions for a bullish continuation
💡 Trade Idea (Example Only):
Entry: Market or pullback
Stop-Loss: Below swing low / EMA 50
TP1: Previous high
TP2: 2R+ extension
Optional: Use a trailing stop for scaling out
⚠️ Disclaimer:
This is not financial advice. Use a simulation account to test this strategy first.
Always apply risk management and have a clear profit-taking plan.
Never risk more than you can afford to lose.
🔚 Final Thought:
When volume, momentum, and trend align — it’s time to pay attention.
This is a textbook Rocket Booster setup: clean, powerful, and primed for upside.
Rocket Boost This Content To Learn More
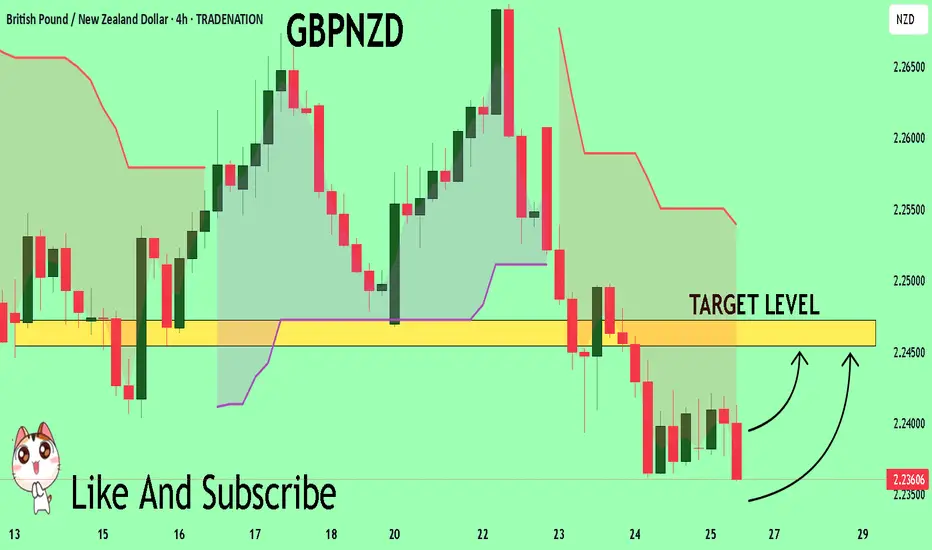
GBPNZD BUY & SELL!Orderblock to be mitigated on the 4hr timeframe, then a quick push to our supply zone at the upside to trigger a sell.

GBPNZDA swing move on GBPNZD. Price is likely to breakout from a bearish flag and also a Clear candle stick rejection from a Fib level


GBPNZD 4hour SetupPossible trade buy on G-N
Targeting FVG below 4hours CRT.
Stop loss below Weekly CRT.

GBPNZD SELL TRADETREND: Downtrend
The price is currently retesting broken support on the H4 and Daily charts, indicating continued selling. Based on the strong bullish pressure currently, I'll be looking for a confirmation signal to sell at the next H4 close.

GBPNZD 15m buyHello friends. The price of the GBPNZD symbol in the 15-minute time frame after hitting the FVG high time frame is now bullish. You can see that it also happened in the choch direction. If it returns to the FVG 15m area, it can be entered for buy. Friends, please note that this is just a theory.

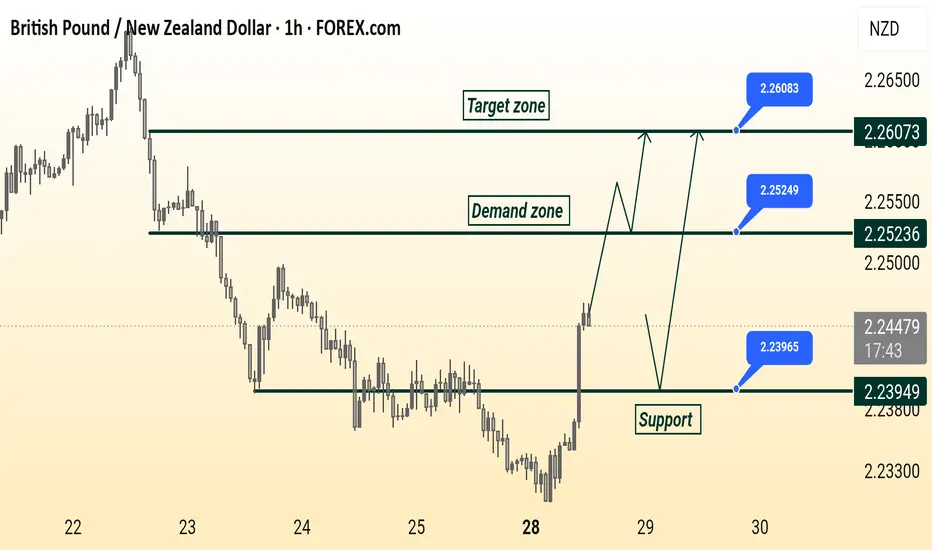
GBP/ NZD Ready Read The Captions This 1-hour chart analysis of GBP/NZD highlights key trading zones:
Support level: 2.23949
Demand zone: 2.25236
Target zone: 2.26073
The price is currently rising from support and approaching the demand zone. Two possible scenarios are shown: a breakout toward the target zone or a pullback to the support before a new upward attempt.
GBPNZD BUY IDEAWe're currently in a downtrend, but the price is approaching a key reversal support zone. Based on previous price patterns in that support zone, the price has consistently reversed upon reaching it.
We'll be on the lookout for signals the market sends at the zone
GBP-NZD Will Keep Falling! Sell!
Hello,Traders!
GBP-NZD keeps falling down
And the pair made a strong
Bearish breakout of the key
Horizontal key level of 2.2400
And the breakout is confirmed
So we are bearish biased and
We will be expecting a further
Bearish move down on Monday
Sell!
Comment and subscribe to help us grow!
Check out other forecasts below too!
Disclosure: I am part of Trade Nation's Influencer program and receive a monthly fee for using their TradingView charts in my analysis.

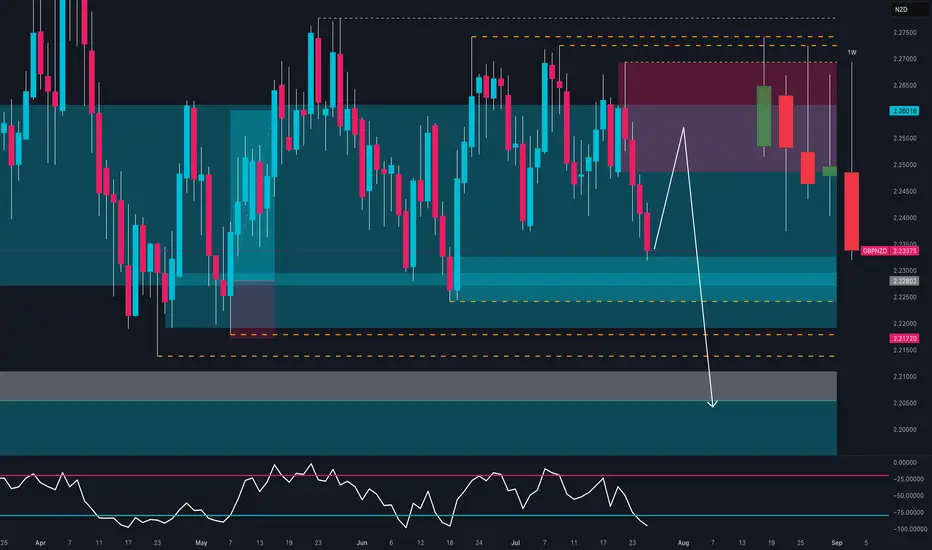
GBPNZD Breakdown – Smart Money Turns Fully Bearish🧠 Macro + COT + Sentiment Context
Commitment of Traders (COT) – Asset Managers
Institutional asset managers are significantly net short on GBPNZD, with positioning at its lowest level of the year and declining sharply since May. This reflects a clear bearish stance from smart money and reinforces the current downward pressure.
Sentiment & Momentum Indicators
DPO: -54.9 → Indicates a moderately bearish momentum phase.
Wyckoff: -20.3 → Price is in a distribution phase, suggesting weakness.
Speed: 3.2 → Low acceleration, but directional bias remains bearish.
Market Mood: Neutral, but leaning into oversold territory.
Seasonality (July 1st – Sept 30th)
Historically, GBPNZD performs positively in this period:
3Y: +1.7%, 5Y: +1.6%, 10Y: +2.3%, 15Y: +2.8%
However, in 2025, price is diverging sharply from seasonal norms. The pair is trading against historical patterns, suggesting a seasonal anomaly where institutional flow is dominating historical behavior.
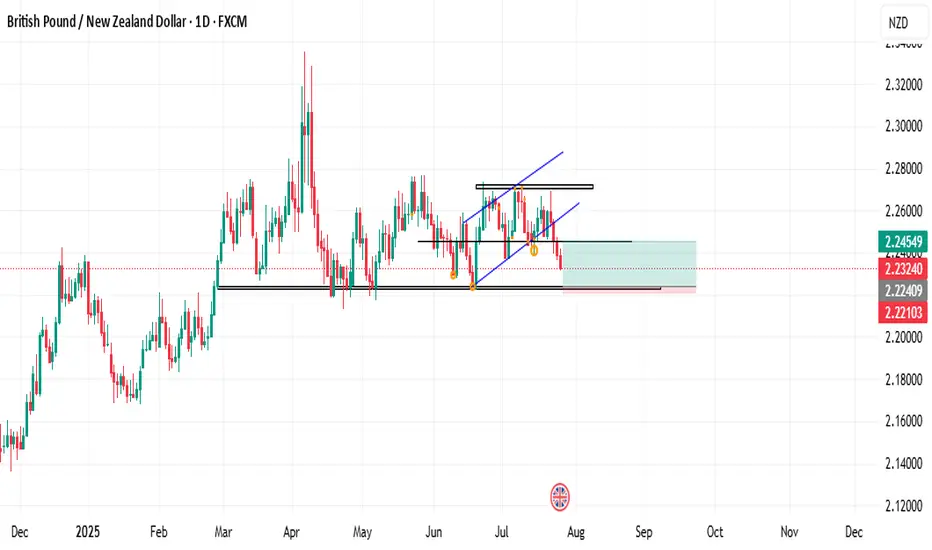
🧱 Technical Outlook (Daily Chart)
GBPNZD had been consolidating in a clear range between 2.2170 support and 2.2750 resistance since May. The pair has now broken down with a strong, full-bodied weekly candle, closing below the 2.2320 demand zone.
Key Technical Zones:
Supply zone (2.2494–2.2659) → A clear rejection zone that initiated the current selloff.
Demand zone (2.2170–2.2300) → Has been tested twice already, increasing the probability of a clean breakdown.
RSI (Daily) → Currently neutral, with a sequence of lower highs and no bullish divergence in sight — indicating weak momentum.
✅ Conclusion & Trade Plan
Directional Bias: Bearish (Short)
Although seasonality typically supports bullish price action for GBPNZD in Q3, the current context is decisively bearish. Institutional positioning, price structure, and sentiment all confirm a potential shift in direction, reinforced by a confirmed weekly breakdown.
Bearish Targets:
📍 First: 2.2170 (recent support test)
📍 Second: 2.2000–2.1900 (April swing low)
📍 Extension: 2.1750 (base of previous accumulation zone)
Invalidation Criteria:
A weekly close above 2.2490 (supply zone breached)
Bullish RSI divergence + weekly recovery candle
GBPNZD Bearish Breakout!
HI,Traders !
#GBPNZD is trading in a strong
Downtrend and the pair
Broke the key horizontal
Level around 2.23918 which
Reinforces our bearish
Bias and we will be
Expecting a further
Bearish move down
On Monday! !
Comment and subscribe to help us grow !

GBP_NZD BEARISH BREAKOUT|SHORT|
✅GBP_NZD is going down currently
As the pair broke the key structure level of 2.2400
Which is now a resistance, and after the pullback
And retest, I think the price will go further down
SHORT🔥
✅Like and subscribe to never miss a new idea!✅
Disclosure: I am part of Trade Nation's Influencer program and receive a monthly fee for using their TradingView charts in my analysis.

GBPNZD Will Explode! BUY!
My dear friends,
My technical analysis for GBPNZD is below:
The market is trading on 2.2361 pivot level.
Bias - Bullish
Technical Indicators: Both Super Trend & Pivot HL indicate a highly probable Bullish continuation.
Target - 2.2454
About Used Indicators:
A pivot point is a technical analysis indicator, or calculations, used to determine the overall trend of the market over different time frames.
Disclosure: I am part of Trade Nation's Influencer program and receive a monthly fee for using their TradingView charts in my analysis.
———————————
WISH YOU ALL LUCK
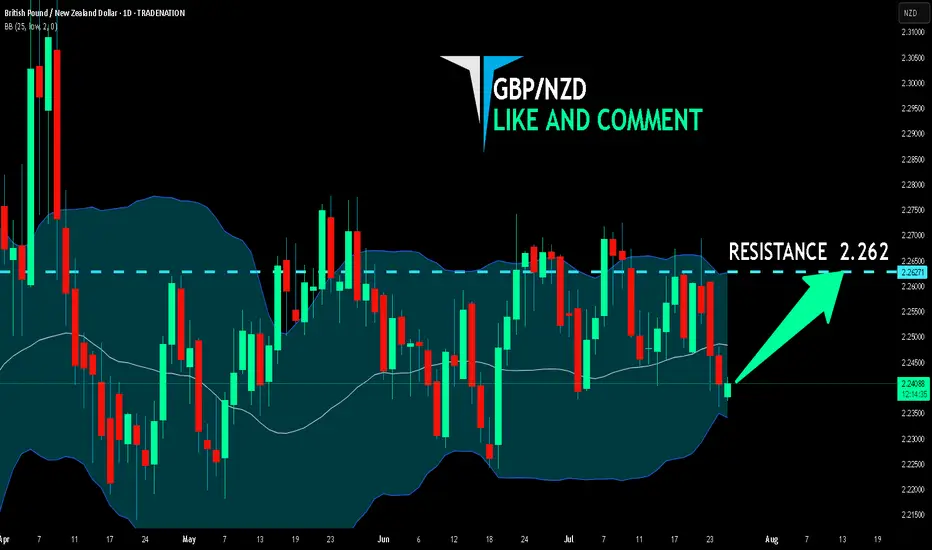
GBP/NZD BEST PLACE TO BUY FROM|LONG
Hello, Friends!
We are going long on the GBP/NZD with the target of 2.262 level, because the pair is oversold and will soon hit the support line below. We deduced the oversold condition from the price being near to the lower BB band. However, we should use low risk here because the 1W TF is red and gives us a counter-signal.
Disclosure: I am part of Trade Nation's Influencer program and receive a monthly fee for using their TradingView charts in my analysis.
✅LIKE AND COMMENT MY IDEAS✅
Gbpnzd buy Gbpnzd looks set for a rally back up off a nice support zone i can see a nice rise i will be buying at 2.23900 and ta,ing profits at 2.25700 that's a 0.84% profit .

GBPNZD: Bullish Move in a Channel 🇬🇧🇳🇿
I see a horizontal parallel channel on GBPNZD on a daily.
The price is currently testing its support.
On an hourly time frame, a cup & handle pattern was formed on that.
Its neckline was violated with the today's high impact news.
I think that the price may bounce at least to 2.246 level.
❤️Please, support my work with like, thank you!❤️
I am part of Trade Nation's Influencer program and receive a monthly fee for using their TradingView charts in my analysis.
