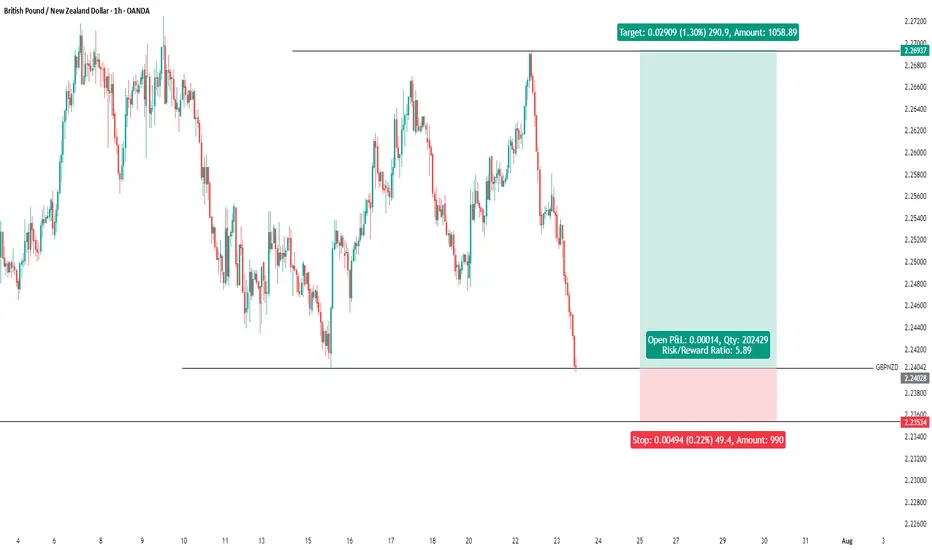
GBPNZD--SELL--bouncing down from upper side off descending channel(green channel)
--SELL enrty around:2.252 TP: around:2.233
GBPNZD trade ideas

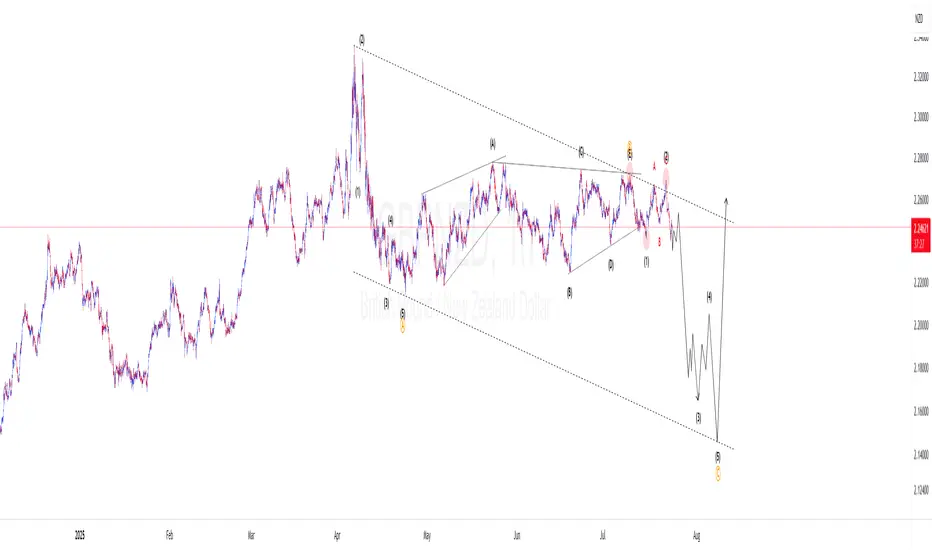
GBPNZD Elliotwaves updatePrice completed first wave of higher degree wave C. Currently price is on the lower degree wave 3. We should expect price to gain momentum to the downside creating lower lows to complete higher degree wave C. To take advantage of this short term bearish bias, one should find confluences that support a short trade.
Gbpnzd buy Gbpnzd looks set to go from here , I took this trade way too early and had to sell off and rebuy , but now the buy is a valid buy at this small pullback to support level at 2.24670 looking for a take profit around 2.25514 , this is where we could get another pullback, but could keep going, let's 👀


gbpnzd buy signal. Don't forget about stop-loss.
Write in the comments all your questions and instruments analysis of which you want to see.
Friends, push the like button, write a comment, and share with your mates - that would be the best THANK YOU.
P.S. I personally will open entry if the price will show it according to my strategy.
Always make your analysis before a trade
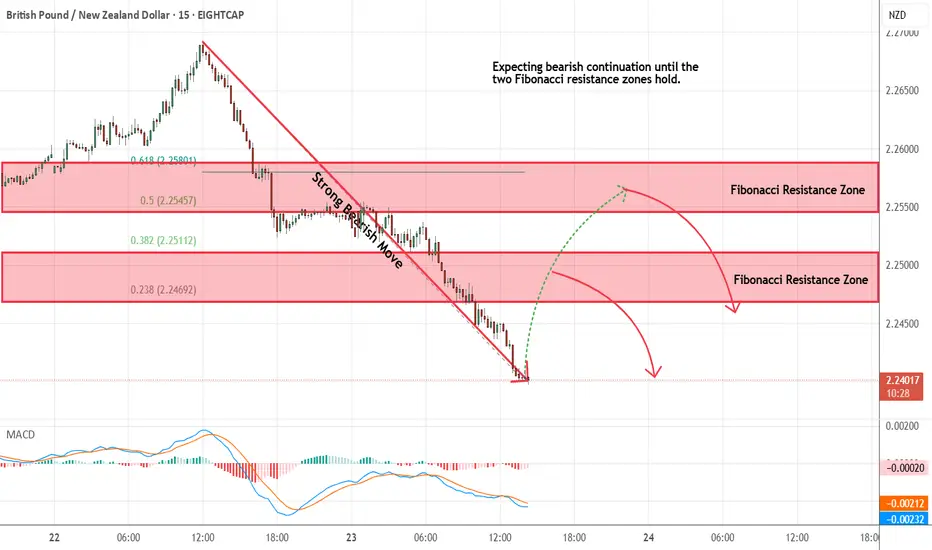
GBPNZD - Looking To Sell Pullbacks In The Short TermM15 - Strong bearish move.
No opposite signs.
Expecting bearish continuation until the two Fibonacci resistance zones hold.
If you enjoy this idea, don’t forget to LIKE 👍, FOLLOW ✅, SHARE 🙌, and COMMENT ✍! Drop your thoughts and charts below to keep the discussion going. Your support helps keep this content free and reach more people! 🚀
-----------------------------------------------------------------------------------------------------
Buy setup is forming on GBP/NZD based on the “N” pattern.I see GBP/NZD as bullish, so I plan to enter buy positions at various zones on lower timeframes as the market direction shifts.
I give special importance to the 50% level as a key decision point for entries toward the marked target.

GBPNZD🇬🇧🇳🇿 GBPNZD Swing Played Out Perfectly – TP SMASHED 🎯
Beautiful execution on GBPNZD! Price followed the analysis exactly — bounced off my marked support zone, respected structure, and delivered a clean move to full take profit.

$GBPNZD breaking outOANDA:GBPNZD breaking out after healthy consolidation at 2.24 level!
Weekly chart shows clear support established at 2.20, with price now holding above key resistance.
Bullish momentum confirmed as price respects the consolidation zone after rejecting overhead resistance. Perfect setup for continuation toward 2.30 target! #forex #technicalanalysis #bullish"

Short term sell/Long term buyPrice previously broke high to print higher high.
Right now we're in sell to fill previous liquidity around support, which incidentally is the demand zone.
Expect s trend reversal from support area for a long term buy to the new bullish break out area.

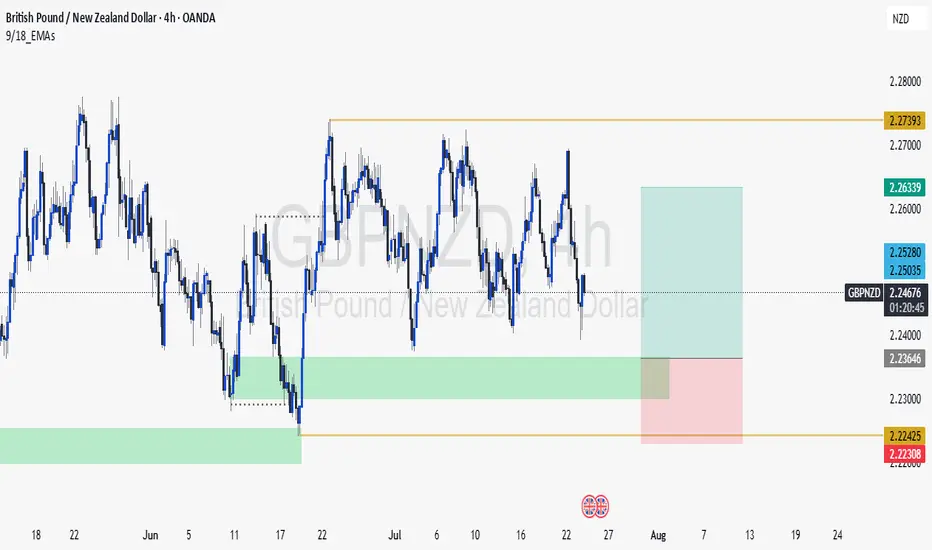
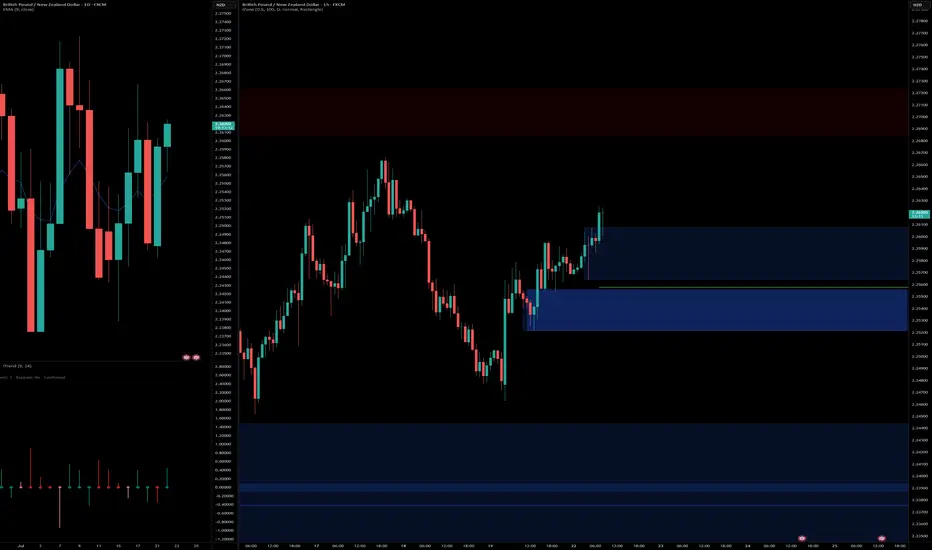
The Layout tool that Changed the Game for MeTradingView’s layout tool has really helped me stay focused. Using the 1-hour on the left and the 4-hour on the right gave me clarity. The 1H showed many Fair Value Gaps, but it was hard to know which one to trust.
The 4H chart made it easier. It showed one clean FVG lining up with the 50 to 61.8 Fib zone. That is the area I will wait for.
If price returns to that zone and I see a clear bearish confirmation candle, I will take the trade with confidence.
This layout tool has improved my analysis. I will make a short video soon to show how I use it. Big thanks to TradingView for building tools that make trading simpler and smarter.

SHORT GBPNZD Trade Highlight: Short GBPNZD
Analysis:
This trade beautifully showcased the power of technical analysis! We capitalized on the clear bearish trend with lower highs, perfecting our entry at 1.9900 just below strong resistance at 2.00. The bearish engulfing pattern reinforced our conviction, indicating potential selling pressure. Coupled with the RSI nearing overbought territory, it was a textbook setup!
Outcome:
The trade was a triumph, reaching our take profit at 1.9650 for a rewarding 250 pips! This not only validated our strategy but also underscored the importance of reading market signals accurately.
Conclusion:
This trade exemplifies how disciplined analysis and patience can lead to successful outcomes. Happy trading! 🌟

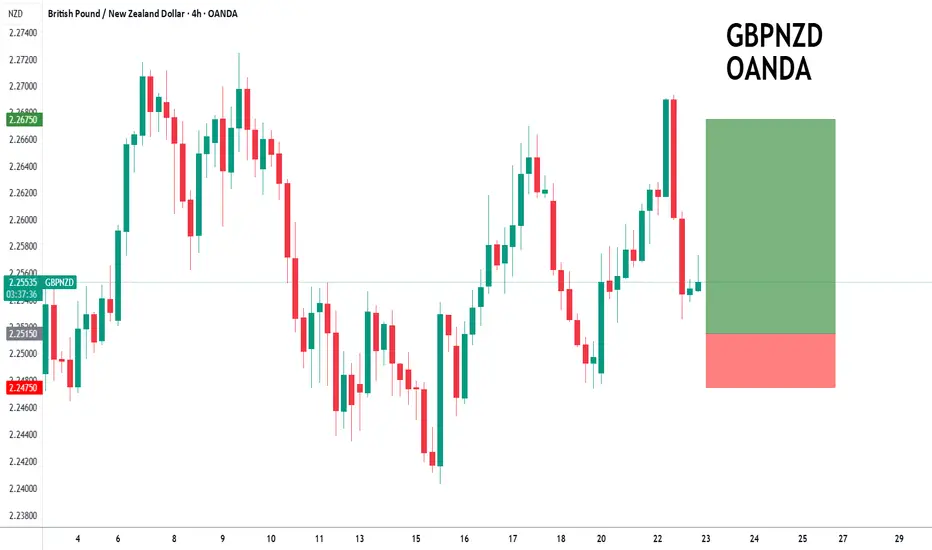
GBPNZD to form a higher low?GBPNZD - 24H expiry
The medium term bias remains bullish.
Price action looks to be forming a bottom.
Preferred trade is to buy on dips.
Bespoke support is located at 2.2515.
Risk/Reward would be poor to call a buy from current levels.
We look to Buy at 2.2515 (stop at 2.2475)
Our profit targets will be 2.2675 and 2.2710
Resistance: 2.2660 / 2.2720 / 2.2770
Support: 2.2510 / 2.2420 / 2.2375
Risk Disclaimer
The trade ideas beyond this page are for informational purposes only and do not constitute investment advice or a solicitation to trade. This information is provided by Signal Centre, a third-party unaffiliated with OANDA, and is intended for general circulation only. OANDA does not guarantee the accuracy of this information and assumes no responsibilities for the information provided by the third party. The information does not take into account the specific investment objectives, financial situation, or particular needs of any particular person. You should take into account your specific investment objectives, financial situation, and particular needs before making a commitment to trade, including seeking advice from an independent financial adviser regarding the suitability of the investment, under a separate engagement, as you deem fit.
You accept that you assume all risks in independently viewing the contents and selecting a chosen strategy.
Where the research is distributed in Singapore to a person who is not an Accredited Investor, Expert Investor or an Institutional Investor, Oanda Asia Pacific Pte Ltd (“OAP“) accepts legal responsibility for the contents of the report to such persons only to the extent required by law. Singapore customers should contact OAP at 6579 8289 for matters arising from, or in connection with, the information/research distributed.
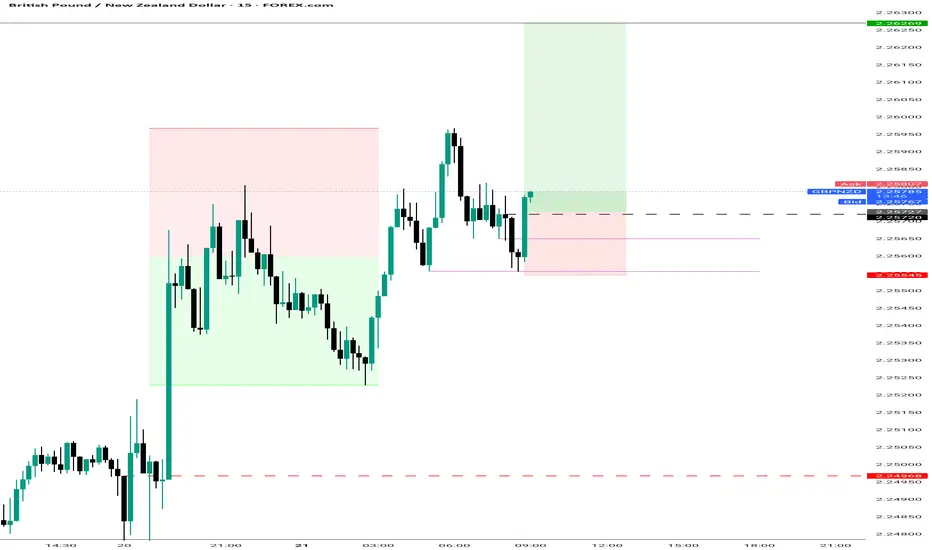
Gbpnzd buy Gbp nzd look ready for buy at current pullback buying at 2.25635 and looking to take profit at 2.26884

GBPNZD POTENTIAL LONGSHi guys, As you know I'm always sharing my thoughts with you guys and making updates. And today I'm taking a trade on GBPNZD and this is how I see it.
Do your own analysis, but I hope this helps.

GBPNZD SHORT Market structure bearish on HTFs 3
Entry at both Weekly and Daily AOi
Weekly Rejection at AOi
Previous Weekly Structure Point
Daily Rejection at AOi
Around Psycholoogical Level 2.26000
H4 Candlestick rejection
Rejection from Previous structure
Levels 4.68
Entry 95%
REMEMBER : Trading is a Game Of Probability
: Manage Your Risk
: Be Patient
: Every Moment Is Unique
: Rinse, Wash, Repeat!
: Christ is King.


gbpnzd long idea Buying from fresh demand zone after bullish structure break.
Daily showing strong momentum, 1H confirms continuation with clean break and retest zone.
📍Entry: Demand zone
🎯 Target: 2R
🛑 SL: Below demand zone
Risk-Reward: Favorable setup aligning with higher timeframe bias.
gbpnzd potential short 1:5GBPNZD Short: Entered a short position on GBPNZD. My analysis suggests a widening divergence in central bank policies, with the RBNZ appearing more hawkish than the dovish signals from the BoE

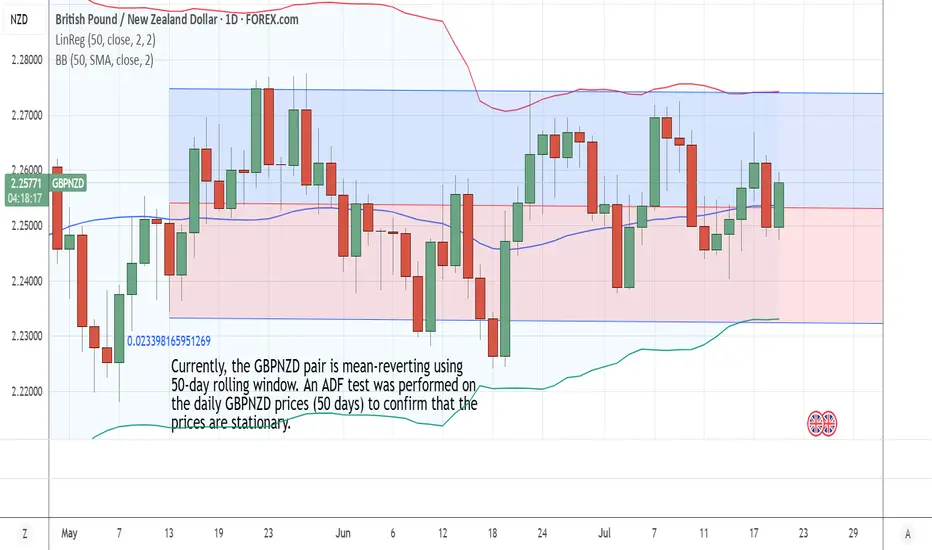
Daily Price for GBPNZD (50 day) is currently mean-revertingThe GBPNZD daily chart reveals the price has been mean-reverting for the past 50 days. An ADF test using the past 50 days was conducted and reveals that price on the GBPNZD daily chart is stationary.
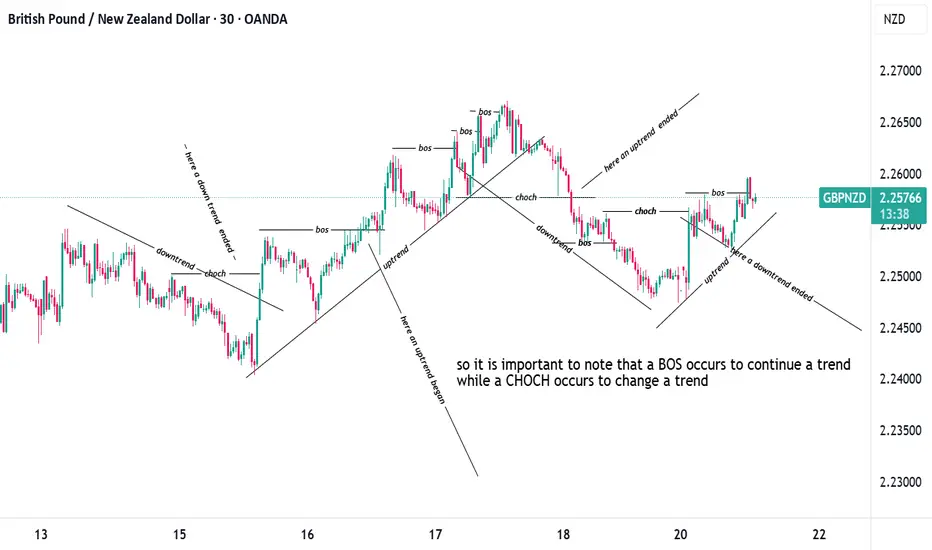
simplest explanation of BOS (break of structure) and CHOCHsimplest explanation of BOS (break of structure) and CHOCH (change of character)
i tried to simplify this as much as possible if you have any questions just reach out to me