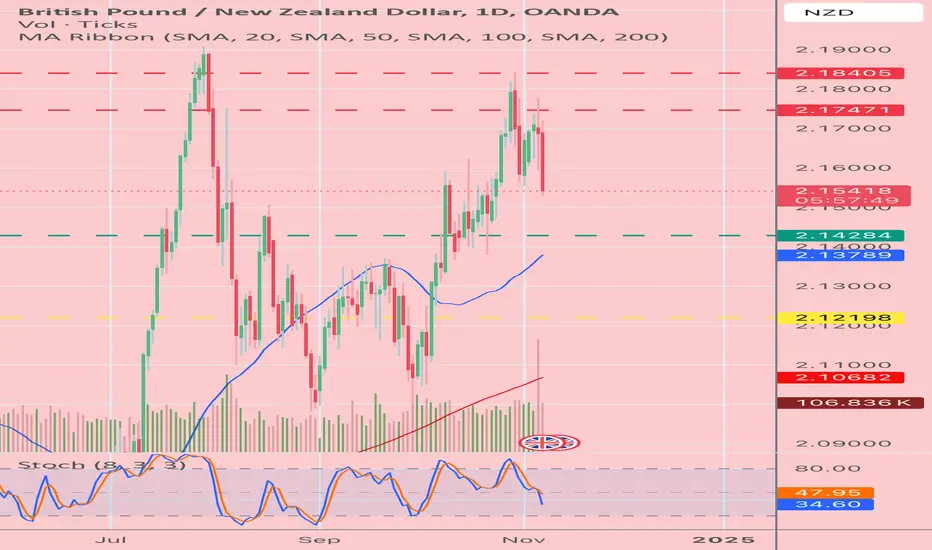
GBPNZD: Bullish Continuation & Long Trade
GBPNZD
- Classic bullish setup
- Our team expects bullish continuation
SUGGESTED TRADE:
Swing Trade
Long GBPNZD
Entry Point - 2.1473
Stop Loss - 2.1401
Take Profit - 2.1603
Our Risk - 1%
Start protection of your profits from lower levels
❤️ Please, support our work with like & comment! ❤️
GBPNZD trade ideas

GBPNZD | 11.11.2024BUY 2.15800 | STOP 2.15100 | TAKE 2.16580 | We expect a short-term upward movement to the local resistance level.

GBP / NZD another potential entry opportunity for buy.
Description :
On a daily TF we can clearly see on the picture 1 , there has been H & S pattern formation , price has then came back to neckline and shooed off to the upside.
i have personally missed the setup earlier , however chance is there for us to enter another time from a 2.15500 PSY level with a stop loss of around 35 pips to spare.
Entries condition are simple and aligned with the trade and H&S patterns normally, as the price is forming a mini support zone , we could potentially look to enter from those area if the current price retest the area. retest on those area on LDN OR NY will be very idle for entries.
the 200 ema in DTF supports the uptrend .
Look to enter the trade from smaller TF on given 2.15500 level ( if the price comes to the area ) , but trade can be taken with individual preference and entry and risk management ideas.

GBPNZD_1D_Buyhello
Analysis of the currency pair of the British pound against the New Zealand dollar
in the daily and medium-term time frames
The market is correctional in wave 4 and only by maintaining the ascending trend line and maintaining the ascending channel and the static number of 2.14800, it can move up for the target of wave 5 to the numbers 2.19236 and 2.20370.


gbpnzd buy signal. Don't forget about stop-loss.
Write in the comments all your questions and instruments analysis of which you want to see.
Friends, push the like button, write a comment, and share with your mates - that would be the best THANK YOU.
P.S. I personally will open entry if the price will show it according to my strategy.
Always make your analysis before a trade

GBPNZD is in Selling Direction after testing TrendlineHello Traders
In This Chart GBPNZD 4 HOURLY Forex Forecast By FOREX PLANET
today GBPNZD analysis 👆
🟢This Chart includes GBPNZD market update)
🟢What is The Next Opportunity on EURNZD Market
🟢how to Enter to the Valid Entry With Assurance Profit
This CHART is For Trader's that Want to Improve Their Technical Analysis Skills and Their Trading By Understanding How To Analyze The Market Using Multiple Timeframes and Understanding The Bigger Picture on the Charts

shortprice forming bearish momentum as it has been rejecting key resistance zones and forming bearish pattern

GBPNZD, Cup and Handle FormationTrade plan 1
Cup and Handle Pattern
After cup completion, handle in progress
Short sell trade on bearish channel of handle
Short @ CMP
68% retracement completed
Target at Channel Bottom
Stoploss on channel break
Trade Plan 2
Wait for completion of handle
After break of bearish channel, take entry
Ride Long position
1:5 risk to reward can be targets

Bearish BAT formationThe formation has become active and has reached its first target. After this, it may want to go to the other target, 2.18NZD levels are a strong resistance zone.

30M Bearish Breaker Block Tapped, GBPNZD to move down30M Bearish Breaker Block Tapped, GBPNZD to move down

GBPNZD - LONGHey Traders. What about to drink a little bit British tea or New Zelland coffee?
Good Luck!

GBPNZD: Very Bullish Price Action 🇬🇧🇳🇿
GBPNZD looks bullish after a test of a strong daily support.
I see a nice cup & handle pattern on that and a confirmed bullish
imbalance on a 4H time frame.
With a high probability, the price will go up at least to 2.169
❤️Please, support my work with like, thank you!❤️

RR=2 buy ideatrend strongly bullish in the long term + bullish shark pattern + breakout of double bottom's neckline ; expecting the price to rise
Ps never risk more than 2% of your capital per trade

GBPNZD | 07.11.2024BUY 2.15450 | STOP 2.14850 | TAKE 2.16250 | We expect a technical rebound of the pair from local support levels.

GBPNZD - How will the BOE decision affect the pound?The GBPNZD currency pair is above the EMA200 and EMA50 in the 4H timeframe and is moving in its medium-term bullish channel. In case of downward correction, we can see the demand zones and buy this currency pair within those zones with appropriate risk reward.
The Bank of England has lowered its interest rate by 0.25%, bringing it to 4.75%. According to the Bank’s monetary statement, GDP is projected to grow by 0.2% in Q3 2024 compared to the previous quarter (September forecast: 0.3%) and increase by 0.3% in Q4 this year. The goal is to keep the interest rate restrictive enough until the risks of inflation persistently returning to the 2% target diminish.
Andrew Bailey, the Bank of England’s governor, noted that the rate of inflation decline has been faster than expected. However, further reduction in service price inflation is still needed to maintain the consumer price index at the 2% target level, and sufficient spare capacity will be essential to reach this goal in the medium term.
The rise in the employer’s national insurance contribution, included in the budget, is expected to have a slightly inflationary effect on prices and a marginally negative impact on wages and corporate profitability. The combined effect of increased employer national insurance and minimum wage is likely to raise hiring costs, with the net impact on inflation yet to be determined.
Adrian Orr, the Reserve Bank of New Zealand’s governor, highlighted geopolitical tensions as a significant risk to the economy, expressing concern over the economy lagging behind the interest rate cuts.
Orr also emphasized that climate change poses an existential threat to New Zealand, calling for serious attention to this issue. This view reflects deep economic and environmental concerns in the country.
The Reserve Bank of New Zealand’s Financial Stability Report indicates that the financial system remains resilient despite the economic downturn, with risks under control. Banks anticipate a slight increase in non-performing loans, although this level remains below what was experienced during previous economic recessions. Debt servicing costs have peaked and are now declining, with mortgage interest rates dropping over the past six months. Although many households and businesses are under financial pressure and some borrowers face challenges with rising unemployment, domestic economic challenges persist.

GBPNZD next possible moveWe are waiting for our asset to reach our action zone, and based on the reaction, we’ll decide on our next moves.ALWAYS WAIT FOR A CONFIRMATION TO SEE IF THE PRICE VALIDATES THE ZONE.

GBPNZD - Post-ECBGenerally I like commodity assets after the election - which can be viewed as contrary to consensus - but GBPNZD should get some help lower after BOE rate cut. I am already in profit and added a second bullet taken this morning. Red lines are entries areas and green and yellow are targets 1 and 2. Trade small and handle drawdowns with proper techniques. See links for trading academy.
GBP/NZD Broke The Support And Ready To Go Down , Don`t Miss !We have a very good closure below our support and great chance to sell this pair for more 150 pips at least , if we have a daily closure below , it will be a great confirmation to can be sure it will go down more and more
This Is An Educational + Analytic Content That Will Teach Why And How To Enter A Trade
Make Sure You Watch The Price Action Closely In Each Analysis As This Is A Very Important Part Of Our Method
Disclaimer : This Analysis Can Change At Anytime Without Notice And It Is Only For The Purpose Of Assisting Traders To Make Independent Investments Decisions.

GBPNZD: Important Breakout & Bearish OutlookGBPNZD has broken and closed below a strong horizontal support level on intraday charts.
The blue area marked is also the neckline of an inverted cup & handle pattern.
This violation could lead to further downward movement, with the next targets being 2.148 and then 2.141, support level.
Traders may want to look for opportunities to enter short positions on a retest of the broken support level.

GBPNZD / M15 / LONGGBPNZD Potential Rise from the Bullish Order Block
Bullish Order Block: 2.16193 and 2.16070
Analysis: GBPNZD is approaching a key bullish order block between 2.16193 and 2.16070. Based on Smart Money Concepts (SMC), this zone is identified as a high-probability support area where institutional buyers may be active. The price previously tested this order block and is showing signs of support, indicating a potential upward move.
Trade Setup:
Entry Zone: Within the order block (2.16193 to 2.16070)
Target Levels: Looking for price action to potentially reach previous resistance levels, aiming for a profit zone above the order block.
Stop Loss: Set just below the lower boundary of the order block for effective risk management.
Expectation: There is a strong probability that GBPNZD will respond positively to the order block and rise in the short to medium term. We'll keep an eye on price action and any signs of bullish momentum that confirm the trade setup.
Entry :- 2.16198
TP :- 2.16684
SL :- 2.15715

GBPNZD LETSSS GO Buy GBPNZD. Price has mitigated a Bullish 1 hour Fair Value Gap and is set for a move to the upside.

GBPNZD Will Go Up! Buy!
Please, check our technical outlook for GBPNZD.
Time Frame: 12h
Current Trend: Bullish
Sentiment: Oversold (based on 7-period RSI)
Forecast: Bullish
The market is on a crucial zone of demand 2.161.
The oversold market condition in a combination with key structure gives us a relatively strong bullish signal with goal 2.180 level.
P.S
We determine oversold/overbought condition with RSI indicator.
When it drops below 30 - the market is considered to be oversold.
When it bounces above 70 - the market is considered to be overbought.
Like and subscribe and comment my ideas if you enjoy them!
