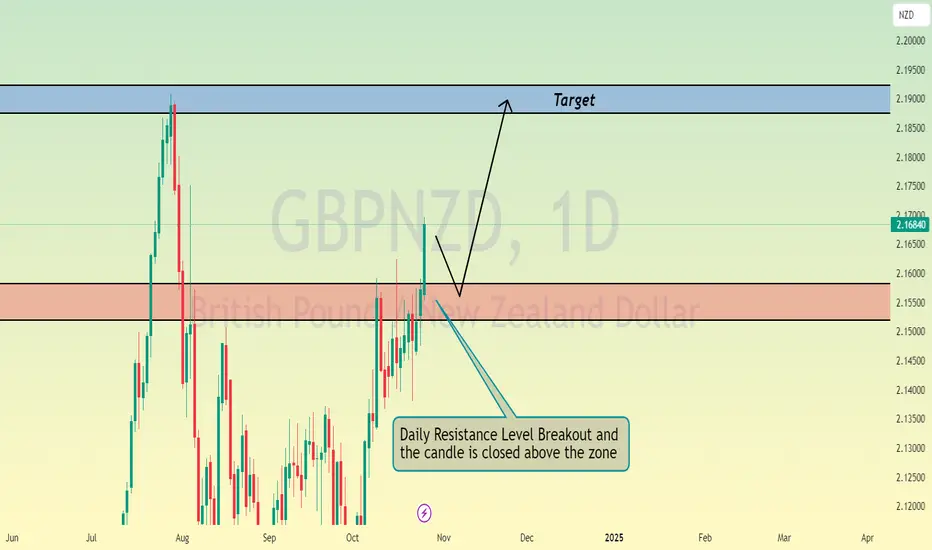
GBPNZD: More Growth is Coming?! 🇬🇧🇳🇿
GBPNZD has a perfect potential to continue growing
after a violation of a resistance line of a consolidation range on a daily.
Next resistance is 2.187
❤️Please, support my work with like, thank you!❤️
GBPNZD trade ideas

GBP/NZDGBP/NZD. I have the following preview for this pair>> I would expect Liq to reach, on 4H TF we are Bullish. On 30M TF we closed above today's VAH and we closed above the short m2. I have a lot of support below me that the price should hold >> we have wPOC, 2x M2 Long, vpocr and the edge of 4H M2. I have a stoploss below the second Longovoz M2 with PT on the Liq selection and hitting the untested short M2.

GBPNZD 4hr BUY STOP GBPNZD
📈 4hr BUY STOP 📈
💰BUY STOP: 2.17273
💰STOP LOSS: 2.16528
TP TARGETS
🎯 TP1: 2.18024
🎯 TP2: 2.18765
🎯 TP3: 2.19507
✅ 1. Daily Time Frame: Price has been breaking bullish and trending above the 10/50/200 EMAs.
✅ 2. 4hr Time Frame: Price has made a valid pullback into the 10 EMA with at least 2 bearish candles.
✅ 3. Price has made a 123 Advanced Engulfing candle above the 50ema.
This is a great example of the 123 Advanced Engulfing strategy.
NOTE: If price does not reach my BUY STOP level and fails below the 50ema then I will cancel the buy stop order, very important we do this and not accidently leave the position on.

GBPNZD | 29.10.2024SELL 2.17700 | STOP 2.18500 | TAKE 2.16700 | During the European session, the pair's quotes grew smoothly and are currently holding around the 2.17700 mark. We expect a corrective downward movement. Some pressure on the pound's position is exerted by statistics on retail price indices. This indicator also indirectly indicates a further easing of inflation risks, allowing the Bank of England to move to a more aggressive reduction in borrowing costs.

GBPNZD: Expecting Bullish Movement! Here is Why:
Remember that we can not, and should not impose our will on the market but rather listen to its whims and make profit by following it. And thus shall be done today on the GBPNZD pair which is likely to be pushed up by the bulls so we will buy!
❤️ Please, support our work with like & comment! ❤️

The Art of War for Traders: Sun Tzu's Timeless Lessons on MarketI recently revisited "The Art of War by Sun Tzu", and I was struck by how directly its timeless wisdom applies to the world of trading.
Written over 2,500 years ago, this classic on strategy offers lessons every trader—from beginners to seasoned pros—can apply in the markets to improve discipline, timing, and decision-making.
The Art of War is often seen as a manual for military generals, but its insights go far beyond the battlefield. Sun Tzu’s advice on strategy, patience, and self-discipline is surprisingly relevant for traders.
In many ways, trading is a battle—one fought not only with the market but also with our own emotions and impulses. Here are some key takeaways from The Art of War and how they can help elevate your trading game.
1. Know Your Enemy and Know Yourself
Sun Tzu’s advice, “If you know the enemy and know yourself, you need not fear the result of a hundred battles,” is invaluable in trading. For traders, the “enemy” is the market itself, filled with unpredictable movements, different participants, and countless psychological traps.
But perhaps the most important part is knowing yourself—your strengths, weaknesses, risk tolerance, and emotional triggers.
Trading Insight: Self-awareness is crucial for consistent success. By understanding your own psychology, you can prevent impulsive decisions, recognize patterns in your behavior, and develop a trading plan that works in harmony with your strengths. The better you know yourself, the better you can handle whatever the market throws at you.
2. Strategize Rigorously, But Act Flexibly
Sun Tzu stresses the need for detailed planning but also emphasizes the importance of adapting to changing conditions. In trading, a plan is essential—it gives you structure and discipline. But markets are fluid and can shift without warning, meaning flexibility is equally important.
Trading Insight: Create a well-defined trading plan that includes entry and exit strategies, position sizing, and risk management. At the same time, be ready to adapt if the market changes direction.
Many successful traders know that the best plan is one that’s firm yet flexible, allowing for adjustments as new data comes in.
3. Timing is Key
Patience and timing are central to Sun Tzu’s teachings. He emphasizes waiting for the perfect moment to strike. In trading, this principle cannot be overstated. Good timing separates profitable trades from losses; a premature entry or exit can wipe out gains or magnify losses.
Trading Insight: Success in trading often comes from waiting for high-probability setups, rather than forcing trades when conditions aren’t ideal.
The best opportunities require patience. Rather than feeling pressured to trade constantly, seasoned traders know that waiting for the right conditions is a form of discipline that pays off over time.
4. Position Yourself Wisely
Positioning is at the core of The Art of War. Sun Tzu advises placing troops in positions of strength, not vulnerability, which translates directly to trading. Positioning wisely means knowing where to enter and exit, as well as how much risk to take on any trade.
Trading Insight: Position sizing and strategic entry/exit points are essential for managing risk. Set stop-losses to guard against heavy losses and choose setups where you have a statistical edge.
Success comes from positioning yourself to gain while limiting potential losses—whether you’re a day trader or a long-term investor.
5. Discipline and Self-Control
Sun Tzu repeatedly emphasizes the importance of discipline and self-restraint. A general who cannot control himself will struggle to control his troops, and the same goes for traders. Without discipline, a trading plan is just words on paper.
Trading Insight: In trading, self-discipline means sticking to your plan, managing your risk, and resisting impulsive decisions driven by emotions. This is a skill that separates successful traders from those who struggle.
Discipline keeps you from chasing trades, overtrading, or taking unnecessary risks. It’s the backbone of consistency.
6. Exploit Market Weaknesses and Protect Your Own
Sun Tzu teaches the value of observing and exploiting the weaknesses in the enemy while concealing your own. In trading, this might mean identifying overbought or oversold conditions, weak trends, or moments of market irrationality.
Trading Insight: Recognize when the market is at extremes and leverage these moments for high-probability setups. At the same time, protect your portfolio by diversifying and using stop-losses, ensuring that if a trade doesn’t work out, it doesn’t do significant damage.
Trade with your strengths and protect against your weaknesses.
7. Beware of Deception and False Signals
One of Sun Tzu’s core principles is the use of deception, creating the illusion of weakness or strength. Markets can often create similar illusions through false breakouts, price manipulations, and fakeouts, which can easily lead to poor decisions.
Trading Insight: Avoid falling for obvious “traps” in the market. False breakouts and fake signals are common, especially in highly volatile markets.
Experienced traders look beyond surface movements and analyze underlying trends to verify signals. Being cautious and vigilant can prevent costly mistakes.
8. Use Resources Efficiently
Sun Tzu cautions against prolonged battles that drain resources and morale. In trading, this equates to overtrading or letting emotions lead to excessive losses.
Trading Insight: Efficiently allocate your capital and avoid trading more than necessary. Protecting your capital allows you to stay in the game for the long run.
If a trade setup doesn’t meet your criteria, move on. Wasting resources on low-quality trades is like fighting unnecessary battles.
9. Calculated Risk and Risk Management
Sun Tzu emphasizes knowing when to engage and when to hold back. For traders, this is the heart of risk management. Taking calculated risks is essential for capturing profits, but knowing when to step away is just as important.
Trading Insight: Risk management is fundamental to long-term success. Use tools like stop-losses, position sizing, and risk-to-reward ratios to control losses.
Accept that not every trade will be a winner and cut your losses when needed. This protects your capital and keeps you from getting overly attached to individual trades.
10. Seize Opportunities with Confidence
Sun Tzu believes in the importance of seizing opportunities when they arise. In trading, this means acting decisively when a setup aligns with your strategy and conditions are favorable.
Trading Insight: Hesitating can lead to missed opportunities, while decisive action—grounded in a solid strategy—can yield significant profits.
When the conditions align with your analysis, trust your instincts and execute your plan. The ability to recognize and seize opportunities is what distinguishes successful traders from the rest.
The Art of War has taught me that trading, much like warfare, is a game of patience, discipline, and strategy. Sun Tzu’s principles remind us that success doesn’t come from battling the market but from managing our responses to it.
Every trade is a test of how well you can plan, adapt, and stay disciplined under pressure.
As you navigate the markets, remember Sun Tzu’s timeless advice. Approach trading as a strategist would approach battle—prepare thoroughly, act wisely, and remain adaptable.
Success in trading is not just about making profits; it’s about managing yourself, seizing opportunities, and protecting your resources for the long run.
Let me know your thoughts below

#37102024 | GBPNZD Supply Zone 1:15GBPNZD 1:15 Supply Zone Appears in D1 Time Frame Looking Price Action for Long Term Sell
Risk and Reward Ratio is 1:15
After 50 pips Profit Set SL Entry Level
"DISCLAIMER" Trading & investing business is "Very Profitable" as well as risky, so any trading or investment decision should be made after Consultation with Certified & Regulated Investment Advisors, by Carefully Considering your Financial Situation.

GBP/NZD Ready For Some Bullish ActionGoing long on GBPNZD for 3 reasons
1. Breakout Confirmation
2. Inverted H/S neckline breakout confirmation
3. 1:2 Risk to Reward.
Price may continue to move higher if the data release doesn't mess stuff up for the pair this week.
Note: Trade with caution and manage your position volume wisely.


Sell.gbpnzdCurrently trading in a strong buy trend buy weekly strongest supply zone reached
100% sure it will respect it again and big fall coming minimum sell tp 500 pips

GBP/NZD SHORT FROM RESISTANCE
Hello, Friends!
Previous week’s green candle means that for us the GBP/NZD pair is in the uptrend. And the current movement leg was also up but the resistance line will be hit soon and upper BB band proximity will signal an overbought condition so we will go for a counter-trend short trade with the target being at 2.160.
✅LIKE AND COMMENT MY IDEAS✅

BUY GBPNZD - entry strategy explained Trader Tom, a technical analyst with over 15 years’ experience, explains his trade idea using price action and a top down approach. This is one of many trades so if you would like to see more then please follow us and hit the boost button.
We are proud to be an OFFICIAL Trading View partner so please support the channel by using the link below and unleash the power of trading view today!
www.tradingview.com

GBPNZD Pushing itself in a buy directionHello Traders
In This Chart GBPNZD 4 HOURLY Forex Forecast By FOREX PLANET
today GBPNZD analysis 👆
🟢This Chart includes GBPNZD market update)
🟢What is The Next Opportunity on EURNZD Market
🟢how to Enter to the Valid Entry With Assurance Profit
This CHART is For Trader's that Want to Improve Their Technical Analysis Skills and Their Trading By Understanding How To Analyze The Market Using Multiple Timeframes and Understanding The Bigger Picture on the Charts
GBPNZD At its resistance Point. Ready for SellAs the market is running above a trend line which is acting as support for the price. now the market is facing a resistance level, where rejection is possible.

GBPNZD longGBPNZD jus completed a correction with a clear breakout for long (Daily resistance broken). Looking to swing this possibly until the boxed area.

GBP/NZD long trade Education purpose onlyRecently, we saw weakness in NZD and strength in GBP. So, maybe this will move GBP. Let's see what will be happening...

GBPNZD A Fall Expected! SELL!
My dear followers,
I analysed this chart on GBPNZD and concluded the following:
The market is trading on 2.1630 pivot level.
Bias - Bearish
Technical Indicators: Both Super Trend & Pivot HL indicate a highly probable Bearish continuation.
Target - 2.1480
Safe Stop Loss - 2.1717
About Used Indicators:
A super-trend indicator is plotted on either above or below the closing price to signal a buy or sell. The indicator changes color, based on whether or not you should be buying. If the super-trend indicator moves below the closing price, the indicator turns green, and it signals an entry point or points to buy.
———————————
WISH YOU ALL LUCK

GBPNZD: Bullish Trend Maintains MomentumGBPNZD is currently in a strong uptrend. After reaching a recent high, the market has begun consolidating within a narrow parallel channel on the 4-hour chart.
A break above resistance indicates that the upward momentum is likely to persist, with an anticipated target price of 2.1701.

GBPNZD: Bullish Trend ContinuesGBPNZD is currently experiencing a significant uptrend.
Following a new high, the market has entered a period of consolidation within a tight parallel channel on a 4-hour chart.
Breaking through resistance suggests that the upward momentum will continue. I anticipate the price to reach 2.1701.

GN update expecting a berry river sir from GN since price has broken the bullish peannat formation
Expecting price to hit the bottom of the support of the ascending channel
