demo ict liquidity sweep market structure shift entry into fvgdemo trade ict liquidity sweep market structure shift with entry into fvg
GBPUSD.1.MINI trade ideas


#gbpusdThe price can return to the signal range and we enter the trade there. There are two levels, one with low risk and the other with higher risk, and you can enter at both levels.

GBPUSD AnalysisGBP could potentially start its next bearish leg from the current level.
Price has reacted off a lower timeframe IFVG, which is currently acting as support.
If we get a clean close below this IFVG, along with proper short confirmation,
I'll be looking for bearish setups to target lower levels

Long trade
15min TF Overview
📈 Buyside Trade – GBPUSD
Date: Wednesday, 23rd April 2025
🕘 Time: 8:55 AM (New York Time)
📊 Session: London Session AM
⏱ Entry Timeframe: 5 Minutes
🔹 Entry Price: 1.33029
🔹 Take Profit: 1.33829 (0.60%)
🔹 Stop Loss: 1.32958 (0.05%)
🔹 Risk-Reward Ratio: 11.27
🧠 Trade Rationale & Execution Notes: (Market Context)
Identified a strong bullish structure in the LND session with price respecting prior demand zones.
📉 Volume & Price Spread Insight: Medium to higher volume consistency shows on the Volume spread analysis indicator, providing additional validation of buying interest to add confluence to the directional bias.
5min TF


GBPUSD Analysis 10:06AM. Are the Bear's stepping in? I’ve been watching GBP/USD closely as price continues to slide, now reaching 1.32848. The initial rejection near 1.33250 confirmed institutional sell pressure, and the breakdown below 1.32950 suggests further downside movement.
At this stage, price is sitting just above the 1.32750–1.32800 support zone, which could act as a temporary demand level. If buyers step in here, we might see a corrective bounce toward 1.33050–1.33250, but only with solid confirmation. However, fundamentals remain bearish—UK Services PMI dropped to 48.9, signaling economic contraction, adding further weight to GBP downside.
Technical indicators reinforce the sell-side momentum. MACD remains weak, indicating sellers still control the market. RSI near 41.70 suggests there’s room for further declines but signals that price is approaching oversold territory. The ADX at 29.52 confirms a developing trend, though not yet fully directional.
Given these conditions, my plan remains focused on a sell setup near 1.32950, using it as a retest level. If price rejects this zone, it strengthens the short bias toward 1.32700, a key liquidity target. On the other hand, if price stabilizes at 1.32750–1.32800, I'll reassess whether institutional players are absorbing sell orders for a potential reversal.
Right now, my focus is on price reaction near support. If sellers keep control, this drop could extend further, but if signs of buy-side defense appear, a temporary bounce may develop. I'll wait for clear confirmation before executing my next position.

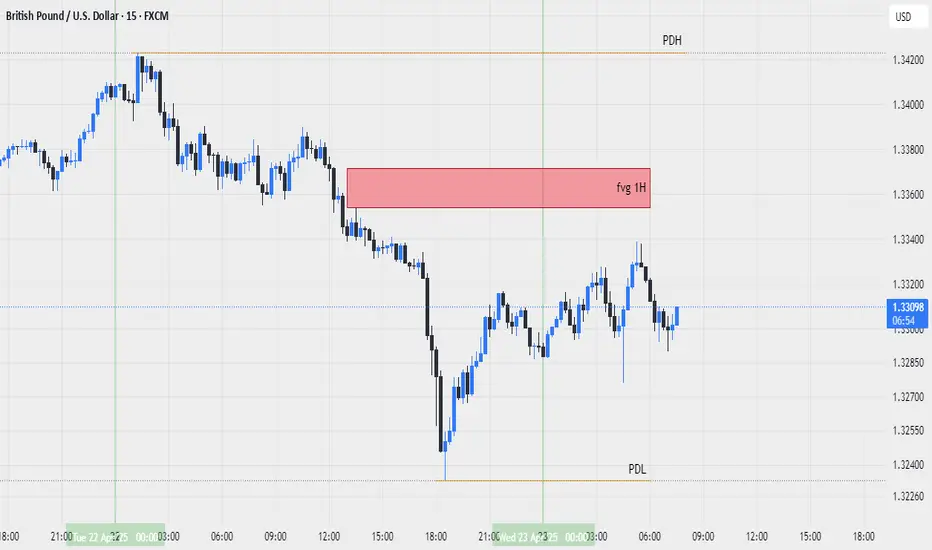
gbpusd 2025-4-23 updateafter some times new fvg 1hour create , now we waite to reach the price to this level and create down setup

gbpusd 2025-4-23we have two level for trading
fvg 1h hour on top , if price go up and acchive to this level we wait for down setup.
pdl level on down , if price go down and acchive to this level we wait for up setup.
GBPUSD 23.04.2025If price clearly rejects the 1.3335 level (with a strong bearish M15 candle), one might consider a SELL setup with a potential stop-loss above 1.3350 and targets around 1.3310 / 1.3300.
If M15 closes above 1.3345, this could indicate a potential BUY opportunity, aiming for 1.3375 with a stop-loss placed below 1.3320.
Disclaimer: This is not financial advice, just a personal opinion based on chart analysis.

GBP/USD Rejection off the daily 1.32800
I would predict this to buy back up to 1.33200 area , 1.33400 is the next major resistance level

Potential sell of GBPUSDGBPUSD is currently at a 50% fib retracement area. If it breaks a short term low, it could move to the down-side. News are coming in an hour though so anything could happen. Need more confirmation to enter (a few wicks and a break of a STL).

GBPUSD...LONGOANDA:GBPUSD
Market structure suggests is preparing for its next move. The AND level will likely play a critical role in the upcoming direction.
If structure breaks and confirms the shift, a new bias might form after the retest.

GOLDMASTER1| GBP/USD 15MIN ANALYSIS ---
GBP/USD 15-MINUTE CHART ANALYSIS :
In this chart, we observe a strong bullish move from a key Bullish Orderblock zone around the 1.32500 level. This price zone is where institutional traders are likely to have placed large buy orders, causing the price to reverse sharply after a significant drop.
As the price reached the highlighted orderblock, it bounced upward, resulting in a strong 80-pip move in the bullish direction. This price action aligns with a typical market reaction from an orderblock, where price often reverses after hitting a significant demand or supply zone.
The EQCHoCH label highlights an important market structure shift, confirming the start of a new higher high (HoCH), indicating that the bullish momentum is likely to continue.
GOLDMASTER1---

BullI was trained to trade what I see and not what I think. It’s all type of confluences that say a sell. But my break and retest is playing strong , so I did put in a buy for this pair because it broke my consolidation and res tested it so I believe it will go up now but let’s see. I’m prepared for anything.

Bear This pair is going down, that’s my bias for this week . It keeps hitting the top of my consolidation, but all that is , is fake outs . I’m waiting for it to break my consolidation going down .

TECHNICAL ANALYSIS After more than 50% retracement, GU maybe willing to go up to the upside again. Let see what will unfold in some days to come.

GBP/USD pair may form a long-term BUY trendBased on the analysis, the GBP/USD pair may form a long-term BUY trend. Based on this analysis, we can try to enter a buy position with a small risk margin.

Still bullish on the upward trend, the latest trading strategy.Today, due to the recovery of the U.S. dollar to some extent, there has been a certain pullback in the GBP/USD exchange rate. (👉signals👉)
Recently, the U.S. economic data has been performing poorly, and the U.S. dollar remains under pressure. The overall trend is still bullish. One can consider going long on dips near the support level.
Trading Strategy:
buy@1.33200-1.33500
TP:1.34000-1.34500
The signals last week resulted in continuous profits, and accurate signals were shared daily.
👇 signals👇

GBPUSD Analysis 4/22 4:51pmGBP/USD Analysis – Institutional Liquidity, Price Action & Trade Setup
Right now, I'm analyzing GBP/USD at 1.33287 in the context of institutional behavior, technical indicators, and upcoming economic events. My focus is on institutional liquidity absorption at resistance, monitoring key levels for an optimal entry.
Technical Overview
Resistance Zone: 1.33895–1.34234 has been a critical level where price struggled to break higher, suggesting institutional absorption.
Support Zone: 1.33200–1.33150 remains an area where buyers could step in, but if it fails, the next downside target is 1.32677–1.32864.
Momentum Indicators: RSI (66.15 on the hourly) signals strong momentum, but MACD shows slight bearish divergence, hinting at trend exhaustion.
ADX Strength: The 30-minute ADX at 73.43 confirms trend momentum, but the hourly ADX at 17.12 indicates slowing movement, signaling potential institutional positioning.
Price Action Insights
Lower Highs Forming: Each successive high has been failing, reinforcing the idea that sellers are stepping in at resistance.
Liquidity Absorption at 1.33895–1.34234: Institutional players might be taking the other side of buy orders, meaning a trap for retail longs before a drop.
Bearish Rejection at 1.33450–1.33600: If price pulls back to this zone and prints a long upper wick, it confirms sell-side control.
Volume Profile & Institutional Activity
Volume Clustering at Resistance: Previous highs show volume absorption rather than continuation, reinforcing a bearish bias.
Delta Imbalance Considerations: Watching sell-side aggression near key levels to confirm institutional pressure.
Accumulation/Distribution Patterns: Weekly AD is negative, indicating some distribution rather than accumulation.
This approach ensures I'm trading with institutional positioning rather than chasing price movements. I remain patient, watching key zones for liquidity absorption before executing.


GBPUSD | 21.04.2025SELL 1.33800 | STOP 1.34600 | TAKE 1.33000 - 1.32500 | We expect the price to decline from the local highs to the formed support.

Slight decrease to have liquidity for the next increase🔔🔔 GBP/USD news:
➡️ GBP/USD continues its bullish momentum, testing 1.3400 on Monday. The prolonged weakness of the US dollar, amid recession fears due to the US-China trade war and the growing threat to the independence of the Fed, strengthens the pair after the long Holy Week
Personal opinion
➡️ The RSI indicator on the 1-hour chart is falling after entering the extremely overbought zone and showing signs of a short-term decline
➡️ Note: the US-China trade war is the main focus and the Trump-Fed relationship. It is necessary to follow these 2 major news to grasp the trading trend at this time
➡️ Analysis based on resistance - support levels combined with SMA and trend lines to come up with a suitable strategy
Plan:
🔆Price Zone Setup:
👉Sell GBP/USD 1.3480 - 1.3500
❌SL: 1.3530 | ✅TP: 1.3430 – 1.3370
👉Buy Gold 1.3315- 1.3300
❌SL: 1.3270| ✅TP: 1.3370 – 1.3430
FM wishes you a successful trading day 💰💰💰
