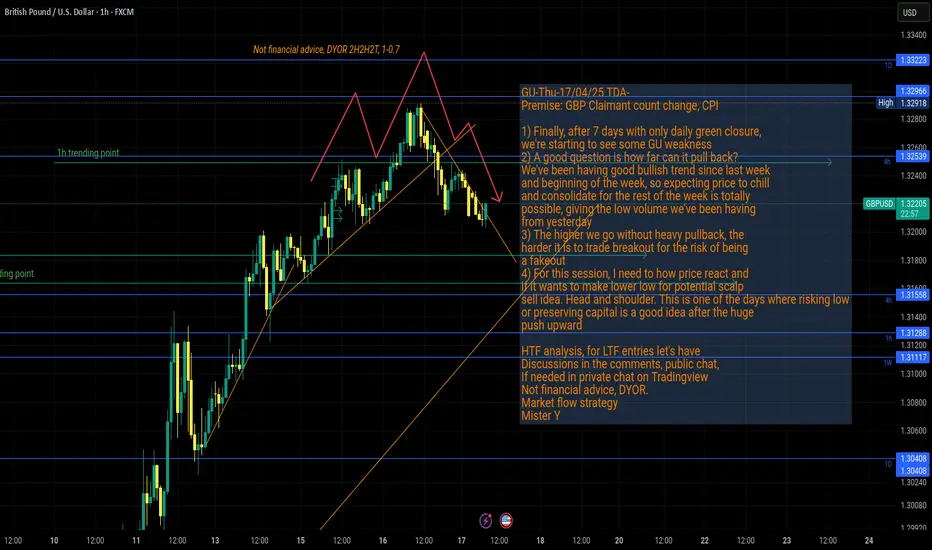
GU-Thu-17/04/25 TDA-GU starting to pullback, how far can it go?Analysis done directly on the chart
Low volume since yesterday, good
push upward since last week, will
we see some consolidation for the
rest of the week?
Not financial advice, DYOR.
Market Flow Strategy
Mister Y
GBPUSD.1.MINI trade ideas
Breakout (fully closed outside)confirmation To enter safely wait for a candle to fully close outside those rectangle OR wait for a candle to close outside, let go down just wait so a completely rest. There must be rejection in order to see that the market want to go down

GBPUSD Technical analysis 2H time frame next move dump target? Not financial advice trade and menege your owner risk

GBPUSD SHORT FORECAST Q2W W16 D17 Y25GBPUSD SHORT FORECAST Q2W W16 D17 Y25
GM GM!
- Potential 15' OB Short
- Potential 5' OB Short, lower time frame Break of structure via level
- Potential
SUMMARY
- Weekly order block rejection is the setup
- Required 15' Breaks of structure
FRGNT X

GBP-USD Free Signal! Buy!
Hello,Traders!
GBP-USD is trading in an
Uptrend and the pair is
About to retest a horizontal
Support level of 1.3181
From where we will be
Expecting a local rebound
As we are locally bullish biased
So we can enter a long trade
With the Take Profit of 1.3290
And the Stop Loss of 1.3147
Buy!
Comment and subscribe to help us grow!
Check out other forecasts below too!
Disclosure: I am part of Trade Nation's Influencer program and receive a monthly fee for using their TradingView charts in my analysis.

GBPUSD Analysis 10:40am 4/16Here’s my updated resistance zone analysis for GBP/USD, combining all the technical and fundamental data:
Resistance Levels & Why They Matter
1.3265 – Immediate Resistance
GBP/USD tested this level today, and it acted as a short-term barrier.
This level aligns with recent swing highs and pivot point calculations, making it a key area where sellers may step in.
1.3305 – Next Resistance Zone
If price breaks above 1.3265, the next resistance is around 1.3305, based on historical price action and pivot analysis.
This level has previously acted as a turning point, meaning traders may look to take profit or enter short positions here.
1.3430 – Stronger Resistance
This level was identified in recent market analysis as a former multi-month high.
If GBP/USD continues its bullish momentum, this could be a major resistance zone where price struggles to push higher.
1.3640 – Long-Term Resistance Target
If GBP/USD breaks above 1.3430, the next major resistance sits at 1.3640, which has historically been a strong reversal point.
This level represents a significant psychological barrier, where traders may reassess the trend direction.
How I Derived These Levels
Price Action Review: I analyzed recent swing highs and lows to identify key turning points.
Pivot Point Calculations: Using the formula (High + Low + Close)/3, I confirmed resistance zones that align with historical price behavior.
Market Analysis: External sources also highlighted 1.3430 and 1.3640 as critical resistance levels2.
Moving Averages & Trendlines: These levels coincide with key moving averages, reinforcing their importance.
Final Thoughts
With GBP/USD currently at 1.32464, I’m watching 1.3265 as the immediate resistance. If price breaks above that, 1.3305 is the next target, followed by 1.3430 and 1.3640 for longer-term moves. These levels are based on a combination of technical indicators, price action, and external market analysis.
PLEASE BE ADVISED THAT THINGS CAN CHANGE..! PLEASE FOLLOW MY ANALYSIS TO OBTAIN ANY UPDATED INFO REGARDING GBPUSD.

GBPUSD Analysis - Weekly Market Analysis This is my weekly market analysis, specifically for GBPUSD.
I share what I think is going to happen in terms of the PDA Matrix as it pertains to ICT concepts, as well as time considerations such as economic news events.
I hope you find it insightful in your trading.
- R2F Trading

GBPUSD: Strong Bullish Market 🇬🇧🇺🇸
GBPUSD set a new daily high today.
The pair remains in a strong bullish momentum since 8th of April.
With the complete absence of high impact fundamentals today, buying pressure
may persist.
I believe that it may continue rising at least to 1.33 - the closest historic resistance.
❤️Please, support my work with like, thank you!❤️
I am part of Trade Nation's Influencer program and receive a monthly fee for using their TradingView charts in my analysis.

GBP/USD Daily AnalysisPrice is in a strong bullish trend.
After 6 bullish candles, we may now see a correction back towards the moving averages as profit taking occurs.
This is just an idea of what may happen. Always trade with a profitable strategy and good risk management.

GBPUSD Bullish ChannelIt looks as though GBPUSD is about to expand higher in this exponential resistance pattern. I am awaiting a retest on the trend line before a bounce higher.

A rejection near current resistanceEntry after confirmation of bearish momentum.
Confirm with momentum indicators (e.g., RSI divergence or MACD crossover)
Targeting a move back toward previous structure lows.

#GBPUSD: Two Prominent Buying Points! Will Dxy Bounce Back? Due to strong economic data supporting GBP, its price has been bullish throughout the week, especially since DXY plunged. Given ongoing trade tensions, we may see another higher high. This is risky, so please analyse it yourself.
Like and comment to support us in bringing more analysis.
Have a great weekend! ❤️
Team Setupsfx_

GBPUSD I Weekly CLS I KL - OB I Model 2, Target HTF OBHey, Market Warriors, here is another outlook on this instrument
If you’ve been following me, you already know every setup you see is built around a CLS range, a Key Level, Liquidity and a specific execution model.
If you haven't followed me yet, start now.
My trading system is completely mechanical — designed to remove emotions, opinions, and impulsive decisions. No messy diagonal lines. No random drawings. Just clarity, structure, and execution.
🧩 What is CLS?
CLS is real smart money — the combined power of major investment banks and central banks moving over 6.5 trillion dollars a day. Understanding their operations is key to markets.
✅ Understanding the behaviour of CLS allows you to position yourself with the giants during the market manipulations — leading to buying lows and selling highs - cleaner entries, clearer exits, and consistent profits.
🛡️ Models 1 and 2:
From my posts, you can learn two core execution models.
They are the backbone of how I trade and how my students are trained.
📍 Model 1
is right after the manipulation of the CLS candle when CIOD occurs, and we are targeting 50% of the CLS range. H4 CLS ranges supported by HTF go straight to the opposing range.
📍 Model 2
occurs in the specific market sequence when CLS smart money needs to re-accumulate more positions, and we are looking to find a key level around 61.8 fib retracement and target the opposing side of the range.
👍 Hit like if you find this analysis helpful, and don't hesitate to comment with your opinions, charts or any questions.
⚔️ Listen Carefully:
Analysis is not trading. Right now, this platform is full of gurus" trying to sell you dreams based on analysis with arrows while they don't even have the skill to trade themselves.
If you’re ever thinking about buying a Trading Course or Signals from anyone. Always demand a verified track record. It takes less than five minutes to connect 3rd third-party verification tool and link to the widget to his signature.
"Adapt what is useful, reject what is useless, and add what is specifically your own."
— David Perk aka Dave FX Hunter ⚔️

GBPUSD: Intraday Bullish Move Ahead! 🇬🇧🇺🇸
I see 2 strong intraday price action signals
on GBPUSD on an hourly time frame.
The price formed a double bottom pattern after a test of the underlined support.
Its neckline and a resistance line of a falling channel were broken
with London session opening.
We can expect a bullish continuation now.
Goal - 1.3271
❤️Please, support my work with like, thank you!❤️

GBP/USD.. GBPUSD 1 DAY CHART PATTERN✨ GBPUSD Trade Setup
Technical Analysis:
GBP/USD is showing bearish pressure and presents a short opportunity from current levels.
Entry: 1.34000
Targets:
Target 1: 1.30000
Target 2: 1.27000
Bias: Bearish
Confirmation: Price action suggests downside continuation
---
Want all your trade setups (ETH, BTC, GOLD, GBPUSD) combined into a single professional signal sheet?

GBPUSD - Tariffs Are Great For The United KingdomYou'd think that with all the tariffs being imposed on different countries, including the UK, the currency market would take a freefall....
So we all thought... Since the beginning of January 2025, Cable has been on a raging rally, gaining close to 10% if you were holding sterling in comparison to the US dollar.
With the 90 days hold on tariffs in full swing, will cables sentiment change in the near term?

GBPUSD Analysis 4/18 11:13amI've been analyzing GBP/USD closely over the past few days, and here's where I stand. The daily historical data shows an overall uptrend from around 1.278 on April 9 to roughly 1.328 on April 18. Although the price has been climbing, I've noticed that momentum is starting to taper off, which makes me question whether this rally might be overextended.
On the fundamentals side, a series of high-impact events are coming up. For example, recent UK PMI readings have come in slightly weaker—manufacturing at 44.1 and services at 51—while US indicators like PMIs and housing data have shown mixed results, such as an unusually sharp drop in New Home Sales MoM. These data points suggest both the dollar and the pound are facing headwinds, and they add a layer of uncertainty over the near-term direction.
Technically, I've set up a sell trade at 1.32480 with the current price now at 1.32830. My chart tells me that if the market dives further.
Overall, while the short-term setup shows some bullish energy, the divergence with longer-term daily averages and the mixed fundamental data make me cautious. I'll be watching for a pullback toward those support levels that might validate my bearish stance.
That's it for me for today.. unless something unexpected happens ..
Have a great weekend!
BTW im looking for another pair to trade comment below your recommendations and why! Thanks!

GBPUSDIn summary, the GBP/USD pair is currently in a bullish phase, with the potential for further gains if it sustains momentum above key resistance levels. Nonetheless, traders should remain vigilant for any signs of reversal or changes in fundamental factors that could affect the currency pair's performance.

GBPUSD I Short Opportunity Coming Soon Welcome back! Let me know your thoughts in the comments!
** GBPUSD Analysis - Listen to video!
We recommend that you keep this pair on your watchlist and enter when the entry criteria of your strategy is met.
Please support this idea with a LIKE and COMMENT if you find it useful and Click "Follow" on our profile if you'd like these trade ideas delivered straight to your email in the future.
Thanks for your continued support!Welcome back! Let me know your thoughts in the comments!

#gbpusdYou can enter during the daily timeframe and after crossing the risk-free line, you can close or continue the trade.

Inflation in the UK Has FallenInflation in the UK Has Fallen
According to Forex Factory, the Consumer Price Index (CPI) reading came in below expectations: while analysts had forecast a decline to 2.7% year-on-year from the previous 2.8%, the actual CPI figure was 2.6%.
Following the release of this news, the GBP/USD exchange rate rose to 1.3280 – the highest level in seven months.
On the one hand, falling inflation is a sign of a healthy economy and a relief for the Bank of England, especially considering that CPI stood in double digits just two years ago. As a result, analysts may now predict that interest rates could be cut at the meeting scheduled for 8 May.
On the other hand, demand for the dollar remains volatile due to Trump’s tariff policies, fears of a US recession, and a wave of bond sell-offs.
Technical Analysis of the GBP/USD Chart
In just one week, the pound-to-dollar rate has risen by approximately 4.2%, with the RSI indicator now hovering near extreme overbought levels. Furthermore, the price is approaching the upper boundary of the ascending channel, which has been in play since the beginning of 2025.
In such conditions, a correction (with a bearish breakout of the ascending trendline, shown in blue) appears a logical development. However, a key factor in sustaining the current trend of dollar weakness could be the speech by Federal Reserve Chair Jerome Powell, scheduled for today at 20:30 GMT+3.
This article represents the opinion of the Companies operating under the FXOpen brand only. It is not to be construed as an offer, solicitation, or recommendation with respect to products and services provided by the Companies operating under the FXOpen brand, nor is it to be considered financial advice.

GBPUSD is in the Selling DirectionHello Traders
In This Chart GBPUSD HOURLY Forex Forecast By FOREX PLANET
today GBPUSD analysis 👆
🟢This Chart includes_ (GBPUSD market update)
🟢What is The Next Opportunity on GBPUSD Market
🟢how to Enter to the Valid Entry With Assurance Profit
This CHART is For Trader's that Want to Improve Their Technical Analysis Skills and Their Trading By Understanding How To Analyze The Market Using Multiple Timeframes and Understanding The Bigger Picture on the Charts

Super Short then Super Long!Hello all. I think market is making subwaves for a big picture. Market passed some very important levels and needs to go higher. A Critical zone can push the price lower and then a Node can cause the price to jump. be happy and have a nice life* (wink)
