Bullish bounce off overlap support?GBP/USD is falling towards the support level which is an overlap support that aligns with the 23.6% Fibonacci retracement and could bounce from this level to our take profit.
Entry: 1.3173
Why we like it:
There is an overlap support level that lines up with the 23.6% Fibonacci retracement.
Stop loss: 1.3105
Why we like it:
There is a pullback support level that is slightly above the 38.2% Fibonacci retracement.
Take profit: 1.3291
Why we like it:
There is a pullback resistance level.
Enjoying your TradingView experience? Review us!
Please be advised that the information presented on TradingView is provided to Vantage (‘Vantage Global Limited’, ‘we’) by a third-party provider (‘Everest Fortune Group’). Please be reminded that you are solely responsible for the trading decisions on your account. There is a very high degree of risk involved in trading. Any information and/or content is intended entirely for research, educational and informational purposes only and does not constitute investment or consultation advice or investment strategy. The information is not tailored to the investment needs of any specific person and therefore does not involve a consideration of any of the investment objectives, financial situation or needs of any viewer that may receive it. Kindly also note that past performance is not a reliable indicator of future results. Actual results may differ materially from those anticipated in forward-looking or past performance statements. We assume no liability as to the accuracy or completeness of any of the information and/or content provided herein and the Company cannot be held responsible for any omission, mistake nor for any loss or damage including without limitation to any loss of profit which may arise from reliance on any information supplied by Everest Fortune Group.
GBPUSD.1.MINI trade ideas

Long trade
15min TF overview
Entry at a discount within a 15m bullish leg
📈 Trade Breakdown – Buy-Side (GBP/USD)
📅 Date: Tuesday, April 15, 2025
⏰ Time: 5:00 AM (NY Time) – London Session AM
📉 Pair: GBP/USD
🧭 Direction: Long (Buy)
⏱️ Entry TF: 2-minute (LTF precision entry)
Trade Parameters:
Entry: 1.32335
Take Profit (TP): 1.33771 (+1.09%)
Stop Loss (SL): 1.32007 (–0.25%)
Risk-Reward Ratio (RR): 4.38
London AM continuation setup:
Built on a bullish structure shift post-Tokyo sweep for a buyside trade idea.

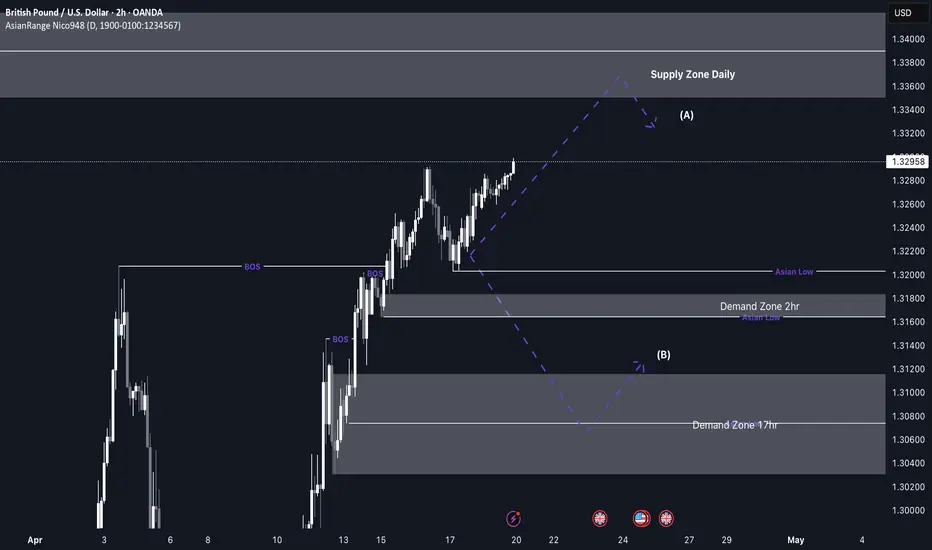
GBP/USD upcoming shorts from 1.33600 back down to demandMy focus this week for GU is around a key daily supply zone that price is currently approaching. As we near this level, I expect price to slow down and begin distributing, potentially leading to a deeper retracement. I anticipate the short setup to form around Tuesday, depending on how price reacts.
If price does retrace, I’ll be watching the 2-hour and 17-hour demand zones, where we could see a bullish reaction and a potential rally from those levels. Since GU has been overall bullish, this would be a counter-trend short, followed by a possible continuation to the upside.
Confluences for GBP/USD Shorts:
- Price is overbought, indicating a potential correction to clear liquidity and fill imbalances.
- Plenty of downside liquidity and imbalances that price could target.
- Approaching a strong daily supply zone, which could act as a key reversal point.
- Unmitigated demand zones below, which may need to be tapped before price continues higher.
P.S. If price doesn’t reach the daily supply zone, I’ll remain patient and look for a buy opportunity to ride price up toward that supply level.
Wishing everyone a great trading week ahead!
UPDATE ON GU TRADEGBP/USD 1H - Price has recently traded us lower to correct itself, pick up more Demand before taking a move higher. I have gone ahead and marked out the area in which price trade down and into.
With price breaking structure fractally on the 15M timeframes, we could look to add to our positions as this gives us enough confluence to suggest that price is now ready to continue with the higher timeframe bullish move.
This trade is currently running + 125 pips. (+ 5.4%) 5.4RR
A big well done to those of you who are still in on this trade, I have actually gone ahead and taken a full close on this but will continue to monitor the original position for those still in.
Those of you who are looking for another entry, as soon as I have something for you I will let you know, as I am also looking to get re-introduced. Any questions drop me a message or comment below!

GBPUSD - NEXT STOP @1.34343?1. MARKET OVERVIEW
GU has been on a very strong uptrend since January so i'm expecting that momentum to continue this week aiming for the old high @1.34343 which is also the Previous Year's High (PYH) and a Key Level.
2. KEY LEVELS I'M WATCHING
* Draw On Liquidity(DOL): 1.34343
* Point Of Interest(POI): 1.32411 - 1.32500
3. TRADE BIAS & SCENARIOS
I'll stick on being bullish for the rest of the week until price gets to my target which is the PYH(Previous Year High). I'll execute on my buys only if price trades to my POI before trading to my target, on the condition that price trades higher early in the week and gets to my target(without first trading to my POI) i'll cancel my trade order and switch neutral on my BIAS.
4. FINAL NOTE
Patience is key, i'll wait for price to come to me and not chase price.
Tell me what you guys think about this in the comment.

THOUGHTS ON THE GBP/USD MARKETGBP/USD 1H - Yes we are wanting to see weakness in the USD this week, however price may trade us lower initially to clear the orders fully before the move higher.
We have seen that price has broken structure fractally on the 30M timeframes, again this could be short lived and this could be just to clear the inefficient structure before taking us higher again, missing the zone we have marked out below.
This is why it is important that with every trade we place we wait for relevant confirmation before entering to avoid getting caught out. I will be waiting for price to trade us up and breaking structure fractally before I look to take the market short.
Even then it will only be an intraday/day trade, one that I will look to close by the end of week. I will keep you all posted with anything I do on this pair. SIT ON YOUR HANDS AND WAIT!

Bearish reversal off overlap resistance?The Cable (GBP/USD) is rising towards the pivot which is an overlap resistance and could reverse to the 1st support.
Pivot: 1.3417
1st Support: 1.3102
1st Resistance: 1.3637
Risk Warning:
Trading Forex and CFDs carries a high level of risk to your capital and you should only trade with money you can afford to lose. Trading Forex and CFDs may not be suitable for all investors, so please ensure that you fully understand the risks involved and seek independent advice if necessary.
Disclaimer:
The above opinions given constitute general market commentary, and do not constitute the opinion or advice of IC Markets or any form of personal or investment advice.
Any opinions, news, research, analyses, prices, other information, or links to third-party sites contained on this website are provided on an "as-is" basis, are intended only to be informative, is not an advice nor a recommendation, nor research, or a record of our trading prices, or an offer of, or solicitation for a transaction in any financial instrument and thus should not be treated as such. The information provided does not involve any specific investment objectives, financial situation and needs of any specific person who may receive it. Please be aware, that past performance is not a reliable indicator of future performance and/or results. Past Performance or Forward-looking scenarios based upon the reasonable beliefs of the third-party provider are not a guarantee of future performance. Actual results may differ materially from those anticipated in forward-looking or past performance statements. IC Markets makes no representation or warranty and assumes no liability as to the accuracy or completeness of the information provided, nor any loss arising from any investment based on a recommendation, forecast or any information supplied by any third-party.

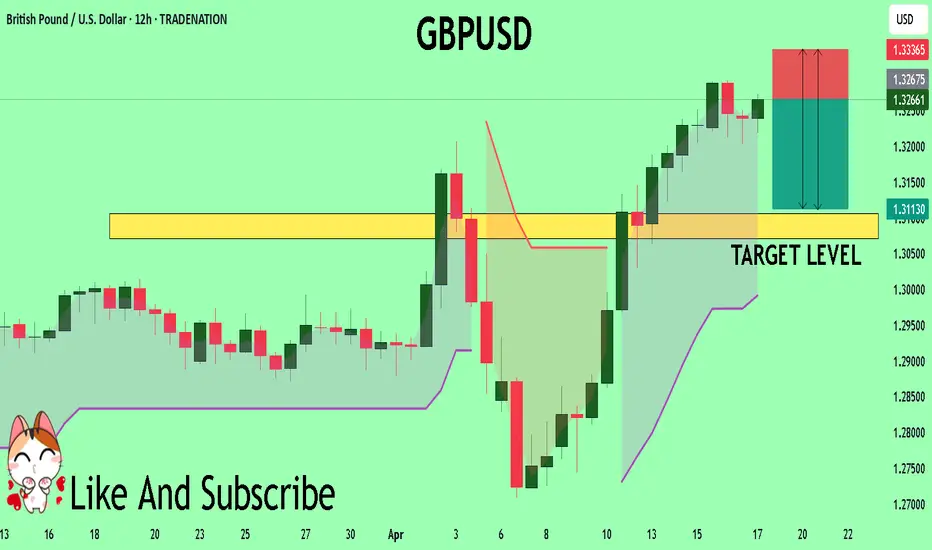
GBPUSDGBPUSD still showing some strength and needs more upside before any drop.
Disclosure: We are part of Trade Nation's Influencer program and receive a monthly fee for using their TradingView charts in our analysis.

GBPUSD 4HRSCentral Bank Heads and Policy Influence
Bank of England (BoE) – Governor Andrew Bailey
Policy Stance: Andrew Bailey has emphasized caution on rate cuts, noting that UK inflation pressures are falling only gradually. The BoE has kept its main rate at 4.5% and signaled that it needs more evidence before easing policy. However, market expectations are shifting, with investors now pricing in two rate cuts in 2024 and a 50/50 chance of a first cut as early as June or August.
Impact: The BoE’s cautious approach has supported GBP recently, but dovish signals and the likelihood of rate cuts later in 2025 are weighing on the pound’s medium-term outlook. Bailey’s leadership is seen as steady but data-dependent, and his upcoming role as Chair of the Financial Stability Board may enhance his international influence.
US Federal Reserve – Chair Jerome Powell
Policy Stance: Jerome Powell has reiterated the need for patience and caution before making any changes to US rates, stressing the importance of more clarity on economic and inflation trends. The Fed’s benchmark rate remains at 4.25%–4.50%, and Powell’s recent comments suggest the Fed is in no rush to cut, especially with inflation still above target and new uncertainties from US tariff policies.
Political Pressure: President Trump has publicly criticized Powell for not cutting rates and has threatened his removal, but Powell remains committed to his term and the Fed’s independence. This political tension adds uncertainty but, for now, the Fed’s stance remains steady and data-driven.
Impact: The Fed’s reluctance to cut rates supports the dollar, especially as the BoE moves closer to easing. This policy divergence is a key factor in the current and expected bias for GBP/USD.
Summary Table: Central Bank Influence on GBP/USD
Central Bank Head Current Stance Expected Policy Move Impact on GBP/USD Directional Bias
Andrew Bailey (BoE) Cautious, data-driven Rate cuts likely in 2024 Weighs on GBP medium-term, limits upside
Jerome Powell (Fed) Patient, hawkish-leaning Rate cuts delayed Supports USD, adds downside risk to GBP/USD
Conclusion
Near-term: GBP/USD retains a bullish bias above supplyroof , but the upside may be capped as markets anticipate BoE rate cuts while the Fed remains on hold.
Medium-term: Policy divergence—BoE turning dovish and Fed staying cautious—suggests a bearish tilt for GBP/USD as 2025 progresses, unless US economic data weakens sharply or the Fed pivots sooner than expected.
Central Bank Heads: The leadership and communication styles of Andrew Bailey and Jerome Powell are central to market expectations, with Bailey’s caution and Powell’s patience both shaping the pair’s directional bias.
#SHVAYFXHUB

I'm selling GBPUSDWithout long talks so you will see it on time, enter this trade, you wont regret it.
A correction is eminent

GBPUSD SHORT FORECAST Q2 W17 D22 Y25GBPUSD SHORT FORECAST Q2 W17 D22 Y25
SUMMARY
- Weekly order block
- Daily order block
- Price action bullish in current point of interest.
REQUIREMNTS
- Setup A) Substantial 15' break of structure, creating 15' order block to short from on the pull back.
- Setup C) Lower time frame break of structure without initial 15' break of structure.
- Candle stick formation confluences.
FRGNT X
IG - JCFRGNT

GBPUSD Short Ideia - Still expecting more from this trade.I still expect more drops from GU. I will post soon a second entry point suggestion for NY Session. Lets goooooo

GBPUSD Under Pressure! SELL!
My dear friends,
GBPUSD looks like it will make a good move, and here are the details:
The market is trading on 1.3266 pivot level.
Bias - Bearish
Technical Indicators: Supper Trend generates a clear short signal while Pivot Point HL is currently determining the overall Bearish trend of the market.
Goal - 1.3106
Recommended Stop Loss - 1.3336
About Used Indicators:
Pivot points are a great way to identify areas of support and resistance, but they work best when combined with other kinds of technical analysis
Disclosure: I am part of Trade Nation's Influencer program and receive a monthly fee for using their TradingView charts in my analysis.
———————————
WISH YOU ALL LUCK
GBPUSD(Chart Plan)You can follow us for more Analysis(Images and Videos) with Precise definition of the Financial Market.

GBP/USD M15 – Breakout AlertGBP/USD M15 – Breakout Alert
The GBP/USD pair on the 15-minute timeframe is showing a potential buying opportunity following the breakout of a consolidation pattern. This breakout indicates a possible shift in momentum to the upside, increasing the likelihood of continued bullish movement in the near term.
Trade Idea – Long Setup:
Entry: Consider entering around the trendline zone of the breakout pattern (approx. 1.32200–1.32300).
Target 1: 1.33214
Target 2: 1.33600
Stop Loss: Below recent structure low or Ichimoku cloud support.
This setup is backed by momentum indicators and breakout structure. Keep an eye on volume and price action near the entry zone for confirmation.
If you find this analysis helpful, please hit the like button and drop a comment to support!
Your engagement motivates me to keep sharing more setups and insights.
Best regards,
JAMES_GOLD_MASTER_MQL5

Short term retracement on GBPUSD before continuing the uptrendGBPUSD has been flying for a while now due to dollar weakening.
From my analysis it looks like it is currently making a short term retracement to fill some imbalances before continuing to the upside again.

GBPUSD BEARISH FOR 90PIPSGBP/USD Bearish 90-Pip Forecast: Analysis & Strategy
Current Market Context:
As of the latest data, GBP/USD is trading around 1.3800. A 90-pip bearish target would place the pair near 1.3710. Below is the rationale and actionable plan:
Key Drivers for a Bearish Outlook
Fundamental Factors:
UK Weakness: Dovish Bank of England (BoE) rhetoric, soft UK GDP/CPI data, or rising unemployment could weaken the Pound.
USD Strength: Hawkish Fed signals (e.g., rate hike talks, tapering) or strong U.S. jobs/inflation data may boost the dollar.
Geopolitical Risks: Brexit uncertainties, UK-EU trade tensions, or global risk-off sentiment favoring the USD.
Technical Analysis:
Resistance Levels: Failure to break above 1.3850 (a key resistance) or bearish patterns (e.g., double top, descending channel).
Momentum Indicators: RSI divergence or MACD crossover signaling bearish momentum.
Moving Averages: Price below the 50/200-day EMA, suggesting a downtrend.
Trade Strategy
Entry Zone: 1.3800–1.3830 (post-retest of resistance).
Target: 1.3710 (90 pips).
Stop-Loss: 1.3870 (above recent swing high).
Risk Management:
Use 1:2 risk-reward ratio (e.g., risk 30 pips to gain 90 pips).
Adjust position size to limit exposure (e.g., 1–2% of account capital).
Critical Events to Monitor
UK Data: BoE interest rate decisions, CPI (July 19), Retail Sales.
U.S. Data: Fed meetings, Non-Farm Payrolls (August 4), CPI.
Global Catalysts: Brexit updates, geopolitical tensions.
Contingency Plan
Upside Risk: A BoE rate hike surprise or weak U.S. data could reverse the trend. Tighten stops if price breaks above 1.3870.
Alternative Scenario: If the drop stalls near 1.3750 (support), secure partial profits and trail stops.

Bearish reversal off overlap resistance?GBP?USD is rising towards the resistance level which is an overlap resistance that lines up with the 61.6% Fibonacci projection and the 127.2% Fibonacci extension and could reverse from this level to our take profit.
Entry: 1.3376
Why we like it:
There is an overlap resistance level that lines up with the 127.2% Fibonacci extension and the 61.8% Fibonacci projection.
Stop loss: 1.3646
Why we like it:
There is a pullback resistance level that is slightly above the 78.6% Fibonacci projection.
Tale profit: 1.3105
Why we like it:
There is a pullback support level.
Enjoying your TradingView experience? Review us!
Please be advised that the information presented on TradingView is provided to Vantage (‘Vantage Global Limited’, ‘we’) by a third-party provider (‘Everest Fortune Group’). Please be reminded that you are solely responsible for the trading decisions on your account. There is a very high degree of risk involved in trading. Any information and/or content is intended entirely for research, educational and informational purposes only and does not constitute investment or consultation advice or investment strategy. The information is not tailored to the investment needs of any specific person and therefore does not involve a consideration of any of the investment objectives, financial situation or needs of any viewer that may receive it. Kindly also note that past performance is not a reliable indicator of future results. Actual results may differ materially from those anticipated in forward-looking or past performance statements. We assume no liability as to the accuracy or completeness of any of the information and/or content provided herein and the Company cannot be held responsible for any omission, mistake nor for any loss or damage including without limitation to any loss of profit which may arise from reliance on any information supplied by Everest Fortune Group.

GBP-USD Short From Resistance! Sell!
Hello,Traders!
GBP-USD went up sharply
Made a retest of the
Horizontal resistance level
Of 1.3432 from where we
Are already seeing a local
Bearish reaction so we
Are locally bearish biased
And we will be expecting
A local bearish correction
Sell!
Comment and subscribe to help us grow!
Check out other forecasts below too!
Disclosure: I am part of Trade Nation's Influencer program and receive a monthly fee for using their TradingView charts in my analysis.

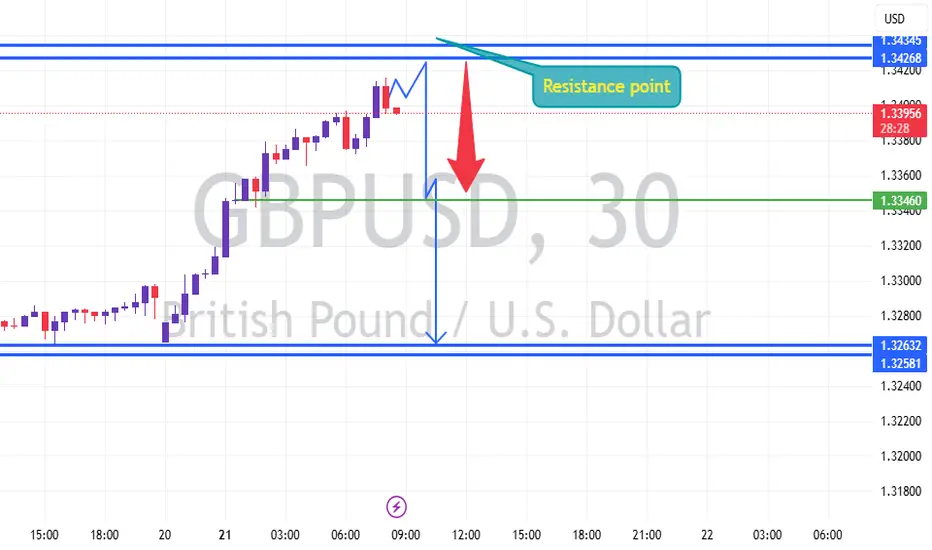
.GBPUSD (M30) ANALYSIS UPDATES
** GBP/USD – 30-Minute Chart**
The GBP/USD pair is currently facing a strong **resistance zone** near the 1.34268 – 1.34345 levels, as marked on the chart. The price has recently rallied but is now showing signs of hesitation below this resistance point.
**Key Observations:**
- The pair is approaching a **resistance level**, suggesting a potential reversal or pullback.
- A **bearish move** is anticipated from this resistance, with a target towards the **1.33460 support** and potentially extending to the **1.32632 – 1.32581 zone**.
- The red arrow indicates the expected downward momentum if the price fails to break above the resistance.
**Trading Strategy:**
- **Sell Zone:** Near 1.34200–1.34345
- **First Target:** 1.33460 (green line)
- **Second Target:** 1.32632
- **Stop Loss:** Above 1.34450 (to stay protected in case of a breakout)
**Note:** Watch for bearish confirmation signals like rejection candles or divergence before entering the trade.
Price will arrive POI soon Volume, Liquidity, and Reaction – Price Mechanism
Volume is a way to observe the raw price activity in the market. It is the first thing to look out for before searching for money or liquidity.
For example, if I want to sell or buy something, I would rather go to a place where there are plenty of people who can potentially buy it, or to a place where the item is sold in bulk. That’s volume.
Liquidity: Topic for another day.
Reaction: refers to how the price behaves around your levels. Is the price reacting to your level?

GBPUSD H4 | Bullish Bounce Off 23.6% FiboBased on the H4 chart analysis, the price is approaching our buy entry level at 1.3163, a pullback support that aligns with the 23.6% Fibonacci retracement.
Our take profit is set at 1.3348, aligning with the 127.2% Fibo extension
The stop loss is placed at 1.3015, a pullback support that aligns close to the 38.2% Fibonacci retracement.
High Risk Investment Warning
Trading Forex/CFDs on margin carries a high level of risk and may not be suitable for all investors. Leverage can work against you.
Stratos Markets Limited (tradu.com):
CFDs are complex instruments and come with a high risk of losing money rapidly due to leverage. 63% of retail investor accounts lose money when trading CFDs with this provider. You should consider whether you understand how CFDs work and whether you can afford to take the high risk of losing your money.
Stratos Europe Ltd (tradu.com):
CFDs are complex instruments and come with a high risk of losing money rapidly due to leverage. 63% of retail investor accounts lose money when trading CFDs with this provider. You should consider whether you understand how CFDs work and whether you can afford to take the high risk of losing your money.
Stratos Global LLC (tradu.com):
Losses can exceed deposits.
Please be advised that the information presented on TradingView is provided to Tradu (‘Company’, ‘we’) by a third-party provider (‘TFA Global Pte Ltd’). Please be reminded that you are solely responsible for the trading decisions on your account. There is a very high degree of risk involved in trading. Any information and/or content is intended entirely for research, educational and informational purposes only and does not constitute investment or consultation advice or investment strategy. The information is not tailored to the investment needs of any specific person and therefore does not involve a consideration of any of the investment objectives, financial situation or needs of any viewer that may receive it. Kindly also note that past performance is not a reliable indicator of future results. Actual results may differ materially from those anticipated in forward-looking or past performance statements. We assume no liability as to the accuracy or completeness of any of the information and/or content provided herein and the Company cannot be held responsible for any omission, mistake nor for any loss or damage including without limitation to any loss of profit which may arise from reliance on any information supplied by TFA Global Pte Ltd.
The speaker(s) is neither an employee, agent nor representative of Tradu and is therefore acting independently. The opinions given are their own, constitute general market commentary, and do not constitute the opinion or advice of Tradu or any form of personal or investment advice. Tradu neither endorses nor guarantees offerings of third-party speakers, nor is Tradu responsible for the content, veracity or opinions of third-party speakers, presenters or participants.

GBPUSD💡Chart analysis of the GBP/USD currency pair (daily timeframe). Ascending Channel The price is moving within a clear ascending channel. This reflects a recent upward trend. The upper boundary of the channel represents resistance, and the lower boundary represents support.
Supply Zone Illustrated in red above the chart. This is an area that has previously experienced strong selling pressure, and the price is expected to encounter resistance there. The price is currently in this area, which could indicate a potential reversal. MACD Indicator There is no current indication of a clear reversal or weakening trend. However, since the price has reached a strong supply zone, the indicator may slow down or signal a reversal soon.
⛔️Not investment advice. For educational purposes only.
