WHY GBPUSD BULLISH ?? DETAILED TECHNICAL AND FUNDAMENTALSThe GBP/USD currency pair is currently trading around 1.2950, exhibiting a bullish pennant pattern—a continuation signal that often precedes further upward movement. This pattern forms after a strong price surge, followed by a consolidation phase marked by converging trendlines. A breakout above the pennant's upper boundary could propel the pair toward the target price of 1.3100, indicating a potential gain of 150 pips.
Fundamentally, the British pound has demonstrated resilience, bolstered by the UK's robust economic performance and the Bank of England's measured approach to interest rate adjustments. Recent data indicates that the UK economy has maintained steady growth, with inflation rates aligning closely with the central bank's targets. Conversely, the US dollar has experienced fluctuations due to mixed economic indicators and evolving monetary policy expectations from the Federal Reserve. These dynamics contribute to the supportive environment for the pound against the dollar.
Technical analysis reinforces the bullish outlook for GBP/USD. The pair has been trading above key moving averages, with oscillators indicating strong upward momentum. The formation of the bullish pennant suggests a continuation of the prevailing uptrend. Key resistance levels to monitor include 1.3000 and 1.3040, with a sustained break above these points potentially paving the way toward the 1.3100 target. Additionally, the Relative Strength Index (RSI) remains in bullish territory, suggesting that the current uptrend has room to continue.
Traders should monitor key resistance levels closely, as a confirmed breakout could present a lucrative opportunity to capitalize on the anticipated movement. Implementing robust risk management strategies, such as setting appropriate stop-loss orders, is essential to navigate potential market volatility. Staying informed about upcoming economic data releases and central bank communications will also be crucial in effectively capitalizing on this trading opportunity.
GBPUSD.1.MINI trade ideas

GBPUSD is still bullish. nothing has changed!I'm buying for 2 reasons...
DXY is bearish and making lower lows.
EURGBP is still bearish.
TP1 at 1.3015
My only hesitation to this trade is, that PDL wasnt swept, j will update you guys if price comes there

GbpUsd analiz Dear ones, let's first spread our Thoughts by the Pound, as there is excellent potential here for the average. I immediately marked the Area where I'm going to make Purchases and the Potential itself, everything is on the screen.


GBPUSD Be bullishWhen the GBPUSD pair executes a definitive breach of the 1.30000 resistance ceiling — a level of both psychological and technical significance — it is poised to precipitate a substantial influx of bullish sentiment. This event not only satisfies key technical prerequisites for an upward price trajectory but also catalyzes a profound shift in market sentiment.
Consequentially, diverse market participants, ranging from institutional hedge funds to high - volume forex dealers and astute retail investors, will be drawn to the market, precipitating a marked upswing in trading volumes. The resultant robust buying momentum is forecast to drive the formation of a pronounced uptrend, propelling the pair to appreciably higher price levels.
From a forward - looking perspective, resistance levels at 1.31400 and 1.32100 are likely demarcated by prior price action, Fibonacci retracement ratios, or psychologically significant thresholds. As the pair gravitates towards these levels, short - term traders who previously established short positions at higher price points will likely execute mass short - covering, inundating the market with selling pressure.
Simultaneously, long - term bulls seeking to realize profits will contribute to the selling pressure, further exacerbating the downward - leaning market dynamics. These converging forces may well impede the pair’s upward progression and potentially instigate a short - term price correction.
Should the GBPUSD pair fail to surmount the 1.30000 resistance hurdle and commence a retracement, the 1.28800 level — identified as a zone of prior price congestion or corroborated by key technical indicators — is anticipated to attract value - seeking buyers. The influx of buying interest at this level may effectively arrest the downward momentum.
Deeper into the price spectrum, the 1.27000 level, which aligns with major moving averages or critical trendlines, functions as a pivotal line of defense. Given its status as a widely recognized strong support zone, a substantial influx of buying pressure is likely to materialize as the price approaches this level, thereby forestalling a more significant price decline and fostering market stability.
💎💎💎 GBPUSD 💎💎💎
🎁 Buy@1.28800 - 1.29000
🎁 TP 1.30000 - 1.31400
The market has been extremely volatile lately. If you can't figure out the market's direction, you'll only be a cash dispenser for others. If you also want to succeed,Follow the link below to get my daily strategy updates

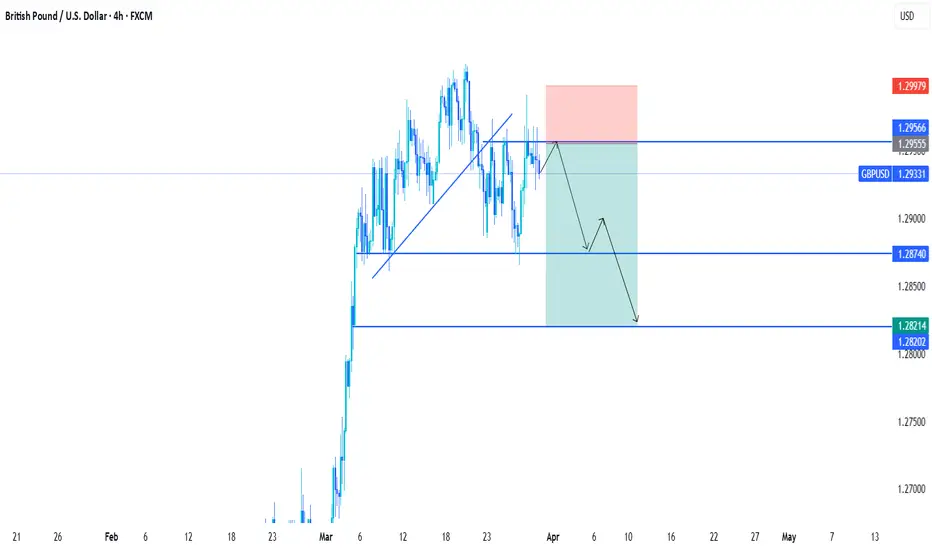
GBP/USD Breakdown: Bearish Setup with Sell Opportunity!"Key Observations:
Rising Wedge Breakdown:
The price initially formed a rising wedge near resistance.
The wedge broke down, indicating bearish momentum.
Support and Resistance Levels:
Resistance Zone: Around 1.3014 – 1.3027, marking a strong rejection area.
Support Zone: Around 1.2933 – 1.2843, where price previously bounced.
Strong Support: Around 1.2627, marked as the target area for a bearish move.
Bearish Setup:
A range-bound consolidation occurred after the breakdown.
The chart marks a sell signal, suggesting a move toward the 1.2627 target zone.
Trading Idea:
Entry: Sell after confirmation below 1.2933.
Target: 1.2627 (major support level).
Stop-Loss: Above 1.3014 (resistance level).
This setup suggests a potential bearish continuation, with price expected to decline further if support breaks. Always confirm with volume and market conditions before entering a trade.

GBPUSD (CABLE)GBPUSD is still not done with correction in our opinion. Until market breaks 1.285 its not done with correction.
Disclosure: We are part of Trade Nation's Influencer program and receive a monthly fee for using their TradingView charts in our analysis.

GBPUSD TRADE SETUPWait for retest the entry level then take a trade for Sell otherwise skip this setup
My idea on GU I'm looking at GU to give me a CHOCH on the 1H as we have seen price respected the 4H demand.
In summary: A buy before a sell but if price breaks the 4H low then we will be looking for shorts to the 1D demand to take price higher.

GBPUSD A strong support pullback each time it falls hereGBPUSD is forming a strong bullish support and the price likely will go up again.

GBP/USD Longs from 1.28900 back up to 1.30000I’m looking for long opportunities around the 5-hour demand zone, aiming to take price back up to the 6-hour supply zone, where I will then look for potential sell setups.
Since price is currently positioned between these key levels, I will wait to see where it starts to slow down and how it reacts. Ideally, I want to see accumulation in the demand zone and distribution in the supply zone before making any decisions. However, overall, my bias for GU remains bullish, especially as the U.S. dollar continues to weaken.
Confluences for GU Buys:
- A clear 5-hour demand zone presents a potential buying opportunity.
- Liquidity remains to the upside, which price may target before a reversal.
- DXY has shifted bearish, indicating a potential bullish move for GBP/USD.
- Price has been consistently bullish on the higher timeframe over the past few weeks.
Note: If price breaks below the nearby demand zone, I will expect a temporary bearish trend to form.

#GBPUSD: Risk Entry Vs Safe Entry, Which One Would You Chose? The GBPUSD currency pair presents two promising opportunities for entry, potentially generating gains exceeding 500 pips. However, entering these markets carries a substantial risk of stop-loss hunting during the commencement of the week. Conversely, adopting a safe entry strategy offers a favourable chance for a bullish position.
We encourage you to share your thoughts and feedback on our ideas. ❤️🚀
Team Setupsfx_

GBPUSD:The strategy for next week remains bullishOn Friday, the GBP/USD traded and stopped at 1.2943, hovering near the upper end of the recent trading range. The currency pair has regained the ground above the 50-day Exponential Moving Average (EMA) at 1.2933, and currently, this level serves as an intraday support level, while the 200-day EMA at 1.2896 continues to underpin the broader momentum. The price movement is approaching the resistance zone of 1.2973 to 1.3008, which has restricted multiple rebound attempts this month. Breaking through this level may reach 1.3014. On the downside, the pivot point at 1.2937 and 1.2903 remain key levels worthy of attention. The short-term structure is constructive, but the bulls need a clear breakout to confirm the continuation of the trend beyond the resistance of the downward trend line.
Trading strategy:
buy@1.2910
TP:1.2970-1.2990
Get daily trading signals that ensure continuous profits! With an astonishing 90% accuracy rate, I'm the record - holder of an 800% monthly return. Click the link below the article to obtain accurate signals now!

GBPUSD Dusting 350+ PIPS in Choppy Waters - Breakout is Brewing?Technical / Chart Analysis:
Double Top Formation: The chart clearly exhibits a potential double top pattern around the 1.30564 resistance level. This is a bearish reversal pattern that suggests a potential trend change from bullish to bearish.
Breakdown of Uptrend: The preceding price action shows an uptrend, which has now been halted by the double top.
Key Support Level: The most crucial level to watch is the support around 1.28642. A confirmed break below this level would validate the double top pattern and signal a potential strong move downwards.
Monthly Performance: January saw a +180 pip move, followed by February with a +230 pip gain. This demonstrates the potential for significant profits in GBPUSD through swing trading.
Swing Analysis: February's +230 pip move consisted of 3 upward swings and 2 downward swings, highlighting the importance of capturing both upward and downward momentum in this pair due to the Choppy Price Action.
Conclusion:
FX:GBPUSD is at a critical juncture. The potential double top formation suggests a bearish bias, but confirmation is needed. Traders should closely monitor the key support level at 1.28642 for a potential breakdown and look for LONG Trades on breaking key levels to the Upside
What are your thoughts on GBPUSD's potential for swing trading? Do you see a breakdown or a bounce? Share your analysis and comments below!

GBPUSD Bearish ScenarioThere is a divergence in price and RSI. A market structure occurred and price returned to optimal trading entry (OTE) zone. Price broke down moving averages (MA) and retested them, and MA turned downtrend. Possible targets are shown in chart.

sell-buy-Great Sell!Hello all. market needs at least a new historical low. lets see what happen. do you agree? leave a comment of ur idea (wink)


GBPUSD | APRIL 2025 FORECAST | Chopping Block is Hot!GBP/USD is approaching the psychological 1.3000 level, a key battleground for bulls and bears. The pair has been trading within a rising channel, but recent price action suggests momentum could be shifting.
🔹 Trend & Structure: GBP/USD remains in a broader uptrend but is struggling to maintain bullish momentum above 1.3000. A confirmed break could signal continuation, while rejection may trigger a retracement toward 1.2800-1.2750.
🔹 Technical Outlook:
Support Levels: 1.2850, 1.2750
Resistance Levels: 1.3050, 1.3150
Indicators: RSI hovers near 65, signaling slight overextension; MACD shows bullish momentum but weakening.
🔹 Fundamental Factors:
BOE policy expectations vs. Fed’s stance on rate cuts.
US & UK economic data—watch CPI and employment figures.
If GBP/USD clears and holds above 1.3000, it could open doors for a rally toward 1.3150. But if sellers defend this level, we might see a pullback toward 1.2850-1.2750 before the next move.
Will 1.3000 hold, or is a reversal on the horizon? Drop your predictions below! 📉📈 #GBPUSD #ForexTrading #MarketAnalysis

GBPUSD - Short - Negative Divergence with MACDA retracement back its upward trendline is probable with MACD bearish divergence. Price currently consolidating below the major resistance level of 1.3000.
Target Price: 1.2800

GBPUSD: Channel Up still intact but keep an eye on the 4H MA200.GBPUSD is bullish on its 1D technical outlook (RSI = 59.951, MACD = 0.008, ADX = 32.444) as the dominant pattern remains a Channel Up and despite the consolidation in recent days, the market remains supported over the 4H MA200. If it crosses over the LH trendline, go long in a similar manner as the Feb 13th break out and aim for the 2.382 Fibonacci extension (TP = 1.3200). If on the other hand the price fails and crosses under the 4H MA200, go short and aim for the S1 level (TP = 1.2555).
## If you like our free content follow our profile to get more daily ideas. ##
## Comments and likes are greatly appreciated. ##


GBPUSD - Easy SellInflation is hot in the United States, dollar will strengthen. UK likely to weaken in the days ahead... Now's the time to sell. Trust me...
