GBPUSD BUY SETUPEU and GU had an SMT this morning and i'm concentrating on GU cos the setup looks cleaner over there.
let fvcking gooo!!!
GBPUSD.1.MINI trade ideas

GBPUSD FLYING MOVES*GBP/USD: Buy Opportunity Ahead?*
A potential buying opportunity has been identified in the GBP/USD pair, with a key support level in focus.
*Trade Details:*
- *Buy Entry:* 1.29490
- *Target Levels:*
- TP1: 1.30111
- TP2: 1.31220
- TP3: 1.32604
- TP4: 1.34230
- *Stop-Loss:* 1.28600
*Why Buy?*
1. *Support Zone:* The GBP/USD pair has reached a strong support zone, increasing the likelihood of a bounce.
2. *Bullish Momentum:* Technical indicators are showing bullish signals, hinting at a potential upswing.
3. *Sterling Strength:* A resurgent British Pound, driven by positive economic data and Brexit developments, may propel the GBP/USD pair higher.
*Market Outlook:*
The GBP/USD pair is experiencing a consolidation phase, with market participants awaiting key economic data releases and Brexit updates. A break above the 1.30111 resistance level could trigger a sharp rally.
*Trading Strategy:*
Buy GBP/USD at 1.29490, with a stop-loss at 1.28600. Use the target levels to take profits or adjust the stop-loss to break even.
*Was this helpful?*
If this trade idea and analysis helped you, please:
- *Like* this post to show your appreciation
- *Share* your opinions and feedback in the comments below
- *Follow* for more trade ideas and market analysis
Your feedback is invaluable, and I look forward to hearing from you!
Share your ideas and opinions to Travis

GBP/USD Intraday Short: Targeting a Reversal from 1.2955Intraday Idea - We look to GBPUSD Sell at 1.2955
Technical View
Although the bulls are in control, the stalling positive momentum indicates a turnaround is possible
Price action looks to be forming a top
A lower correction is expected
Preferred trade is to sell into rallies
Bespoke resistance is located at 1.2955
Stop: 1.2975
Target: 1.2875
Disclosure: I am part of Trade Nation's Influencer program and receive a monthly fee for using their TradingView charts in my analysis.

GBPUSD Rising Wedge BreakoutGBPUSD Broke the Rising Wedge, then the Support line and keeps falling. Looking at a potential SELL towards 1.2923-1.2888 area

GBPUSDPotential Trade Setup:
The chart includes a potential trade setup with an entry at 1.29140, a stop-loss at 1.28900, and a take-profit at 1.29945.
This setup suggests a potential long (buy) position, anticipating a price rise.
There are labels of FVG, and IVG on the chart. These refer to Fair Value Gaps and Inverted Value Gaps. These are used in Smart Money Concepts to identify areas where price is likely to react.
The setup has a risk/reward that looks to be greater than 1:2 which is a good ratio.
Price Levels:
The chart highlights several key price levels: 1.29140, 1.29385, 1.29500, 1.29945, and 1.30200.
These levels likely represent areas of support and resistance.
There are also levels at 1.28900 and 1.28600.

GBPUSD: Buy ideaOn GBPUSD we would have a very high probability of having an upward trend with this buy candle.

GBP/USD Analysis: Pair Fails to Hold Above Psychological LevelGBP/USD Analysis: Pair Fails to Hold Above Psychological Level
As shown in today’s GBP/USD chart, the pair failed to maintain its position above the psychological level of 1.3000 USD per pound, where it had reached its highest point since early 2025. The decline followed recent central bank decisions and statements, with both the Bank of England and the Federal Reserve keeping interest rates unchanged.
On one side, the Bank of England:
→ Warned of inflation risks, partly driven by external factors such as US trade tariffs.
→ Indicated a potential rate cut in the coming months.
On the other hand, the US dollar strengthened on Thursday after the Federal Reserve signalled reluctance to rush further rate cuts this year, despite uncertainties surrounding US tariffs.
These statements highlighted the challenges market participants face in assessing the risks posed by tariffs on global trade.
Technical Analysis of GBP/USD
In March, the pound followed an upward trend against the US dollar, forming an ascending channel (marked in blue). However, once the price moved above the key 1.3000 level, the upper boundary of the channel appeared out of reach—possibly signalling weakening buying momentum.
As a result, the price broke below the lower boundary of the channel, which has now shown signs of resistance (indicated by an arrow). If bearish pressure persists, the price could fall towards the dotted trendline below the channel, at a distance equal to its height. Additionally, a test of the previous local low around 1.2911 cannot be ruled out.
This article represents the opinion of the Companies operating under the FXOpen brand only. It is not to be construed as an offer, solicitation, or recommendation with respect to products and services provided by the Companies operating under the FXOpen brand, nor is it to be considered financial advice.
GBP Retreats as BoE Maintains PolicyThe pound dipped below $1.30, retreating from a four-month high after the BoE held rates at 4.5% and signaled a cautious approach to easing policy, despite recent inflation progress.
Global trade tensions added pressure, with new U.S. tariffs prompting retaliatory moves and raising inflation risks.
UK data showed weak growth, steady 4.4% unemployment, and wage growth easing to 5.8%, in line with forecasts. In the U.S., the Fed kept rates steady but reaffirmed plans for two cuts this year.
If GBP/USD breaks above 1.3050, the next resistance levels are 1.3100 and 1.3150. On the downside, support stands at 1.2860, with further levels at 1.2800 and 1.2715 if selling pressure increases.

GBPUSD Short/Sell IdeaGBPUSD appears to have turned around after a few weeks of trending in a very bullish manner.
I believe it drops for a retracement to pickup orders at support.

#GBPUSD #IDEA On Today i found GU look like it will fly up to my Analysis So we will wait for some confirm at small time frame like M3 For Buy confirm

GBPUSD Will Go Up! Buy!
Here is our detailed technical review for GBPUSD.
Time Frame: 2h
Current Trend: Bullish
Sentiment: Oversold (based on 7-period RSI)
Forecast: Bullish
The market is trading around a solid horizontal structure 1.293.
The above observations make me that the market will inevitably achieve 1.297 level.
P.S
We determine oversold/overbought condition with RSI indicator.
When it drops below 30 - the market is considered to be oversold.
When it bounces above 70 - the market is considered to be overbought.
Disclosure: I am part of Trade Nation's Influencer program and receive a monthly fee for using their TradingView charts in my analysis.
Like and subscribe and comment my ideas if you enjoy them!

Mister Y - GU - Friday - 21/03/25 Top down analysisAnalysis done directly on the chart
Not everyday is a good trading day, learning
when to step back is also a very clever move
from traders.
If you have any questions, leave it down in the comments
I'll try my best to answer them
Not financial advice, DYOR.
Market Flow Strategy
Mister Y

GBPUSD SELLJust a quick trade—I'll update afterward. Follow for simple and effective trades faster!
1RR

correctionIt is expected that the downward trend will continue to form until the specified support area. Then the continuation of the movement will proceed according to the specified paths.
It is expected that within the specified time frame, the downward trend will end and the beginning of the upward trend will form.

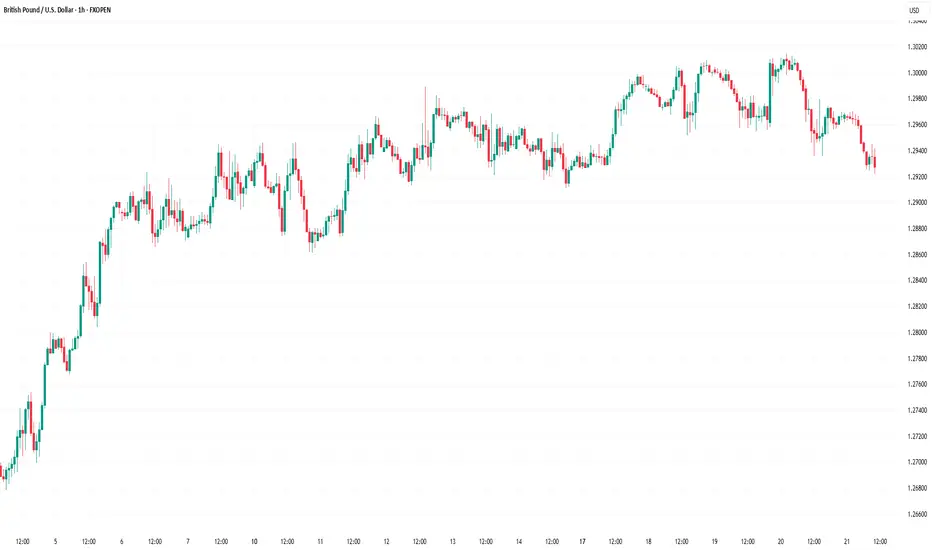
GBP/USD ANALYSIS ON D1(TF) • The chart shows the GBP/USD price action from early 2024 to March 2025.
• The price experienced a significant uptrend from around May 2024 (near 1.26000) to a peak in September 2024 (around 1.32000).
• After hitting this peak, the price entered a consolidation phase, followed by a downtrend starting in late 2024, bringing it to the current level of 1.29634.
• The recent price action shows a decline, as indicated by the 0.30% drop.
2. Key Levels (Support and Resistance)
• Resistance Zone: The chart highlights a resistance zone between approximately 1.29634 and 1.30655 (shaded in green). This zone acted as a ceiling for the price in late 2024 and early 2025, where the price struggled to break through and reversed downward.
• Support Zone: A support zone is marked around 1.22829 (shaded in red). This level appears to be a historical low from early 2024, suggesting it could act as a strong support if the price continues to decline.
• The price is currently near the lower boundary of the resistance zone (1.29634), which may now act as support after being tested as resistance previously.
3. Projected Price Range (Right Side)
• The chart includes a projected price range for the future, shown on the right side in USD values:
• Upper Bound: 1.30655 (top of the resistance zone)
• Lower Bound: 1.22829 (support level)
• Current Price in Range: 1.29634, which is closer to the lower end of the resistance zone.
• This range suggests that the price could either bounce back toward the upper resistance at 1.30655 or continue its decline toward the support at 1.22829.
4. Volume and Volatility
• The chart does not explicitly show volume, but the candlestick patterns indicate periods of higher volatility (larger candles) during the uptrend and downtrend phases, with smaller candles during consolidation.
• The recent price action shows smaller candles, suggesting a potential decrease in momentum or indecision in the market.
5. Potential Scenarios
• Bullish Scenario: If the price holds above the current level of 1.29634 (which aligns with the lower boundary of the resistance zone), it could act as support, and the price might attempt to retest the upper resistance at 1.30655. A breakout above this level could signal a continuation of the longer-term uptrend.
• Bearish Scenario: If the price fails to hold 1.29634 and breaks below this level, it could signal further downside. The next significant support is at 1.22829, a substantial drop from the current price. Intermediate support levels (e.g., around 1.26000, based on previous price action) might provide temporary pauses in the decline.
• Consolidation: The price might also consolidate between 1.29634 and 1.30655 for a while if market participants remain indecisive, especially given the recent lack of strong momentum.

GBP/USD DAY1 analysis • The chart shows the GBP/USD price action from early 2024 to March 2025.
• The price experienced a significant uptrend from around May 2024 (near 1.26000) to a peak in September 2024 (around 1.32000).
• After hitting this peak, the price entered a consolidation phase, followed by a downtrend starting in late 2024, bringing it to the current level of 1.29634.
• The recent price action shows a decline, as indicated by the 0.30% drop.
2. Key Levels (Support and Resistance)
• Resistance Zone: The chart highlights a resistance zone between approximately 1.29634 and 1.30655 (shaded in green). This zone acted as a ceiling for the price in late 2024 and early 2025, where the price struggled to break through and reversed downward.
• Support Zone: A support zone is marked around 1.22829 (shaded in red). This level appears to be a historical low from early 2024, suggesting it could act as a strong support if the price continues to decline.
• The price is currently near the lower boundary of the resistance zone (1.29634), which may now act as support after being tested as resistance previously.
3. Projected Price Range (Right Side)
• The chart includes a projected price range for the future, shown on the right side in USD values:
• Upper Bound: 1.30655 (top of the resistance zone)
• Lower Bound: 1.22829 (support level)
• Current Price in Range: 1.29634, which is closer to the lower end of the resistance zone.
• This range suggests that the price could either bounce back toward the upper resistance at 1.30655 or continue its decline toward the support at 1.22829.
4. Volume and Volatility
• The chart does not explicitly show volume, but the candlestick patterns indicate periods of higher volatility (larger candles) during the uptrend and downtrend phases, with smaller candles during consolidation.
• The recent price action shows smaller candles, suggesting a potential decrease in momentum or indecision in the market.
5. Potential Scenarios
• Bullish Scenario: If the price holds above the current level of 1.29634 (which aligns with the lower boundary of the resistance zone), it could act as support, and the price might attempt to retest the upper resistance at 1.30655. A breakout above this level could signal a continuation of the longer-term uptrend.
• Bearish Scenario: If the price fails to hold 1.29634 and breaks below this level, it could signal further downside. The next significant support is at 1.22829, a substantial drop from the current price. Intermediate support levels (e.g., around 1.26000, based on previous price action) might provide temporary pauses in the decline.
• Consolidation: The price might also consolidate between 1.29634 and 1.30655 for a while if market participants remain indecisive, especially given the recent lack of strong momentum.

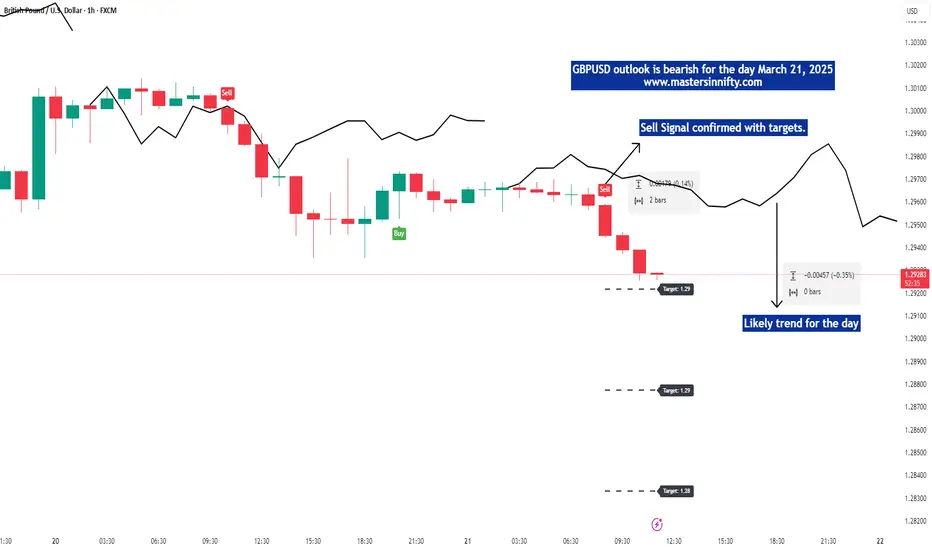
GBPUSD view for the day March 21, 2025According to my analysis the trend for GBPUSD looks bearish. Bearish targets are given for the day. Trade with Stop loss.

GBPUSD Selling Opportunities SpottedWe are basically anticipating for more selling momentum as price formed a wedge at a resistance level. Also, lower timeframe price action shows more bearish activities.

Potential bearish drop?The Cable (GBP/USD) has reacted off the pivot which is a pullback resistance and could drop to the 1st support which has been identified as a pullback support.
Pivot: 1.2963
1st Support: 1.3870
1st Resistance: 1.3007
Risk Warning:
Trading Forex and CFDs carries a high level of risk to your capital and you should only trade with money you can afford to lose. Trading Forex and CFDs may not be suitable for all investors, so please ensure that you fully understand the risks involved and seek independent advice if necessary.
Disclaimer:
The above opinions given constitute general market commentary, and do not constitute the opinion or advice of IC Markets or any form of personal or investment advice.
Any opinions, news, research, analyses, prices, other information, or links to third-party sites contained on this website are provided on an "as-is" basis, are intended only to be informative, is not an advice nor a recommendation, nor research, or a record of our trading prices, or an offer of, or solicitation for a transaction in any financial instrument and thus should not be treated as such. The information provided does not involve any specific investment objectives, financial situation and needs of any specific person who may receive it. Please be aware, that past performance is not a reliable indicator of future performance and/or results. Past Performance or Forward-looking scenarios based upon the reasonable beliefs of the third-party provider are not a guarantee of future performance. Actual results may differ materially from those anticipated in forward-looking or past performance statements. IC Markets makes no representation or warranty and assumes no liability as to the accuracy or completeness of the information provided, nor any loss arising from any investment based on a recommendation, forecast or any information supplied by any third-party.

GBPUSD H4 | Bearish ContinuationBased on the H4 chart, the price may make a bearish reversal off our sell entry level at 1.2976, an overlap resistance.
Our take profit is set at 1.2933, a swing low support.
The stop loss is set at 1.3013, a swing high resistance.
High Risk Investment Warning
Trading Forex/CFDs on margin carries a high level of risk and may not be suitable for all investors. Leverage can work against you.
Stratos Markets Limited (fxcm.com/uk):
CFDs are complex instruments and come with a high risk of losing money rapidly due to leverage. 63% of retail investor accounts lose money when trading CFDs with this provider. You should consider whether you understand how CFDs work and whether you can afford to take the high risk of losing your money.
Stratos Europe Ltd (fxcm.com/eu):
CFDs are complex instruments and come with a high risk of losing money rapidly due to leverage. 63% of retail investor accounts lose money when trading CFDs with this provider. You should consider whether you understand how CFDs work and whether you can afford to take the high risk of losing your money.
Stratos Trading Pty. Limited (fxcm.com/au):
Trading FX/CFDs carries significant risks. FXCM AU (AFSL 309763), please read the Financial Services Guide, Product Disclosure Statement, Target Market Determination and Terms of Business at fxcm.com/au
Stratos Global LLC (fxcm.com/markets):
Losses can exceed deposits.
Please be advised that the information presented on TradingView is provided to FXCM (‘Company’, ‘we’) by a third-party provider (‘TFA Global Pte Ltd’). Please be reminded that you are solely responsible for the trading decisions on your account. There is a very high degree of risk involved in trading. Any information and/or content is intended entirely for research, educational and informational purposes only and does not constitute investment or consultation advice or investment strategy. The information is not tailored to the investment needs of any specific person and therefore does not involve a consideration of any of the investment objectives, financial situation or needs of any viewer that may receive it. Kindly also note that past performance is not a reliable indicator of future results. Actual results may differ materially from those anticipated in forward-looking or past performance statements. We assume no liability as to the accuracy or completeness of any of the information and/or content provided herein and the Company cannot be held responsible for any omission, mistake nor for any loss or damage including without limitation to any loss of profit which may arise from reliance on any information supplied by TFA Global Pte Ltd.
The speaker(s) is neither an employee, agent nor representative of FXCM and is therefore acting independently. The opinions given are their own, constitute general market commentary, and do not constitute the opinion or advice of FXCM or any form of personal or investment advice. FXCM neither endorses nor guarantees offerings of third-party speakers, nor is FXCM responsible for the content, veracity or opinions of third-party speakers, presenters or participants.

GBPUSDuptrend, hitting the demand zone in 1H, creating a liquidity sweep structure, and v-formation and pull back.

GBPUSD(20250321)Today's AnalysisToday's buy and sell boundaries: 1.2972
Support and resistance levels:
1.3050
1.3021
1.3002
1.2943
1.2924
1.2895
Trading strategy:
If the price breaks through 1.2972, consider buying, the first target price is 1.3002
If the price breaks through 1.2943, consider selling, the first target price is 1.2924
