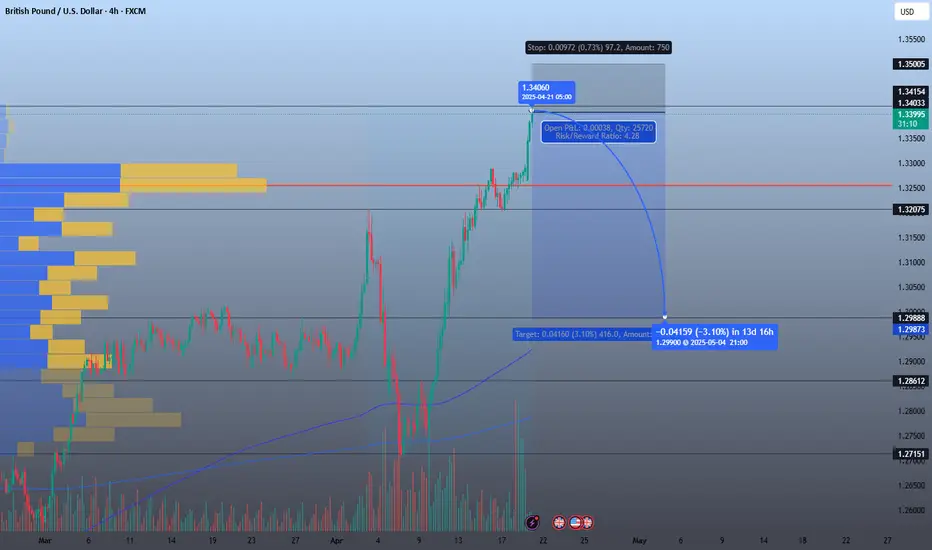
Sell OpportunityGBP/USD Sell Setup – Strong Rejection at Key Resistance
Entry: 1.3406
TP: 1.2990
SL: 1.3500
RR: 4.28
Analysis:
Price hit a strong resistance zone with heavy volume profile rejection and long-wick candle, indicating possible exhaustion. After an extended rally, a retracement is expected. Clean structure breakdown could take price back to the 1.3000 psychological level.
Bias: Bearish
Timeframe: 4H
Outlook: Short to mid-term (1–2 weeks)
GBPUSD.1.MINI trade ideas
GBPUSD Analysis – Bearish Setup From Premium ZoneAfter a strong bullish rally, GBPUSD is now tapping into a premium zone just below 1.32800–1.33000, an area aligned with an FVG (Fair Value Gap) and potential liquidity grab. The pair looks set for a short-term correction before any further continuation.
🔍 Key Elements of This Analysis:
Premium Price Zone: Price has entered a high-probability reversal zone after a sustained bullish move, reacting within a supply/FVG area.
Liquidity Consideration: Buy-side liquidity above recent highs is likely to be swept before any downside move gains momentum.
Bearish Bias: My short bias is based on exhaustion near premium levels and the potential for a correction into previous demand zones.
🎯 Target Levels:
TP1: 1.3050 (first structure break zone)
TP2: 1.2957 (imbalance fill level)
TP3: 1.2846 (golden retracement zone / higher timeframe demand)
🛡️ Risk Management:
The stop-loss is placed above the previous high at 1.3374, protecting against unexpected breakouts. Entry is based on confirmation of price rejection inside the FVG area.
This trade idea follows my model combining liquidity sweeps, FVGs, and price action within premium zones — staying aligned with macro structure and clean execution.
— Emerson Massawe

GBPUSD Let’s see if sellers step in.GBP/USD Trade Update: Holding My Sell at 1.32480
I entered a sell trade at 1.32480, expecting a reversal based on key technical and fundamental setups. But with GBP/USD now sitting at 1.33814, I have to reassess market conditions while still staying true to my trading approach.
Fundamental Overview – Why I Still Favor Downside
This week’s economic events could create volatility, and I’m paying close attention to:
UK PMI (April 23): Expected declines in Manufacturing (44.1) and Services (51.0) suggest economic weakness, which could weigh on GBP.
US Durable Goods Orders (April 24): Mixed expectations—headline at +1.8%, but ex-defense and transportation are negative, meaning uncertainty in USD strength.
UK Retail Sales (April 25): Forecasted at -0.3%, signaling weaker consumer spending. This aligns with my sell bias, as slowing UK economic data could trigger renewed selling pressure.
If the UK data disappoints, GBP/USD could struggle to hold higher levels, reinforcing my trade.
Technical & Price Action Analysis
Resistance Holding at 1.342–1.345:
Strong resistance is forming here. If bulls fail to push past this zone, my sell trade could still play out.
Wick formations near this level suggest some rejection, but confirmation is needed.
Key Support Levels for a Potential Drop:
1.330–1.331 (Flipped Resistance, Now Support) – Watching if price retests this zone.
1.326–1.327 (Major Support) – If momentum shifts, price could revisit this area.
1.321 (Stronger Support) – If price weakens further, this becomes my downside target.
Momentum is slowing, but the bullish trend is still intact unless price rejects at 1.342–1.345.
Volume Profile & Institutional Behavior – Are Big Players Selling?
Signs of Institutional Unloading:
Buy-side orders appear strong, but price is not breaking higher with conviction. This could mean large traders are selling into the rally.
Watching for a delta imbalance where buyers dominate order flow, but price fails to rise. This is a classic distribution sign.
Why This Matters: If institutions are offloading positions near 1.342–1.345, we could see price stall and reverse. My focus is on whether this resistance holds or breaks. That will define whether my sell trade remains valid.
My Trade Management Plan – Staying Patient
As a daily trader, I wait for the daily candle close before making adjustments.
If price rejects 1.342–1.345, I’ll hold my position with targets back toward 1.330–1.327.
If price breaks above resistance and holds, I may need to reevaluate my stop-loss placement.
Final Thoughts – Trusting My Process
I’m still holding my sell at 1.32480, but I recognize that buyers are testing key resistance. If institutions are quietly distributing, we could see a shift back to the bearish side, but I’m waiting for confirmation at the daily close.
I’ll update once the daily candle closes. Let’s see if sellers step in.

GBP/USD.. 30M chart patren..GBP/USD short trade setup summarized clearly:
---
Trade Setup:
Pair: GBP/USD
Direction: SELL
Entry: 1.32150
Resistance (Stop-Loss Area): 1.32500
Target 1: 1.31690 (approx. +46 pips)
Target 2: 1.31000 (approx. +115 pips)
---
Risk/Reward Analysis (R:R):
Stop-loss: 1.32500 (−35 pips)
Target 1 R:R: ~1.3:1
Target 2 R:R: ~3.3:1
This setup has a solid R:R if price reacts from the 1.32150 level and respects 1.32500 as resistance.
Would you like a quick technical chart analysis or fundamental outlook to back the trade?

"Key Breakouts: Confirmation Signals for the Next Trend"FX:GBPUSD We are waiting for the first key level break at wave B, and for further confirmation, the key level break at X is needed to initiate wave C.

GBPUSDRising wedge with bearish divergence, break of 1.3360 , which is the neckline of double top, break of this neckline starts the immediate sell pressure.


GBPUSD - bottom out pattern going on? What's next??#GBPUSD - perfect move as per our last couple of ideas regarding #GBPUSD
and now in current situation we have 1.3220 as immediate supporting and below that 1.3140
If market holds that supporting areas then we can expect further bounce towards 1.3500 and after that 1.3700 , 1.3900 n upto 1.4200
So stay sharp and don't be lazy here..
Good luck
Trade wisley

GU-Fri-18/04/25 TDA-Let GU cool off, be ready for next week!Analysis done directly on the chart
If you don't know where to start, just
start focusing on yourself. Treat well yourself,
stay in shape, understand yourself before
others, build up your confidence, let go the
ego (you don't want to be your own enemy).
What you're doing outside of trading can
affect your trading performance as well.
Have you ever thought about it?
Share your experiences in the comment!
Not financial advice, DYOR.
Market Flow Strategy
Mister Y

GBPUSD in gbpusd today has no expiry so and liquid not shown up side so i expect market now shift in sell side and recently qaurter month changetoo so i trade sell side

GBPUSD long to last short term highMy analysis suggests price might touch or break last STH at the 1.3384 area. The liquidity sweep that happened today at the 1.3363 area supports this.

#GBPUSD #IDEAGu today i looking for a selling on M15 to in order Gu pullback to rebalance market back
i will wait on M3 or M5 to show some selling model before deside to sell

GBPUSD LONG/SWING UPDATESHello folks, its been a long time no post.
Here is my Long/swing trades for Swing traders. This idea base on weekly and monthly.
Buyside liquidity over 1.42600 this is my highest Swing. wait for a retracements we might test this high or break. wait always below.
This is only my view. this is not a financial advice.
lets swing it.
Follow for more.

GBPUSDi entered previous trade and i think i got second reentry always check risk that u opened position and reentered position..

GbpUsdlow prop but possible
reason for low prop is the consolidation we in and also just a few pips to last High (24)
good things is price action and time seem to be better today and also its a scalpe targeting within yesterday
range

UK Inflation Eases, But Pound StrengthensThe British Pound rose above $1.34 on Tuesday, its highest level in seven months, supported by broad dollar weakness. This gain came despite UK inflation softening more than expected, with headline CPI at 2.6% and services inflation down to 4.7%. Easing price pressures led markets to raise expectations for Bank of England rate cuts, now pricing in 86 basis points of easing by year-end, with a fourth cut increasingly likely.
If GBP/USD breaks above 1.3430, resistance levels are at 1.3500 and 1.3550. Support is at 1.3300, followed by 1.3200 and 1.3050.

Weekly Forex Market Analysis:GBPUSD–Issue 207(FreeThe analyst predicts that the GBP/USD rate will increase within the time specified on the countdown timer. This prediction is based on a quantitative analysis of the price trend
___Please note that the specified take-profit level does not imply a prediction that the price will reach that point. In this framework of analysis and trading, unlike the stop-loss, which is mandatory, setting a take-profit level is optional. Whether the price reaches the take-profit level or not is of no significance, as the results are calculated based on the start and end times. The take-profit level merely indicates the potential maximum price fluctuation within that time frame.

LEAP: GBPUSD Week 17 Swing Zone/LevelsLast week saw a good pinch on market pips. Aim to continue as always.
Price swing levels are set; either a or b, price action directs.
Levels/zones are calculated based on previous week H/L

GBPUSD Will Grow! Long!
Please, check our technical outlook for GBPUSD.
Time Frame: 9h
Current Trend: Bullish
Sentiment: Oversold (based on 7-period RSI)
Forecast: Bullish
The price is testing a key support 1.329.
Current market trend & oversold RSI makes me think that buyers will push the price. I will anticipate a bullish movement at least to 1.342 level.
P.S
Overbought describes a period of time where there has been a significant and consistent upward move in price over a period of time without much pullback.
Disclosure: I am part of Trade Nation's Influencer program and receive a monthly fee for using their TradingView charts in my analysis.
Like and subscribe and comment my ideas if you enjoy them!

GBP/USD: The Bear's Ride Down the TrendAs I assess the GBP/USD market today, I see that the current price is 1.32466, and I’ve taken a sell position at 1.32480, which is moving well. Based on recent fundamentals, technical indicators, and historical weekly data, here’s my full market breakdown:
Fundamentals & Economic Outlook
Recent US economic data has provided mixed signals for the dollar:
Initial & 4-Week Jobless Claims: Came in lower than expected, signaling a stronger labor market, which supports USD strength.
Continuing Jobless Claims: Higher than expected, showing some lingering unemployment pressure.
Housing Starts: Significantly below expectations, hinting at weakness in real estate.
Building Permits: Surpassed expectations, suggesting future construction remains strong.
Looking ahead to next week, key events will shape price action:
UK S&P Global PMIs: If manufacturing and services figures improve, GBP may gain traction.
US PMIs & Home Sales: Expected to trend lower, possibly weakening USD momentum.
UK Retail Sales (Friday): Anticipated to drop significantly, which could weigh on GBP.
US Michigan Consumer Sentiment: Forecasted to decline, potentially putting USD under pressure.
With these fundamental factors, GBP/USD faces mixed conditions—potential volatility ahead.
Momentum readings show caution for bulls:
Short-term (1-minute to 15-minute) indicators suggest mild consolidation.
The 1-hour and daily charts indicate GBP/USD is overextended compared to historical averages.
Weekly and monthly averages are much lower (~1.27047 and 1.23141), signaling the risk of mean reversion.
Trading Strategy & Considerations
Since I’m already in a sell position, I’m watching support levels closely for profit-taking zones.
If price dips near 1.3100, I might secure partial profits before assessing further downside potential.
I’ll keep an eye on daily EMA (~1.25176) as a deeper support that might act as a turning point.
Technical divergences (such as the Accumulation Distribution Oscillator) hint at distribution pressure, reinforcing my bearish bias.
With all this being said, i'm looking for a new pair to dive deep into. What do you recommend and why? Im all ears! also dont hesitate to reach out id love to talk about forex! :) im in the works of creating a youtube page and maybe a X account. Hope to reach some of you there as well.
p.s i love this shit!

Elliott Wave Confirms That GBPUSD Has Resumed Its Upward MoveGBPUSD has recently broken above its April 3, 2025 peak of 1.3207, which we identified as wave (1) in the chart. This breakout signals a bullish trend starting from the January 13, 2025 low of 1.2705, suggesting more upward movement ahead. The rally from this low follows a five-wave Elliott Wave pattern. This is a common structure in technical analysis indicating a strong trend.
Starting from the January 13 low, the first wave or wave (1) reached 1.3207.,A pullback in wave (2) then followed which ended at 1.2705. This pullback formed a zigzag pattern. Wave A dropped to 1.2823, wave B rose to 1.2934, and wave C fell to 1.2705, completing wave (2).
The pair has now moved higher into wave (3). From the wave (2) low, the first sub-wave (wave ((i))) peaked at 1.2864, followed by a dip in wave ((ii)) to 1.274. The third sub-wave (wave ((iii))) climbed to 1.314, and the fourth (wave ((iv))) dipped to 1.3027. The fifth sub-wave (wave ((v))) is expected to finish soon, completing wave 1 of a larger pattern.
After this, the pair is likely to pull back in wave 2, correcting the upward move from the April 8, 2025 low. This correction could unfold in 3, 7, or 11 smaller swings before the pair resumes its upward trend. In the short term, as long as the 1.27 low holds, any dips should attract buyers in 3, 7, or 11 swings, supporting further gains.

DOW Theory GBPUSD 1 HOUR CHART Higher Highs and Higher LowsDOW Theory GBPUSD 1 HOUR CHART Higher Highs and Higher Lows

GBPUSD SHORT FORECAST Q2 W17 D23 Y25GBPUSD SHORT FORECAST Q2 W17 D23 Y25
SUMMARY
- Weekly order block
- Daily order block
- Price action bullish in current point of interest.
REQUIREMNTS
- Setup A) Substantial 15' break of structure, creating 15' order block to short from on the pull back.
- Setup C) Lower time frame break of structure without initial 15' break of structure.
- Candle stick formation confluences.
FRGNT X
IG - JCFRGNT
