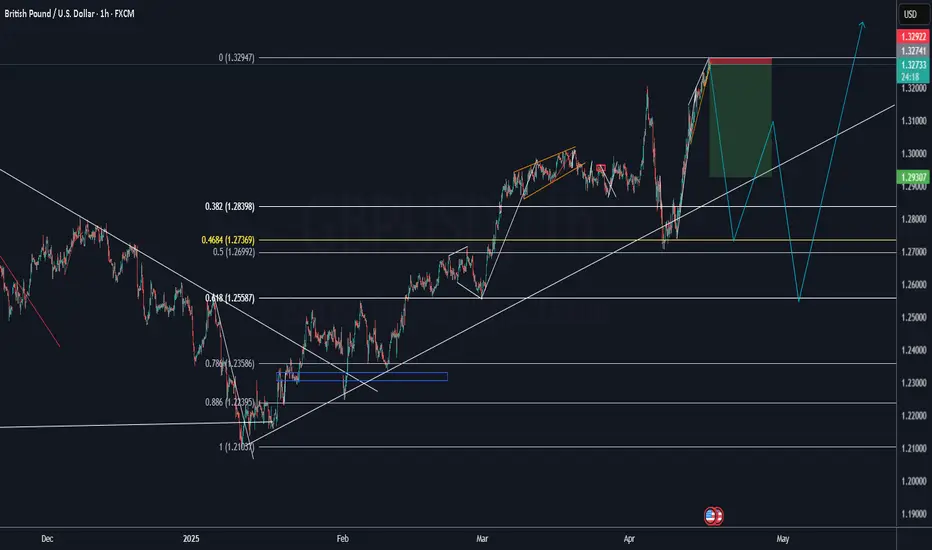
GBP/USD Pullback PotentialIt took awhile for Cable to finally mount a rally above the 1.3000 handle. That price was resistance multiple times in March, but it wasn't until the next month that prices were able to finally sustain a push above the big figure. It wasn't exactly a clean trend, especially considering the sell-off on April 4th, which broke through a number of supports; but the response that was intense as GBP/USD jumped back-above 1.3000 and ran all the way into 1.3250.
Which presents us with the current scenario...
Wednesday brought an indecision candle right at that psychological level and so far today on Thursday, there's more indecision showing. This doesn't necessarily portend reversal but it does highlight that bulls may want to try to be patient here and look for a pullback.
For support, both the Fibonacci level at 1.3105 and the psychological level at 1.3000 were resistance on the way up but have yet to show support after the breakout. Bulls holding higher-lows at either of those spots keeps the door open for continuation into longer-term resistance around Fibonacci levels at 1.3328 and 1.3414. - js
GBPUSD.1.MINI trade ideas

Perfect GBPUSD short opportunity. we expect the price to pullback to the 61.8 which is our second target. we are on B wave on the bigger correction.
GBPUSD:SIGNALHello friends
Given the good growth we had, we can buy within the specified support ranges with capital and risk management because buyers reacted well after the price correction and this could be the beginning of a good growth.
*Trade safely with us*

GBPUSD Will it continue to rise?Today, GBP/USD rose to 1.3238, reaching its highest level since October 3, 2024. In the early London market, it briefly touched a low of 1.3184 and then rebounded quickly.
The UK's inflation data for March will be released tomorrow. If the actual data meets or exceeds expectations, it will further enhance the market's expectations that the Bank of England will maintain its current monetary policy or adopt a tightening policy. As a result, the British pound will be supported, and the GBP/USD will be driven to rise.
GBPUSD trading strategy
buy @:1.31900-1.32100
sl 1.31300
tp 1.32550-1.32750
If my strategy is helpful to you, please give a thumbs-up for support. If you have different opinions, you can leave your thoughts in the comments. 👉👉👉

GBP/USD Trade Idea (2H Timeframe) We’re expecting a downward movSell Entry Zone: 1.32350 – 1.32450
Stop Loss: Above 1.32850 (safe buffer to avoid fakeouts)
Take Profit Targets:
TP1: 1.31081
TP2: 1.30133
TP3: 1.28860
Final TP: 1.27096
Market is testing a strong resistance zone. Wait for confirmation or a bearish rejection candle before entering. Trade safe, trade smart!

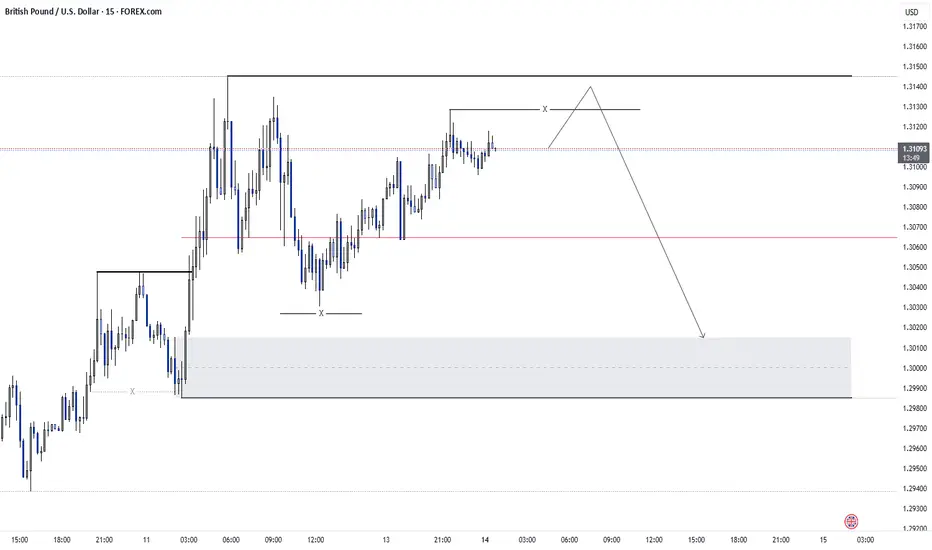
GBPUSD - Intraday Analysis: Expect a slight correctionIt is true that the order flow is bullish on the daily timeframe, but on this timeframe, the price has reached an order block. Considering the price reaching a P/D array on the 4-hour timeframe, I expect the price to move towards clearing the liquidity of the internal range on the 15-minute timeframe after clearing the liquidity of the external range.
GBP/USD + Fair Value GAPOn GBP/USD , it's nice to see a strong buying reaction at the price of 1.30160.
There's a significant accumulation of contracts in this area, indicating strong buyer interest. I believe that buyers who entered at this level will defend their long positions. If the price returns to this area, strong buyers will likely push the market up again.
(FVG) - Fair Value GAP and high volume cluster are the main reasons for my decision to go long on this trade.
Happy trading
Dale

GBPUSD Analysis Today: Technical and Order Flow !In this video I will be sharing my GBPUSD analysis today, by providing my complete technical and order flow analysis, so you can watch it to possibly improve your forex trading skillset. The video is structured in 3 parts, first I will be performing my complete technical analysis, then I will be moving to the COT data analysis, so how the big payers in market are moving their orders, and to do this I will be using my customized proprietary software and then I will be putting together these two different types of analysis.

Master Forex Trading with ICT Kill Zones (2024 Guide)The forex market runs 24/5, but not all hours are equally profitable. ICT Kill Zones highlight the 4 most volatile trading windows where institutional activity creates prime opportunities.
ICT Kill Zones Timetable (GMT/EST)
Asian: 8PM - 10PM EST / 12AM - 2AM GMT
London: 2AM - 5AM EST / 6AM - 9AM GMT
New York: 7AM - 9AM EST / 11AM - 1PM GMT
London Close: 10AM - 12PM EST / 2PM - 4PM GMT
Key Characteristics:
Asian Session
Best for AUD, NZD, JPY pairs
Low volatility; ideal for 15-20 pip scalps
London Session
Highest liquidity (trade EUR/GBP)
Often sets daily highs/lows
New York Session
Overlap with London creates high volatility
Focus on USD pairs (e.g., USD/CAD)
London Close
Price retracements to daily range
Quick 15-20 pip reversal plays

Gbp/Usd 11-Apr 2025The GBP/USD currency pair has recently shown signs of strength, trading above the 1.30 level. This movement appears to be influenced by a weaker US dollar, which may be attributed to ongoing trade tensions and lower-than-expected US inflation data released yesterday. Additionally, UK GDP figures came in above market forecasts, potentially supporting the pound.
Looking ahead, upcoming US data releases—including PPI, Consumer Sentiment, and Inflation Expectations—may introduce market volatility and impact USD-related pairs.
Possible Price Scenarios (Not Financial Advice):
• If the price revisits the 1.30 level and shows signs of support, this may indicate reduced selling pressure, with a potential move toward the 1.32 level if buying interest returns.
• A move above 1.325—possibly supported by lower-than-expected PPI data—could open the door for a continuation toward the 1.343 region.
• Conversely, if the price breaks below the 1.30 level, the 1.277 area may serve as the next level of interest, where buying activity could potentially emerge.
• Should bearish momentum continue past 1.272, the 1.25 level might become the next key area to monitor for possible price reactions.
Disclaimer: easyMarkets Account on TradingView allows you to combine easyMarkets industry leading conditions, regulated trading and tight fixed spreads with TradingView's powerful social network for traders, advanced charting and analytics. Access no slippage on limit orders, tight fixed spreads, negative balance protection, no hidden fees or commission, and seamless integration.
Any opinions, news, research, analyses, prices, other information, or links to third-party sites contained on this website are provided on an "as-is" basis, are intended only to be informative, is not an advice nor a recommendation, nor research, or a record of our trading prices, or an offer of, or solicitation for a transaction in any financial instrument and thus should not be treated as such. The information provided does not involve any specific investment objectives, financial situation and needs of any specific person who may receive it. Please be aware, that past performance is not a reliable indicator of future performance and/or results. Past Performance or Forward-looking scenarios based upon the reasonable beliefs of the third-party provider are not a guarantee of future performance. Actual results may differ materially from those anticipated in forward-looking or past performance statements. easyMarkets makes no representation or warranty and assumes no liability as to the accuracy or completeness of the information provided, nor any loss arising from any investment based on a recommendation, forecast or any information supplied by any third-party.

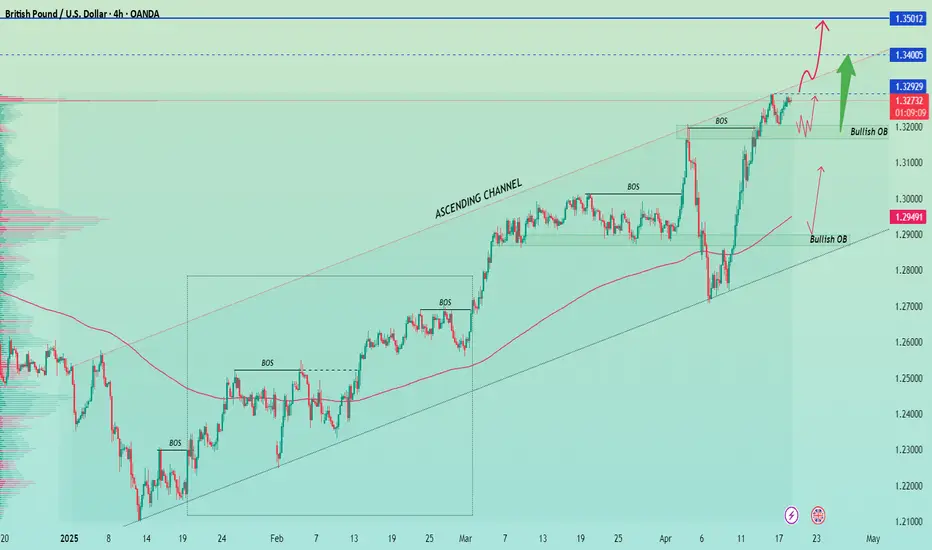
GBPUSD Bullish Outlook: Strong Support Bounce Fuels GBPUSD RallyGBPUSD Price Forecast: The market is currently in an upward trend, with a recent retracement bouncing off a strong support level. The 200 EMA supports a bullish scenario, and increasing volume on the buying side signals strong buyer momentum. Technical targets are set at 1.3400 and 1.3500. Like, comment, and follow for more updates like this!
GBPUSD TRADE IDEAhi all
this my trade plan until end of this month
good luck
**My trading strategy is not intended to be a signal. It's a process of learning about market structure and sharpening my trading my skills also for my trade journal**
Thanks a lot for your support

GBPUSD Short 4/22/2025GBP/USD Short Setup – Multi-Timeframe Rejection at September High
We're entering a short on GBP/USD based on a clean confluence of structure, pattern, and timing.
Daily Chart:
Price is rejecting a key resistance level from the week of September 20–27 — the high from that week has now been tapped five times in the last week, with today marking yet another rejection.
Intraday Timing:
Yesterday (Monday): London session tapped the September high.
Today (Tuesday): Pre-London rally hit that same level and failed again.
This sets the tone for a double-tap liquidity run that’s now looking exhausted.
4H Chart:
Bearish rejection wick is forming (potential hammer) — still two hours left, but current structure suggests selling pressure off the highs.
1H Chart:
We’ve printed a clean double top, and the most recent candle is closing as a bearish engulfing, rejecting straight off the key zone.
Entry: 1.33932
Stop: 1.34303
Target 1 (conservative): 1:1.2 R:R — midline from Sunday’s Asia session.
Target 2 (extension): 1.32986 — a clear structural level and liquidity pocket from previous demand.
With momentum turning and buyers failing to break higher despite multiple attempts, this setup leans heavily bearish for the next few sessions

GBPUSD ShortWe have a lot of wicks which indicates slowdown in price and an bearish engulfing, we have an 5m imbalance where my entry is and i can cover the highs with the 10 pip stop.
75% will be taken off at 3RR, rest will go to 8RR asia low or breakeven.

GU-Mon-21/04/25 TDA-Dollar is weakening fast!Analysis done directly on the chart
Make sure to stay up to date to macroeconomic events
gold keeps making new ATHs, rapid weakening of dollar.
GU testing daily R at 1.34150, will it break through and
continue up?
Not financial advice, DYOR.
Market Flow Strategy
Mister Y

GUWe have multiple confluences to look for short positions here. We have some liquidity/equal lows that need to be taken out. We would also be entering a key demand zone as well.

GBPUSD Sell GBP Index has big gap , which has to be filled at some point . USD had massive loss yesterday we have to retest at some point . GBPUSD 30 min and 1 H timeframe made silver bullet strategy to the downside that means we have chance to move down massive today
4 RRR
GL Traders
NOT ADVICE !

correctionThe trend change is expected to form in the current resistance range and the start of a downward trend. A break of the support trend line will be a confirmation of the downward trend.

Risky Scalp Buy on GBPUSDrisky trade cuz no Confirmation if we Wait for confirmation the Risk to Reward will become low SO that's why...

UPDATE ON GBP/USD TRADEGBP/USD 1H - Morning people, I hope you are all okay. As you can see price has played out again very well during the Asian session. I believe we will see our TP achieved by the end of todays NY.
With price setting new highs and lows above our entry I believe we safe to move our SL to breakeven to avoid taking any losses from this position. A reversal here would mean longer term bearishness anyways.
This trade is currently running + 152 pips. (+ 6.4%) 6.4RR
A big well done to those of you who jumped in on this trade, if you have any questions with regards to the analysis or the position itself then please drop me a message or comment below and I will get back to you as soon as possible.
Ensure you are managing your trades correctly. I have gone ahead and moved my SL to Entry and I have also taken another partial to bank profits and remove any unwanted risk.

GBP/USD: The Wizard's Descent from the Double Top MountainGBP/USD: The Wizard's Descent from the Double Top Mountain
Technical Analysis:
GBP/USD 4H chart shows a clear Double Top formation at approximately 1.3725, a critical resistance level
The Treasure Hunter indicator has shifted color, signaling bearish momentum building (Hero taking damage)
Our Wizard's Journey progress bar indicates we're at 50% completion of the Mountain Pass, suggesting we're at a prime reversal point
Currently testing Elite Level 235 resistance zone (2345 XP), with declining XP Progress (35%)
Forecast:
Anticipating a significant pullback from current resistance
Initial Minion Zone at 1.3200 provides first target level
Watch for confirmation with HERO's Health declining from current 100%
Trading Strategy:
Short position opportunity forming with ELITE LvL 2 resistance rejecting price advance
Stop loss placement above Double Top at 1.3750
Risk/reward favorable with multiple support levels to target
Watch 4H candle closes below 1.3690 for entry confirmation
Quest Status: Active - Prepare for the wizard's descent from the mountain peak!

GU-Tue-22/04/25 TDA-GU 1.34150 strong daily/weekly RAnalysis done directly on the chart
We are witnessing historical changes.
Gold making new ATHs, US strength
is declining rapidly, there's a good chance
for US economy to go in recession in 2025.
What's your fundamental view on the current
market?
Comment down below
Not financial advice, DYOR.
Market Flow Strategy
Mister Y

GBPUSD 30M CHART PATTERNThis chart is for GBP/USD on a 30-minute timeframe and it appears to show a potential bearish reversal pattern, likely a head and shoulders or double top scenario. Here's a breakdown of the strategy shown:
Resistance Zone (Top Green Box): Price has tested this area multiple times, creating a potential top.
Support Zone (Bottom Green Box): Price has also bounced from here a few times, forming the base of a range.
Stop Loss (Red Arrow): Placed just above the resistance, in case of a breakout upward.
Take Profit (Blue Line): Set at or just below the support zone, expecting a downward move.
Trade Bias: Bearish — the trader is anticipating a reversal from resistance and a move toward support.
This setup assumes the price won't break above resistance, and will instead fall back down to the support zone — potentially forming a range trade or a continuation pattern if it breaks lower.
Do you want help analyzing whether this is a solid setup based on current market sentiment or recent data?
