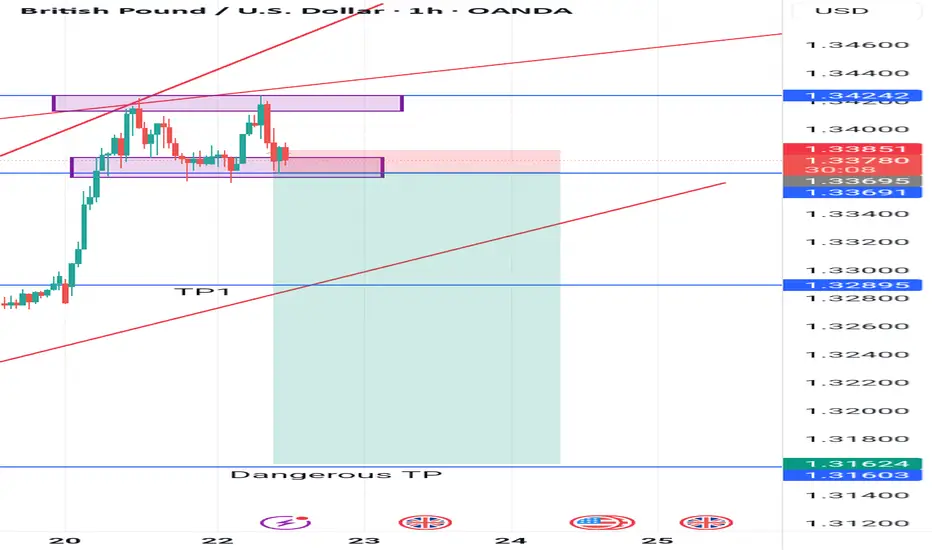
Breakout and retest The market is consolidating, bouncing on our support and resistance. ON a daily timeframe you can see a double top ,even on H1. The confusing thing is on the day we are in a uptrend movement, so in order to see if the market is selling now it must break our support once our support becomes our resistance we sell . Use TP1 to be safe ,use a trailstop if you will going for TP2
GBPUSD.1.MINI trade ideas

Week 17 GBPUSD analysis 21042025We keep this analysis simple by looking at the higher time frame and identifying our resistance as around 1.42, while our support is 1.21. Price has been ranging between these two price levels. We see that there is a supply level at 1.34, and we have to wait to see if the price will break above 1.345 either on Wednesday or after NFP next month.
Entry price with pending orders
Buy stop 1.34500
Take profit 1.40
Disclaimer: Not a trading advice, for educational use only. Trade it on demo
If you like my analysis, please give it a boost or let me know how you want to trade it in the comment section.

Sell level gbpusdStill buyers dominated don't try to sell till our mentioned selling levels
Gbpusd moving on monthly time frame

GBPUSDCentral Bank Heads and Policy Influence
Bank of England (BoE) – Governor Andrew Bailey
Policy Stance: Andrew Bailey has emphasized caution on rate cuts, noting that UK inflation pressures are falling only gradually. The BoE has kept its main rate at 4.5% and signaled that it needs more evidence before easing policy. However, market expectations are shifting, with investors now pricing in two rate cuts in 2024 and a 50/50 chance of a first cut as early as June or August.
Impact: The BoE’s cautious approach has supported GBP recently, but dovish signals and the likelihood of rate cuts later in 2025 are weighing on the pound’s medium-term outlook. Bailey’s leadership is seen as steady but data-dependent, and his upcoming role as Chair of the Financial Stability Board may enhance his international influence.
US Federal Reserve – Chair Jerome Powell
Policy Stance: Jerome Powell has reiterated the need for patience and caution before making any changes to US rates, stressing the importance of more clarity on economic and inflation trends. The Fed’s benchmark rate remains at 4.25%–4.50%, and Powell’s recent comments suggest the Fed is in no rush to cut, especially with inflation still above target and new uncertainties from US tariff policies.
Political Pressure: President Trump has publicly criticized Powell for not cutting rates and has threatened his removal, but Powell remains committed to his term and the Fed’s independence. This political tension adds uncertainty but, for now, the Fed’s stance remains steady and data-driven.
Impact: The Fed’s reluctance to cut rates supports the dollar, especially as the BoE moves closer to easing. This policy divergence is a key factor in the current and expected bias for GBP/USD.
Summary Table: Central Bank Influence on GBP/USD
Central Bank Head Current Stance Expected Policy Move Impact on GBP/USD Directional Bias
Andrew Bailey (BoE) Cautious, data-driven Rate cuts likely in 2024 Weighs on GBP medium-term, limits upside
Jerome Powell (Fed) Patient, hawkish-leaning Rate cuts delayed Supports USD, adds downside risk to GBP/USD
Conclusion
Near-term: GBP/USD retains a bullish bias above supplyroof , but the upside may be capped as markets anticipate BoE rate cuts while the Fed remains on hold.
Medium-term: Policy divergence—BoE turning dovish and Fed staying cautious—suggests a bearish tilt for GBP/USD as 2025 progresses, unless US economic data weakens sharply or the Fed pivots sooner than expected.
Central Bank Heads: The leadership and communication styles of Andrew Bailey and Jerome Powell are central to market expectations, with Bailey’s caution and Powell’s patience both shaping the pair’s directional bias.

GBPUSD, still going long. Analysis 4/16 10:06pm I entered long at 1.32274, and as of April 16, 2025, at 10:00 PM, GBP/USD is trading at 1.32150, meaning I’m currently down 12.4 pips.
Trade Analysis
GBP/USD broke below 1.3225, which was acting as a support level earlier.
Bearish momentum has increased, but the next key support at 1.3205 might offer buyers a chance to defend the price.
The pair failed to push above 1.3245 resistance, meaning sellers are still in control at this stage.
Technical Indicators
RSI is near 31.90, suggesting the pair is close to oversold conditions and might attempt a bounce.
Stochastic RSI at 15.29 confirms that downward pressure is slowing, but no clear reversal is seen yet.
MACD remains negative, reinforcing weak momentum unless buyers step in soon.
Upcoming Market Events
Tomorrow’s U.S. Jobless Claims & Housing Data at 8:30 AM could impact GBP/USD significantly.
If jobless claims rise and housing numbers disappoint, USD may weaken, helping my trade recover.
If jobless claims remain low and housing holds up, USD could strengthen, pushing GBP/USD lower.
Trade Decision: Hold or Close?
Reasons to Hold:
GBP/USD is near key support at 1.3205, which could trigger a bounce.
Indicators show oversold conditions, meaning buyers might step in soon.
A recovery above 1.3225 could bring price back toward 1.3245–1.3265.
Reasons to Close:
Breaking below 1.3205 could lead to further downside, possibly toward 1.3173.
Momentum still favors USD, which could keep GBP/USD pressured.
Failure to reclaim 1.3225 soon may signal continued weakness.
Final Thoughts
I’m closely watching 1.3205—if GBP/USD finds support there, I may hold the trade. If price keeps dropping, I’ll consider exiting to minimize losses. The next 10 hours will be critical with major U.S. economic data coming up, so I’ll adjust my strategy accordingly.

Riding the GBP/USD Bull: Can This Rally Hold? 4/16 1:16pmI entered long at 1.32274, and as of now, GBP/USD is trading at 1.32280, meaning I’m slightly in profit. Based on price action, the pair is consolidating, but the overall trend bias still suggests a bullish continuation.
Technical Outlook
Support Levels:
1.3225 – This level is very close to my entry and is acting as immediate support. If price holds above this zone, my trade remains valid.
1.3205 – This is a stronger support level where previous buying interest emerged. If GBP/USD dips here, I’ll watch for a potential bounce.
Resistance Levels:
1.3265 – This level has been tested today, and price has struggled to break above it, making it a key short-term barrier. If GBP/USD clears it, bullish momentum could accelerate.
1.3295 – A more significant resistance level where selling pressure has emerged previously. If price reaches this zone, I’ll consider adjusting my position accordingly.
Technical Indicators Confirming Price Action
Relative Strength Index (RSI) on the daily timeframe is hovering around 62, indicating bullish momentum but not extreme overbought conditions.
Moving Averages (like the 20-day EMA) continue to trend upward, supporting the bullish bias.
Stochastic RSI on the 1-hour chart has cooled off slightly, suggesting a potential consolidation phase before another push higher.
Fundamental Considerations
UK Inflation came in weaker than expected (2.6%), which could limit GBP upside.
US Retail Sales beat expectations across the board, signaling strong consumer demand and reinforcing USD strength.
Powell’s speech in a few minutes is a major event—if he is hawkish, USD could gain strength and put downward pressure on GBP/USD.
Trade Strategy
Holding the long position:
As long as GBP/USD holds above 1.3225, I’m comfortable keeping the trade open.
A breakout above 1.3265 could signal the next bullish wave toward 1.3295.
Final Thoughts
Right now, my trade is still in a reasonable position, but the next few hours will be critical, especially with Powell’s speech approaching. If GBP/USD holds 1.3225 and clears 1.3265, my long position could continue to perform well.


GBPUSD H4 I Bearish Drop Based on the H4 chart analysis, we can see that the price is testing our sell entry at 1.3260, which is a pullback resistance.
Our take profit will be at 1.3166, an overlap support level.
The stop loss will be placed at 1.3368, above the 127.2% Fibo extension.
High Risk Investment Warning
Trading Forex/CFDs on margin carries a high level of risk and may not be suitable for all investors. Leverage can work against you.
Stratos Markets Limited (tradu.com):
CFDs are complex instruments and come with a high risk of losing money rapidly due to leverage. 63% of retail investor accounts lose money when trading CFDs with this provider. You should consider whether you understand how CFDs work and whether you can afford to take the high risk of losing your money.
Stratos Europe Ltd (tradu.com):
CFDs are complex instruments and come with a high risk of losing money rapidly due to leverage. 63% of retail investor accounts lose money when trading CFDs with this provider. You should consider whether you understand how CFDs work and whether you can afford to take the high risk of losing your money.
Stratos Global LLC (tradu.com):
Losses can exceed deposits.
Please be advised that the information presented on TradingView is provided to Tradu (‘Company’, ‘we’) by a third-party provider (‘TFA Global Pte Ltd’). Please be reminded that you are solely responsible for the trading decisions on your account. There is a very high degree of risk involved in trading. Any information and/or content is intended entirely for research, educational and informational purposes only and does not constitute investment or consultation advice or investment strategy. The information is not tailored to the investment needs of any specific person and therefore does not involve a consideration of any of the investment objectives, financial situation or needs of any viewer that may receive it. Kindly also note that past performance is not a reliable indicator of future results. Actual results may differ materially from those anticipated in forward-looking or past performance statements. We assume no liability as to the accuracy or completeness of any of the information and/or content provided herein and the Company cannot be held responsible for any omission, mistake nor for any loss or damage including without limitation to any loss of profit which may arise from reliance on any information supplied by TFA Global Pte Ltd.
The speaker(s) is neither an employee, agent nor representative of Tradu and is therefore acting independently. The opinions given are their own, constitute general market commentary, and do not constitute the opinion or advice of Tradu or any form of personal or investment advice. Tradu neither endorses nor guarantees offerings of third-party speakers, nor is Tradu responsible for the content, veracity or opinions of third-party speakers, presenters or participants.

GU SELL SETUP After break of structure a resistance formation was made which leads to a sell. Sell on a resistance

GBPUSDlooking for short my entry price will b 1.3265
n profit target im looking at 1.2521
lets see where its take us ,just an idea to share


GBPUSD INTRADAY bullish breakout supported at 1.3288GBP/USD maintains a bullish bias, with the broader trend and structure supporting upside continuation. The recent intraday move appears to be a bullish breakout toward a key prior consolidation area.
Key Support: 1.3288 – aligns with the previous consolidation zone and potential bullish inflection point.
Upside Targets:
1.3435 – initial resistance level
1.3500 and 1.3580 – medium to long-term bullish targets
If price finds support at 1.3288 and forms a bullish reversal, it would confirm the continuation of the uptrend toward the mentioned resistance levels.
However, a break and daily close below 1.3288 would invalidate the bullish scenario, suggesting deeper retracement toward 1.3210, with further support at 1.3120 and 1.2980.
Conclusion
GBP/USD remains bullish above 1.3288. Look for a bounce from this level to confirm upside continuation. A daily close below 1.3288 would turn the outlook bearish, exposing lower support levels.
This communication is for informational purposes only and should not be viewed as any form of recommendation as to a particular course of action or as investment advice. It is not intended as an offer or solicitation for the purchase or sale of any financial instrument or as an official confirmation of any transaction. Opinions, estimates and assumptions expressed herein are made as of the date of this communication and are subject to change without notice. This communication has been prepared based upon information, including market prices, data and other information, believed to be reliable; however, Trade Nation does not warrant its completeness or accuracy. All market prices and market data contained in or attached to this communication are indicative and subject to change without notice.

Cable H4 | Falling toward a pullback supportCable (GBP/USD) is falling towards a pullback support and could potentially bounce off this level to climb higher.
Buy entry is at 1.3290 which is a pullback support.
Stop loss is at 1.3192 which is a level that lies underneath an overlap support.
Take profit is at 1.3515 which is a resistance that aligns with the 161.8% Fibonacci extension.
High Risk Investment Warning
Trading Forex/CFDs on margin carries a high level of risk and may not be suitable for all investors. Leverage can work against you.
Stratos Markets Limited (tradu.com):
CFDs are complex instruments and come with a high risk of losing money rapidly due to leverage. 63% of retail investor accounts lose money when trading CFDs with this provider. You should consider whether you understand how CFDs work and whether you can afford to take the high risk of losing your money.
Stratos Europe Ltd (tradu.com):
CFDs are complex instruments and come with a high risk of losing money rapidly due to leverage. 63% of retail investor accounts lose money when trading CFDs with this provider. You should consider whether you understand how CFDs work and whether you can afford to take the high risk of losing your money.
Stratos Global LLC (tradu.com):
Losses can exceed deposits.
Please be advised that the information presented on TradingView is provided to Tradu (‘Company’, ‘we’) by a third-party provider (‘TFA Global Pte Ltd’). Please be reminded that you are solely responsible for the trading decisions on your account. There is a very high degree of risk involved in trading. Any information and/or content is intended entirely for research, educational and informational purposes only and does not constitute investment or consultation advice or investment strategy. The information is not tailored to the investment needs of any specific person and therefore does not involve a consideration of any of the investment objectives, financial situation or needs of any viewer that may receive it. Kindly also note that past performance is not a reliable indicator of future results. Actual results may differ materially from those anticipated in forward-looking or past performance statements. We assume no liability as to the accuracy or completeness of any of the information and/or content provided herein and the Company cannot be held responsible for any omission, mistake nor for any loss or damage including without limitation to any loss of profit which may arise from reliance on any information supplied by TFA Global Pte Ltd.
The speaker(s) is neither an employee, agent nor representative of Tradu and is therefore acting independently. The opinions given are their own, constitute general market commentary, and do not constitute the opinion or advice of Tradu or any form of personal or investment advice. Tradu neither endorses nor guarantees offerings of third-party speakers, nor is Tradu responsible for the content, veracity or opinions of third-party speakers, presenters or participants.

gbpusd short/sellSignificant key levels reactions
#trends
#analysis
#forex
use proper risk management

Bullish trend GBPUSDAfter accumulation phase the pair gave a break out and started performing,as expected, in line with the Dow Theory while making a bullish trend of higher highs and higher lows.

GBPUSD Are the Bears back? I closed my previous long trade at 1.32274 after assessing the historical price action, fundamental data, and technical indicators. Now, I’m shifting my focus to waiting for bearish signals before entering a short position.
Key Market Analysis
Fundamental Overview
U.S. Jobless Claims data came in stronger than expected (215K vs. 225K forecast), reinforcing USD strength, which could pressure GBP/USD lower.
Continuing Jobless Claims were higher (1885K vs. 1870K forecast), showing some softness, but overall, labor market data supports a stronger dollar.
Housing Starts dropped sharply (1.324M vs. 1.42M forecast), but Building Permits beat expectations (1.482M vs. 1.45M). This mixed housing data isn’t enough to offset USD’s strength from labor numbers.
Technical Overview
Immediate Resistance: 1.3245 – GBP/USD has struggled to break this level, indicating sellers are defending it.
Major Resistance: 1.3265 – If price breaks above 1.3245, this would be the next selling opportunity before further upside.
Immediate Support: 1.3225 – Holding this level is critical for bulls; failure could accelerate a move downward.
Major Support: 1.3205 – If price falls below 1.3225, this will be the next logical downside target.
My New Trade Plan: Waiting for Bearish Confirmation
Now that I’ve closed my long trade, I’m waiting for a short entry based on the following setup:
Best Bearish Entry: Between 1.32350–1.32450, close to resistance where sellers have been active.
Confirmation Needed: I’ll wait for price rejection near 1.3245, along with weak momentum indicators before entering a short position.
Next Steps
I’ll monitor price action closely to confirm a strong rejection at 1.3245 before entering a short trade.
If GBP/USD pushes above 1.3245 and holds, I’ll wait for a better short entry near 1.3265.
If price breaks below 1.3225, I’ll assess the strength of the downward momentum and potentially enter a trade with 1.3205 as my first target.
At this point, I’m patiently watching the market to ensure I have the strongest bearish setup before committing to a new position.

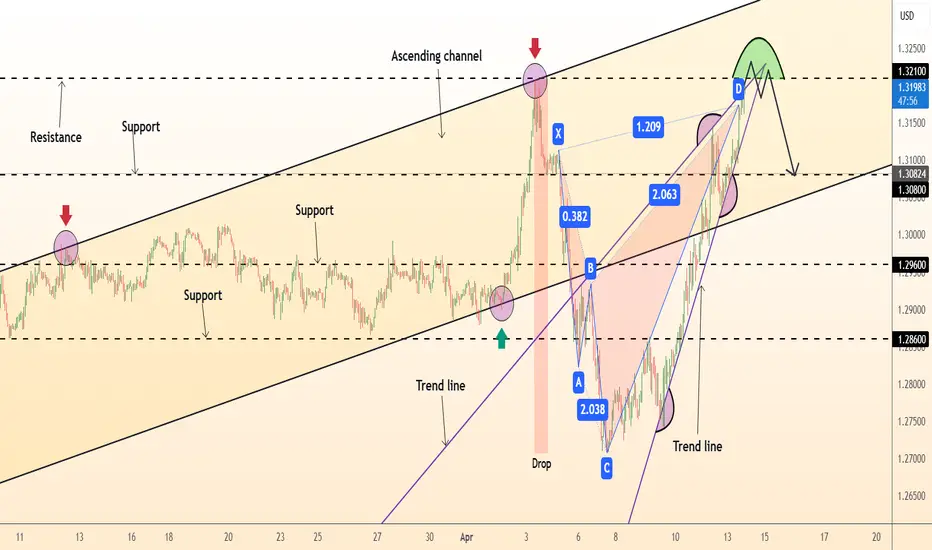
DeGRAM | GBPUSD retest of resistanceGBPUSD is in an ascending channel between the trend lines.
The price has approached the resistance level, which has already acted as a pullback point.
The chart formed an ascending wedge and kept the harmonic pattern relevant.
On the 4H Timeframe, the indicators indicate a bearish divergence.
We expect a pullback in case of consolidation under the resistance.
-------------------
Share your opinion in the comments and support the idea with a like. Thanks for your support!
Market Insights with Gary Thomson: April 14 - 18Market Insights with Gary Thomson: UK & Canada Inflation, BOC & ECB Rates, Corporate Earnings
In this video, we’ll explore the key economic events, market trends, and corporate news shaping the financial landscape. Get ready for expert insights into forex, commodities, and stocks to help you navigate the week ahead. Let’s dive in!
In this episode, we discuss:
- UK’s Unemployment and Inflation Rates
- Inflation Rate in Canada & BOC Interest Rate Decision
- ECB Interest Rate Decision
- Corporate Earnings Statements
Don’t miss out—gain insights to stay ahead in your trading journey.
This video represents the opinion of the Companies operating under the FXOpen brand only. It is not to be construed as an offer, solicitation, or recommendation with respect to products and services provided by the Companies operating under the FXOpen brand, nor is it to be considered financial advice.

GBP/USD 4H Chart Analysis – Bullish Reversal from Demand ZoneGBP/USD 4H Chart Analysis
Current Price: 1.27883
Timeframe: 4H (OANDA)
Key Zones:
🟦 Demand Zone (Support Area):
📍 Between 1.26873 (🔻 Stop Loss) and current price
This is where buyers are expected to step in and push the price higher.
🚀 Expected Move: The price is consolidating in the demand zone and might breakout upward.
➡️ Possible path:
1. Small pullback within demand zone
2. 📈 Breakout up to 1.29162 (🔵 First Resistance)
3. 📈 Continuation up to 1.31083 (🎯 Target Point)
Important Levels:
🔻 Stop Loss: 1.26873
(If price drops below this, setup is invalid)
🛑 Mid-Resistance Level: 1.29162
(Might face temporary selling pressure here)
🎯 Target Point: 1.31083
(Take-profit zone)
Conclusion:
📉 If price breaks below 1.26873 → trade invalid ❌
📈 If price holds and breaks above resistance → bullish potential ✅
Risk/Reward setup looks favorable from demand zone to target

GBP/USD Short Term Trend - Bearish Rebound🔔🔔🔔 GBP/USD news:
➡️ GBP/USD continues to climb, approaching the 1.3100 mark during European trading, as the persistent weakness in the U.S. dollar remains a key market driver. Escalating concerns over the deepening U.S.-China trade conflict and its potential to trigger a U.S. trade conflict. recession are weighing heavily on sentiment.
➡️ Broad-based selling pressure on the U.S. dollar followed China's retaliatory move to raise tariffs on American goods from 34% to 84%, supporting further gains in the GBP/USD pair.
Although Trump has temporarily paused additional tit-for-tat tariffs, investor anxiety over the U.S. Economic outlook remains elevated, with fears that trade tensions with China will intensify. As a result, the dollar remains under fresh downward pressure, allowing GBP/USD to regain bullish momentum.
Personal opinion:
➡️ DXY is showing signs of recovery after entering the extreme oversold zone. As a result, GBP/USd will have a downward phase after entering the overbought zone.
➡️ Analysis based on resistance - support levels and Volume profile combined with trend lines to come up with a suitable strategy
Plan:
🔆Price Zone Setup:
👉Sell GBP/USD 1.3080 – 1.3090
❌SL: 1.3120| ✅TP: 1.3020– 1.2970
FM wishes you a successful trading day 💰💰💰

GBP/USD Short Setup – Rejection from Resistance Zone with High REMA 30 (red line)
EMA 200 (blue line)
---
Key Levels:
Entry Point: 1.31324
Stop Loss: 1.32303
Target (TP): 1.28102
---
Analysis:
1. Trend Context:
The market shows a recent bullish move approaching a key resistance zone (highlighted in purple).
The price is now reacting to that resistance zone and potentially forming a reversal.
2. EMA Insight:
Price is currently trading slightly above the EMA 200 and EMA 30, indicating short-term bullish momentum.
However, the suggested trade setup appears to be short (sell), anticipating a reversal from resista

