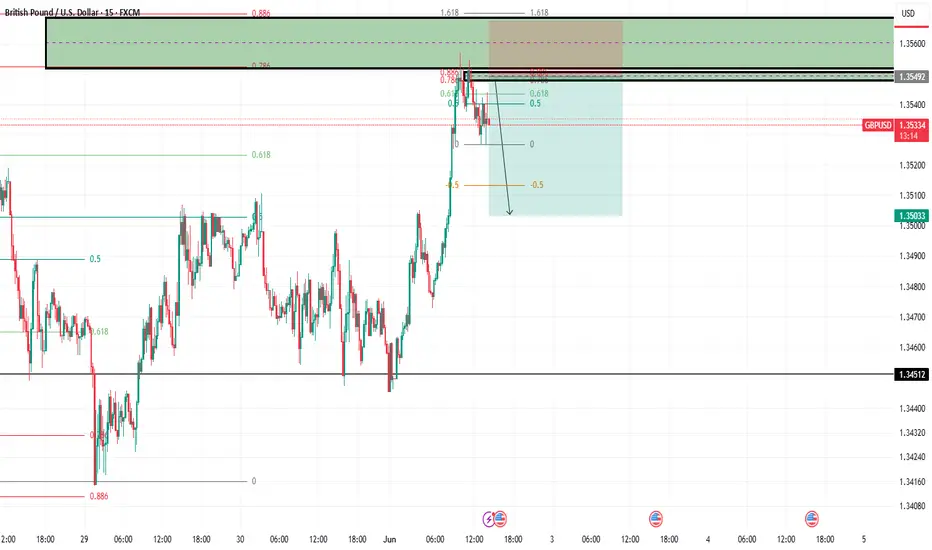
GBPUSD I Weekly CLS I Model 1 I TR Liquidity TPHey, Market Warriors, here is another outlook on this instrument
If you’ve been following me, you already know every setup you see is built around a CLS Footprint, a Key Level, Liquidity and a specific execution model.
If you haven't followed me yet, start now.
My trading system is completely mechanical — designed to remove emotions, opinions, and impulsive decisions. No messy diagonal lines. No random drawings. Just clarity, structure, and execution.
🧩 What is CLS?
CLS is real smart money — the combined power of major investment banks and central banks moving over 6.5 trillion dollars a day. Understanding their operations is key to markets.
✅ Understanding the behavior of CLS allows you to position yourself with the giants during the market manipulations — leading to buying lows and selling highs - cleaner entries, clearer exits, and consistent profits.
📍 Model 1
is right after the manipulation of the CLS candle when CIOD occurs, and we are targeting 50% of the CLS range. H4 CLS ranges supported by HTF go straight to the opposing range.
"Adapt what is useful, reject what is useless, and add what is specifically your own."
— David Perk aka Dave FX Hunter ⚔️
👍 Hit like if you find this analysis helpful, and don't hesitate to comment with your opinions, charts or any questions.
GBPUSD trade ideas

GBPUSD Approaches Key Resistance: Watch for Bearish ReversalGBPUSD pair is trading within a clearly defined ascending channel on the 1-hour chart, showing a short-term bullish structure. However, this bullish move appears corrective within a broader consolidation range capped near the 1.3590 resistance zone.
🔍 Technical Breakdown:
Current Price: 1.35535
Immediate Resistance: 1.35885–1.35929 (previous highs and psychological level)
Support Levels:
Trendline support near 1.3530
Horizontal support: 1.34282, 1.34176
Structure:
Price has formed a bullish flag breakout and is now approaching key resistance.
A new higher high is anticipated toward 1.3590, but this level has repeatedly rejected price in the past.
The projected path indicates a potential liquidity grab above 1.3590 followed by a sell-off toward 1.3420–1.3410 area, aligning with a trendline break scenario.
Bearish Scenario:
A strong rejection from the 1.3590 zone, especially if accompanied by bearish divergence or a strong candle close, could trigger a shift back down to the 1.3417–1.3428 support zone.
This would confirm a short-term top and potential retracement toward lower liquidity zones.
📊 Fundamental Backdrop:
USD-side:
Recent U.S. labor market strength (e.g. ADP report and low jobless claims) supports a hawkish bias, favoring USD upside.
However, Fed policymakers remain cautious due to trade tensions and tariff uncertainty. This has injected short-term volatility into USD pairs.
GBP-side:
UK economic data has been mixed, with GDP growth forecasts under scrutiny.
BoE policymakers are dovish, emphasizing weak productivity and wage pressures, making the pound vulnerable to downside catalysts.
📌 Conclusion:
Watch for a potential bull trap near 1.3590, followed by a bearish reversal toward 1.3420–1.3410 if momentum weakens and sellers step in. This would complete the expected technical leg down and align with broader risk sentiment if dollar strength returns.

GBP/USD.2H chart pattern.here's a breakdown of the GBP/USD 2-hour chart setup and the target points indicated:
🔍 Technical Analysis Summary
Pair: GBP/USD
Chart timeframe: 2h
Indicators used: Ichimoku Cloud, Trendline (Support), Risk-to-Reward box
Setup: Bearish break of trendline support
Direction bias: Short (Sell)
Chart pattern: Break of ascending trendline with a rejection from previous highs
Entry zone: Around 1.3540–1.3560
Stop loss: Above 1.3662
Take profit zones:
1. First Target (TP1): 1.33270
2. Second Target (TP2): 1.32110
🎯 Target Points
Target Price Description
TP1 1.33270 First support area
TP2 1.32110 Major support zone
These target points are based on previous support levels and the height of the pattern projected down from the breakout point.
Let me know if you'd like this analysis transferred to another time frame or want updated targets based on more recent price action.

#GBPUSD: Smaller Time-Frame Tells A Different Story! GBPUSD has exhibited strong bullish sentiment in shorter timeframes. However, an analysis of shorter timeframes reveals a different picture. The current price trend is upward, and it is anticipated to continue. Nevertheless, we anticipate a price correction around 1.3470, followed by a continuation of the bullish move. We strongly recommend conducting your own analysis before making any investment decisions.
Best of luck in your trading endeavours, and please remember to prioritise safety.
Kindly consider liking, commenting, and sharing this analysis for further insights.
Team Setupsfx_

GBPUSD Poised for a Bearish Move - UPDATEGBPUSD Poised for a Bearish Move - UPDATE
A few days ago, I shared a GBPUSD chart that showed signs of a correction. Now, that correction appears to be complete, and the likelihood of a larger decline is increasing. The exact catalyst for this move is uncertain, but the setup looks promising and could trigger a liquidity release.
On the 4-hour chart, GBPUSD has formed a rough variation of a Harmonic Pattern. Although this pattern isn’t perfect, it effectively blocked the price from climbing above 1.3590.
GBPUSD now seems poised for a bearish trend.
Targets: 1.3350 | 1.3250 | 1.3170
You may find more details in the chart!
Thank you and Good Luck!
❤️PS: Please support with a like or comment if you find this analysis useful for your trading day❤️
Disclosure: I am part of Trade Nation's Influencer program and receive a monthly fee for using their TradingView charts in my analysis.

GBPUSD: Move Up Ahead!The GBPUSD pair is poised for further gains after successfully breaking above a key resistance line of a falling wedge pattern.
This breakout occurred during a retest of a recently breached daily/intraday structure, indicating strong bullish momentum.
Traders are now targeting a price level of 1.3558, suggesting continued upward potential in the near term.

Potential GBP/USD Short Trade from Double Top ResistanceThis GBP/USD chart displays a bearish setup following a double top pattern near the upper trendline of an ascending channel. Price failed to break above resistance and has begun reversing, indicating potential downside momentum. The Ichimoku Cloud shows weakening bullish pressure as price starts to dip below the cloud. Key support levels have been highlighted where price may react. A break below the lower boundary of the channel and the cloud could confirm a bearish continuation. Volume and structure suggest sellers gaining control, making this setup favourable for a short position based on technical confluence and potential trend reversal.
Entry: 1.35850
Target 1: 1.35460
Target 2: 1.35030
If you found this analysis helpful, don’t forget to drop a like and comment. Your support keeps quality ideas flowing—let’s grow and win together! 💪📈

GBP/USD: Ttrading Plan for the U.S Session Sell Below 1.3591In my morning forecast. I focused on the 1.3536 level and planned to make trading decisions based on it. Let's take a look at the 5-minute chart and see what happened. A rise and formation of a false breakout around 1.3536.
On Tuesday, the GBP/USD currency pair also showed a downward movement, although the decline and the day's volatility were relatively weak. Once again, the market effectively ignored the macroeconomic background, The minimal reaction from traders was prompted by the jolts report in the U.S., which showed job openings exceeding forecasts, leading to a slight strengthening of the dollar.
Overall, everything remains the same. If the British pound falls, it does so very weakly and for a short time. Whenever there's too much, "chaos," and the dollar grows longer than expected, Trump steps in and puts everything back in its place. Thus, expecting a sustained rise in the dollar remains extremely difficult. Technically, The pair remains above the indicator lines, so the uptrend is intact despite the price breaking out of the ascending channel.
As the global trade war situation continues to worsen, the dollar lacks medium-term growth prospects. For the market, the trade war factor is currently the only thing that matters; practically all other factors are being ignored.

Lingrid | GBPUSD Range-Bound Action with Upside Bias Toward 1.36The price perfectly fulfilled my previous idea . FX:GBPUSD FX:GBPUSD formed a higher low at trendline support and recently broke above the descending trendline, signaling bullish intent. Price is now consolidating in a range just above the swap zone around 1.3500. If it holds this structure, a breakout could lift the pair toward the 1.3580 resistance area.
📈 Key Levels
Buy zone: 1.3490–1.3500
Buy trigger: breakout from range top
Target: 1.3580
Sell trigger: close below 1.3490
💡 Risks
Failure to hold above the breakout zone
Bearish pressure from resistance at 1.3580
Return to range could delay upside move
Traders, if you liked this idea or if you have your own opinion about it, write in the comments. I will be glad 👩💻

GBP/USD Is This the Last Dip Before 1.37?🔹 1. Price Action & Technical Structure (Weekly & Daily Charts)
Price has broken above the ascending channel highlighted on the weekly chart.
The 1.3545 area is currently acting as dynamic resistance — a weekly close above it is crucial to confirm a breakout.
Below, we find a bullish order block (demand zone) around 1.3340 – 1.3280, aligning with the 0.5 Fibonacci level.
RSI is neutral, showing no bearish divergence at the moment.
🔹 2. COT Report (Commitment of Traders)
USD Index:
Non-commercial traders: +823 new longs, +363 new shorts → Neutral to bullish positioning.
Commercials remain net short, indicating short-term USD strength potential.
EUR FX (inverse proxy for USD):
Significant reduction in speculative long positions → Less bullish pressure on the Euro, favoring USD strength.
🔹 3. Sentiment
67% of retail traders are short GBP/USD vs. 33% long.
This is a bullish contrarian signal, suggesting potential continuation toward the 1.36–1.37 zone.
🔹 4. Seasonality
Historically, June tends to be bearish for GBP/USD over the past 5–10 years.
However, the first 10 days of the month often start with bullish momentum before correcting in the second half.
🔹 5. Economic Calendar
Today: Construction PMI (GBP), ECB Press Conference (EUR), Unemployment Claims (USD).
Tomorrow: High potential volatility across all USD pairs.
Watch out — upcoming macro data may strongly impact breakout confirmation.
🔹 6. Operational Outlook
Primary Bias: Neutral/Bullish with potential for a technical pullback.
📍 Key Levels:
Resistance: 1.3545 – 1.3593 (Supply zone + 0.0 fib)
Support: 1.3340 – 1.3280 (OB + 0.5/0.618 fib)
🧠 Scenario 1 – Bullish Continuation:
Retest of 1.3340 → long targeting 1.3590 / 1.3680
Confirmation on daily close above 1.3550
🔻 Scenario 2 – Bearish Retracement:
Rejection below 1.3550 + USD macro strength → drop toward 1.3280
If that breaks → extended move to 1.3170 / 1.3150

GBP/USD : Ready for Fall (READ THE CAPTION)By examining the GBP/USD chart on the 4-hour timeframe, we can see that the price is currently trading within the 1.35 supply zone. If a strong rejection occurs from this level, we can expect further downside movement. The potential bearish targets are 1.34915 and 1.34500. Other key supply zones are located at 1.35520, 1.35730, and 1.35930.
Please support me with your likes and comments to motivate me to share more analysis with you and share your opinion about the possible trend of this chart with me !
Best Regards , Arman Shaban

GBPUSD SHORT/SELL 1:3.5Reason for selling:
* Break of structure
* B wave of corrective structure forming
* Expanding flat forming
* MACD divergence
* Liquidity under 1.33860
Strategy to use: FIB retracement on 50/61.8
Engulfing candle to the downside
Entry: 1.35616
Stop Loss: 1.36155
Take Profit: 1.33875

GBPUSD Analysis Today: Technical and Order Flow !In this video I will be sharing my GBPUSD analysis today, by providing my complete technical and order flow analysis, so you can watch it to possibly improve your forex trading skillset. The video is structured in 3 parts, first I will be performing my complete technical analysis, then I will be moving to the COT data analysis, so how the big payers in market are moving their orders, and to do this I will be using my customized proprietary software and then I will be putting together these two different types of analysis.

GBPUSD Potential UpsidesHey Traders, in today's trading session we are monitoring GBPUSD for a buying opportunity around 1.35400 zone, GBPUSD is trading in an uptrend and currently is in a correction phase in which it is approaching the trend at 1.35400 support and resistance area.
Trade safe, Joe.

GBPUSD: Liquidity Grab & Bearish SentimentThe 📉GBPUSD pair fall below a significant support cluster on the 4-hour chart.
Following this breakout, the previous support has now become a solid resistance level, which is currently being retested.
I observed a confirmed liquidity grab along with a bearish imbalance candle.
There is a strong likelihood that the price will decline to at least 1.3502.

GBPUSD COT and Liquidity AnalysisHey what up traders welcome to the COT data and Liquidity report. It's always good to go with those who move the market here is what I see in their cards. I share my COT - order flow views every weekend.
🎯 Goal of this ideas is track order flow.
📍Please be aware that institutions report data to the SEC on Tuesdays and data are reported on Fridays - so again we as retail traders have disadvantage, but there is possibility to read between the lines. Remember in the report is what they want you to see, that's why mostly price reverse on Wednesday after the report so their cards are hidden as long as possible. However if the trend is running you can read it and use for your advantage.
💊 Tip
if the level has confluence with the high volume on COT it can be strong support / Resistance.
👍 Hit like if you find this analysis helpful, and don't hesitate to comment with your opinions, charts or any questions.
Analysis done on the Tradenation Charts
Disclosure: I am part of Trade Nation's Influencer program and receive a monthly fee for using their TradingView charts in my analysis.
"Adapt what is useful, reject what is useless, and add what is specifically your own."
— David Perk aka Dave FX Hunter ⚔️

BULLISH GUPrice has broken Key Resistance & Retested.
Entry was after the Bullish Engulfing on the 1HR/Fib Retracement Zone/Break and Retest of Key Support
TP 1 - 1.35555 | 1st Resistance
TP 2 - 1.35816 | -27 Extension
TP 3 - 1.36138 | -61.8 Extension

GBPUSD SELL📉 Trade Setup Alert – GBP/USD
Get ready to SELL GBP/USD 🔻
We're waiting for price to hit our sensitive zone before entering the trade.
🎯 Zone of Sensitivity: Watch closely for price reaction
📌 Action: Sell after confirmation
🛑 Risk Management: Set stop-loss just above the zone
💡 Tip: Wait for bearish confirmation (e.g. candlestick patterns, trend rejection)
Patience pays — let the market come to you.
GBP-USD Local Long! Buy!
Hello,Traders!
GBP-USD made a bearish
Breakout of the rising support
So we are bearish biased mid-term
But locally the pair will soon
Hit a horizontal support
So we will be expecting a
Rebound and a local move up
Buy!
Comment and subscribe to help us grow!
Check out other forecasts below too!
Disclosure: I am part of Trade Nation's Influencer program and receive a monthly fee for using their TradingView charts in my analysis.

GBPUSD Trading Analysis ### 1. Overall Trend & Market Context
- Bullish Momentum: GBPUSD is in a strong bullish trend, driven by DXY weakness (U.S. Dollar Index declining) and GBP strength. Key factors include:
- Fundamental Drivers:
- UK manufacturing contraction (less severe than expected) and rising housing prices.
- U.S. dollar weakness due to manufacturing slowdown (ISM PMI at 48.5), trade tensions, and fiscal concerns.
- Fed policy uncertainty (rates likely to remain unchanged post-May cut).
- Technical Drivers: Higher lows and higher highs on the 4-hour chart, indicating trend continuation.
### 2. Key Technical Levels & Patterns
- Support Zones:
- 1.3490–1.3500: A critical support area (pullback retracement, 61.8% Fibonacci level).
- 1.34420: Stop-loss level for long positions (below the liquidity pocket).
- Resistance Levels:
- 1.3580: Target for bullish breakout.
- 1.37370: Next major resistance (1:2 risk-reward setup).
- Patterns:
- Bullish Flag: Breakout above key resistance (1.3430) followed by consolidation.
- Broadening Wedge: High volatility pattern with widening highs/lows; potential for breakout (bullish or bearish).
- Bullish Engulfing: Confirmed entry after breaking key support/resistance.
### 3. Trading Opportunities
- Buy Zones:
- 1.3490–1.3500: Entry on breakout from consolidation range (1.3500).
- 1.35260: Buy limit for a liquidity hunt below minor intraday lows.
- Take Profit:
- 1.3580 (first resistance) and 1.37370 (measured move target).
- Risk Management:
- Stop-loss at 1.34420 (below support).
- 1:2 risk-reward ratio for long positions.
### 4. Key Risks & Considerations
- Bearish Scenarios:
- Failure to hold above the breakout zone (1.3500).
- Pressure from resistance at 1.3580.
- Return to consolidation range, delaying the upside move.
- Volatility: Broadening wedge patterns may fake out traders, emphasizing the need for strict risk management.
### 5. Fundamental Outlook
- GBP Strength: UK economic data (housing, manufacturing) supports GBP.
- USD Weakness: U.S. manufacturing slowdown, trade tensions, and fiscal concerns weigh on the dollar.
- Fed Policy: Markets expect rate cuts to continue, further pressuring USD.
### 6. Final Notes & Disclaimers
Stay disciplined, manage risk, and let the market confirm your trades. 📈
*Disclaimer: This is for educational purposes only. Trading involves risk; ensure you understand the risks before trading.*

EURUSD short term analysis in US sessionEURUSD is trading in the price range of 1.161 and 1.158. It is unlikely that there will be a breakout through this price range today. If the pair retreats slightly to 1.156, it is considered a good buy signal. Let's wait and see what the next short-term developments of EURUSD are.
I will send you the long term analysis of the pair tomorrow.

GBP/USD - Weekend analysis, a short opportunity
We begin the analysis on the 30 minute chart, we can see that a 5 point trendline has been broken on Friday, the end of the week. Price never recovered above the trendline by day end and is currently trending down as we can see from the new trendline connecting the closing prices of a few recent candles.
When we zoom in on the chart we can also see that the break of the trendline occurred on high volume, a key signal that we should respect this break and expect a potential significant move to follow.
We can also see on the RSI that price is below 50 which means downside momentum is still present. This is a good opportunity to get in on a short trade and place a stop loss above the trendline that was broken, aiming for a take profit that grants a 1:1.5 RR.

GBPUSD: Bearish Continuation is Expected! Here is Why:
The price of GBPUSD will most likely collapse soon enough, due to the supply beginning to exceed demand which we can see by looking at the chart of the pair.
Disclosure: I am part of Trade Nation's Influencer program and receive a monthly fee for using their TradingView charts in my analysis.
❤️ Please, support our work with like & comment! ❤️
