GBPUSD: Strong Sell Momentum Built Up! What is next?GBPUSD is building strong sell momentum, increasing sell volume. At the same time, DXY is in correction mode, so keep that in mind. If DXY plummets again, it may invalidate our first entry. However, there’s a second entry that could be a safer zone for those looking for a stable entry.
There are three take profit targets that can be set according to your trading plan. This analysis doesn’t guarantee that the price will move as described.
Good luck and trade safely!
Thank you for your unwavering support! 😊
If you’d like to contribute, here are a few ways you can help us:
- Like our ideas
- Comment on our ideas
- Share our ideas
Team Setupsfx_
❤️🚀
GBPUSD trade ideas

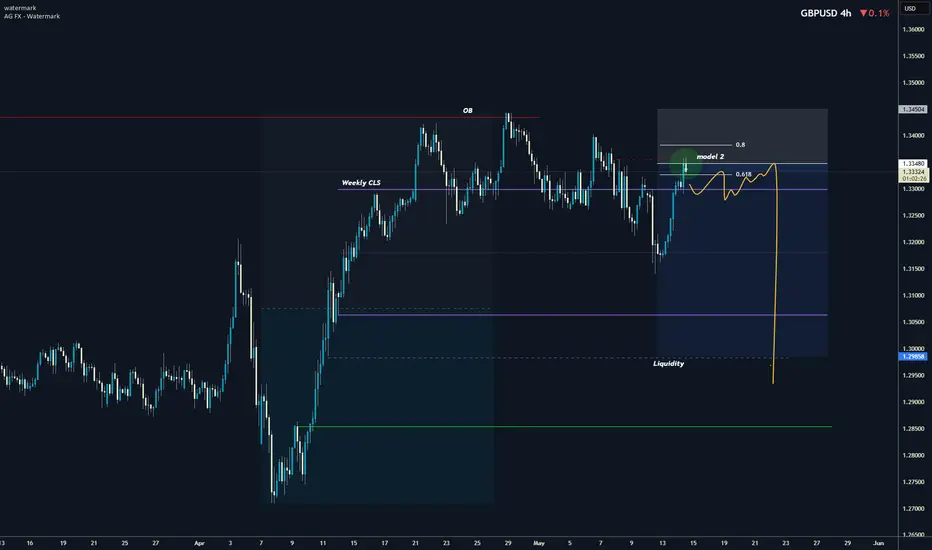
GBPUSD I Weekly CLS I Model 2 Target opposing rangeHey, Market Warriors, here is another outlook on this instrument
If you’ve been following me, you already know every setup you see is built around a CLS range, a Key Level, Liquidity and a specific execution model.
If you haven't followed me yet, start now.
My trading system is completely mechanical — designed to remove emotions, opinions, and impulsive decisions. No messy diagonal lines. No random drawings. Just clarity, structure, and execution.
🧩 What is CLS?
CLS is real smart money — the combined power of major investment banks and central banks moving over 6.5 trillion dollars a day. Understanding their operations is key to markets.
snapshot
✅ Understanding the behaviour of CLS allows you to position yourself with the giants during the market manipulations — leading to buying lows and selling highs - cleaner entries, clearer exits, and consistent profits.
snapshot
🛡️ Models 1 and 2:
From my posts, you can learn two core execution models.
They are the backbone of how I trade and how my students are trained.
📍Model 1
is right after the manipulation of the CLS candle when CIOD occurs, and we are targeting 50% of the CLS range. H4 CLS ranges supported by HTF go straight to the opposing range.
snapshot
📍Model 2
occurs in the specific market sequence when CLS smart money needs to re-accumulate more positions, and we are looking to find a key level around 61.8 fib retracement and target the opposing side of the range.
snapshot
👍 Hit like if you find this analysis helpful, and don't hesitate to comment with your opinions, charts or any questions.
⚔️ Listen Carefully:
Analysis is not trading. Right now, this platform is full of gurus" trying to sell you dreams based on analysis with arrows while they don't even have the skill to trade themselves.
If you’re ever thinking about buying a Trading Course or Signals from anyone. Always demand a verified track record. It takes less than five minutes to connect 3rd third-party verification tool and link to the widget to his signature.
"Adapt what is useful, reject what is useless, and add what is specifically your own."
— David Perk aka Dave FX Hunter ⚔️
GBP/USD - Triangle Breakout (16.05.2025)The GBP/USD pair on the M30 timeframe presents a Potential Buying Opportunity due to a recent Formation of a Triangle Breakout Pattern. This suggests a shift in momentum towards the upside and a higher likelihood of further advances in the coming hours.
Possible Long Trade:
Entry: Consider Entering A Long Position around Trendline Of The Pattern.
Target Levels:
1st Resistance – 1.3389
2nd Resistance – 1.3441
🎁 Please hit the like button and
🎁 Leave a comment to support for My Post !
Your likes and comments are incredibly motivating and will encourage me to share more analysis with you.
Best Regards, KABHI_TA_TRADING
Thank you.

GBPUSD: Bearish Head & Shoulders Pattern + TriangleGBPUSD: Bearish Head & Shoulders Pattern + Triangle
Yesterday GBPUSD declined nearly -1.23% during the opening of the London Market. This was accopanied by the news that the US Reached a good deal with China related to tariffs.
This news was made public by the White House.
Both countries will suspend tariffs for an initial period of 90 days.
The U.S. will cut extra tariffs it imposed on Chinese imports in April this year to 30% from 145% and Chinese duties on U.S. imports will fall to 10% from 125%, the two sides said on Monday. The new measures are effective for 90 days.
This news supported USD strength on the short term and GBPUSD declined from 160 pips from 1.3300 to 1.3140
Technical Analysis:
The bearish movement confirmed the breakout from the bearish Triangle pattern and from the Head and shoulder pattern we can see on the chart. A possible pause is expected after this moment given that we don't have strong reasons to see a more aggressive decline.
However the bearish movement may condinue during the week following new developments from the tariffs front related to the other countries.
Targets: 1.3100 ; 1.3000 and 1.2900 are very strong structure zones dating back also on the past.
You may find more details in the chart!
Thank you and Good Luck!
❤️PS: Please support with a like or comment if you find this analysis useful for your trading day❤️
Disclosure: I am part of Trade Nation's Influencer program and receive a monthly fee for using their TradingView charts in my analysis.

Lingrid | GBPUSD retest the RESISTANCE zone and FALLFX:GBPUSD price is approaching the confluence of the red resistance trendline and the $1.334 level after an extended climb along the upward trendline. Despite short-term bullish momentum, this zone has acted as a strong barrier in the past. A rejection here could signal the start of a local correction toward $1.325 or lower.
📌 Key Levels
Support: $1.32540
Resistance: $1.33413
Reversal Zone: Red trendline near $1.334
⚠️ Risks
Breakout above $1.334 could invalidate the reversal setup
Momentum remains bullish above the blue trendline
Failure to reject the red trendline may shift bias to breakout continuation
Traders, if you liked this idea or if you have your own opinion about it, write in the comments. I will be glad 👩💻

GBP/USD Set for a Big Move! Will It Break the Channel or Reboun📈 GBP/USD DAILY PLAN – 12/05/2025
🔍 Technical Overview:
The GBP/USD pair is currently consolidating in a descending channel, with clear resistance and support levels. After forming a short-term high at 1.32507, the price is showing signs of retracing and looks set to continue the downward move.
Key Resistance Levels:
1.32507: The latest high, still unbroken. This is a key resistance level in the short term.
1.31690: The next resistance level, which could provide bearish momentum as the price touches it.
1.31417: A strong resistance level if the price continues to rise.
Key Support Levels:
1.32474: A strong support zone, likely to be tested if the price dips.
1.32169: A short-term support level for potential reversal.
1.31216: A key support level in case of a sharp decline, potentially a strong BUY zone.
🎯 Trade Scenarios:
1. Bearish Breakout Scenario:
SELL Zone: 1.32507 – 1.31690
Stop Loss (SL): 1.3300
Take Profit (TP): 1.31417 → 1.31000 → 1.30500
2. PullbackScenario – Reversal at Support:
BUY Zone: 1.31216 – 1.31417
Stop Loss (SL): 1.31000
Take Profit (TP): 1.31800 → 1.32100 → 1.32400
⚠️ Notes:
Market Sentiment: The market is highly sensitive to ongoing political and economic developments, especially comments from ECB and Fed officials. Watch the key support and resistance levels carefully before making any trades today.
Risk Management: Be sure to manage your SL/TP levels carefully and avoid chasing signals during volatile market moves.
📣 Important:
Today is a key day with important macroeconomic data that could shift market sentiment, particularly from Fed officials and trade talks. Be cautious and wait for confirmation signals before entering any trades.

GBPUSD:Sharing of the Trading Strategy for Next WeekAll the trading signals this week have resulted in profits!!! Check it!!!👉👉👉
From a technical perspective: Analysis shows that if GBP/USD can hold the key support levels of 1.3300 and 1.3245, it is expected to rebound and challenge the previous high of 1.3445. If it breaks below 1.3240, it will constitute a reversal signal and is likely to accelerate the pullback. In terms of news: The UK economic data performs well, and the labor market is tight, supporting the maintenance of high inflation in the UK, which strengthens the market's expectation that the Bank of England will raise interest rates again within this year. This provides certain support for the British pound. In terms of trading operations, one can open a long position with a small position near 1.3300, with the target set at 1.3445.
Trading Strategy:
buy@1.3246-1.3300
TP:1.3390-1.3445
The signals in the Signature have brought about continuous profits, and accurate signals are shared every day. Hurry up and click to get them!
👇 👇 👇 Obtain signals👉👉👉

GBP-USD Bearish Breakout! Sell!
Hello,Traders!
GBP-USD made a bearish
Breakout of the key horizontal
Level around 1.3232 and the
Breakout is confirmed so we
Will be expecting a further
Bearish move down
Sell!
Comment and subscribe to help us grow!
Check out other forecasts below too!
Disclosure: I am part of Trade Nation's Influencer program and receive a monthly fee for using their TradingView charts in my analysis.

Lingrid | GBPUSD bearish PRESSURE. Potential ShortFX:GBPUSD remains within a clear downward channel, printing lower highs and lower lows amid persistent bearish momentum. After breaking support, price briefly rebounded from the channel’s lower boundary, but selling pressure is likely to resume unless structure breaks. A failed rally and rejection near 1.32677 may confirm another leg down toward 1.31850.
📌 Key Levels
Support zone: 1.31850 (channel base and historical low)
Breakout target: 1.33385 (downward trendline resistance)
Invalidation level: Above 1.33385 (would shift structure to bullish)
⚠️ Risks
Continued bearish pressure may breach current support
Fake-outs around the lower boundary could mislead short-term setups
Consolidation inside the channel could delay a decisive move
Traders, if you liked this idea or if you have your own opinion about it, write in the comments. I will be glad 👩💻

GBP/USD..4h chart pattern..**GBP/USD Sell Trade Plan** based on My levels:
### **Trade Setup**
- **Entry:** **1.33000** (Sell Limit or Market Order if price reaches)
- **Stop Loss (SL):** **1.34500** (150 pips risk)
- **Take Profit 1 (TP1):** **1.27000** (600 pips gain)
- **Take Profit 2 (TP2):** **1.25000** (800 pips gain)
### **Risk-Reward Ratio**
- **TP1:** **1:4** (600 pips gain / 150 pips risk)
- **TP2:** **1:5.3** (800 pips gain / 150 pips risk)
### **Key Considerations**
1. **Technical Confirmation Needed:**
- Check if GBP/USD is rejecting **1.33000** (resistance) with a bearish candlestick pattern (e.g., pin bar, engulfing).
- Look for RSI/MACD divergence or downtrend confirmation.
2. **Support Levels to Watch:**
- **1.30000** (Major psychological support)
- **1.28500-1.28000** (Previous swing lows)
3. **Fundamental Risks:**
- **UK Economic Data (CPI, BoE Rate Decisions)** – Hawkish BoE could strengthen GBP.
- **US Dollar Weakness (Fed Rate Cuts?)** – Dovish Fed could weaken USD, pushing GBP/USD higher.
4. **Trade Management Tips:**
- **Partial Close at TP1 (1.27000)** – Secure 600 pips profit.
- **Move SL to Breakeven** – Once price moves favorably (e.g., below 1.31000).
- **Trailing Stop for TP2** – If trend remains bearish, consider trailing stop to maximize gains.
### **Final Verdict**
- **High-Reward, But High Risk** – 150-pip SL is tight if volatility spikes.
- **Wait for Bearish Confirmation** – Avoid selling into a ranging or bullish market.
Would you like a **chart analysis** or an update on GBP/USD fundamentals before executing?

GBPUSD SHORTPrice took me out last week but looks like it was a liquidity grab, Now reacting to what the market is showing me;
Market structure bearish on HTFs DW
Entry at both Weekly And Daily AOi
Weekly Rejection at AOi
Daily Rejection at AOi
Daily Previous Structure Point
Around Psychological Level 1.33500
H4 EMA retest
H4 Candlestick rejection
Rejection from Previous structure
Levels 4.43
Entry 100%
REMEMBER : Trading is a Game Of Probability
: Manage Your Risk
: Be Patient
: Every Moment Is Unique
: Rinse, Wash, Repeat!
: Christ is King.

GBPUSD: Bearish Move Confirmed?! 🇬🇧🇺🇸
GBPUSD looks bearish after a release of UK GDP this morning.
I see a strong bearish imbalance after a test of a key horizontal resistance
and a confirmed Change of Character CHoCH as a confirmation.
I expect a bearish continuation at least to 1.3224
❤️Please, support my work with like, thank you!❤️
I am part of Trade Nation's Influencer program and receive a monthly fee for using their TradingView charts in my analysis.

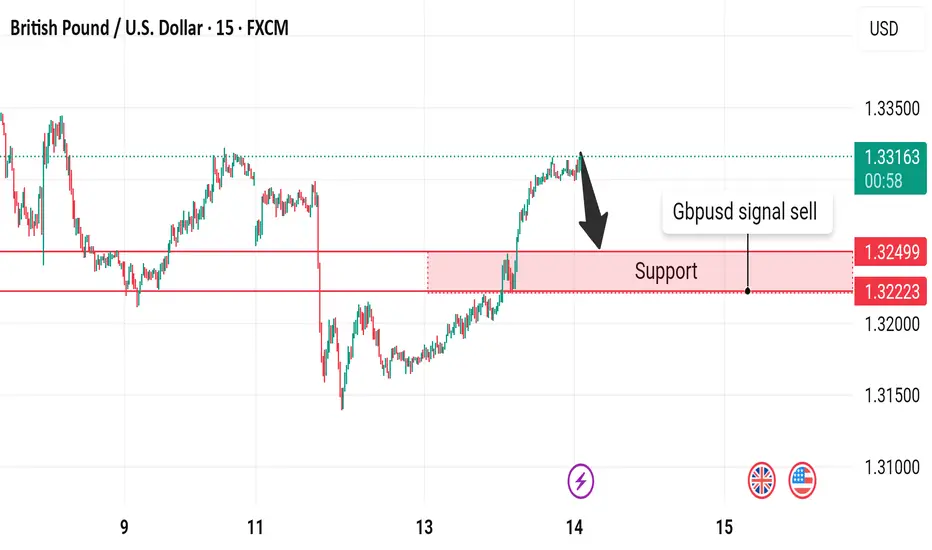
GBPUSD SELL OPPORTUNITYWatch a detailed analysis on GBPUSD PAIR we made a top down analyisis and we anticipate a sell opportunity on this asset. Take advantage of this opportunity!

Gbpusd signal sell GBP/USD caught a bid on Tuesday, rebounding above the 1.3300 handle and reversing early week losses as global markets tilt and twist around general Greenback flows based on broad-market sentiment. UK labor figures barely moved the needle, and market reaction to US Consumer Price Index inflation was likewise muted.
GBPUSD Sell Analysis/IdeaThis trade is based on the Daily and 4-hour charts and executed based on reversal trading and trend formation. Better explanation in the video!

GBP/USD..1h chart pattern..### **GBP/USD Short Trade Idea**
**🎯 Pattern:** Head-and-Shoulders (H&S) confirmed by:
- **Price Action:** Neckline retest at **1.3260** (Key Support → Resistance if broken).
- **MACD:** Bearish crossover below **0-line** (Momentum shift).
**⚡ Entry:** Sell on **daily/4H close below 1.3260** (Avoid fakeouts).
**✋ Stop Loss:** **1.3320** (Above recent swing high).
**✅ Take Profit:** **1.3160** (1:2 R/R).
**❗ Critical Filter:** Wait for **MACD to fully cross 0-line** + **strong bearish candle** (e.g., engulfing).
---
### **Why This Works**
1. **H&S Target:** Measured move from head (1.3300+) projects ~100 pips to **1.3160**.
2. **MACD Confirmation:** Cross below 0-line signals bearish regime.
### **If Wrong?**
- Price reclaims **1.3300** → Invalidates H&S (false breakdown).
**Optional:** Add a **breakeven stop** at 1.3220 after 50 pips down.
---
Let me know if you want adjustments (e.g., shorter timeframes, confluences like RSI divergence).

GBP/USD Short Trade Setup – Targeting 1.31580 from 1.34281Entry Point: 1.34281
Stop Loss: 1.34554 (about 27 pips above entry)
Target Points:
Target One: 1.32698
Final Target (EA Target Point): 1.31580 (approx. 270 pips from entry)
Risk/Reward Ratio: Favorable, given the tight stop and wider target.
📈 Chart Features
Highlighted Zones:
Resistance Zone (top purple area): A strong supply zone, where price reversed multiple times.
Support Zone (bottom purple area): Historical demand zone, previous price reactions.
Orange Circles: Represent key swing highs and lows (likely used to confirm the zones or a double/triple top/bottom pattern).
Moving Averages:
Red Line: Likely a shorter-period MA (e.g., 20 EMA).
Blue Line: Likely a longer-period MA (e.g., 50 or 200 EMA), often used for trend confirmation.
🧠 Interpretation
Price Action: The chart suggests the price recently hit a resistance zone and is expected to reverse.
Trade Bias: Bearish – expecting the market to drop from the resistance.
Indicators Support:
Price has rejected multiple times at the top.
Entry is slightly below resistance, confirming a potential reversal.
Targets align with support and past consolidation zones.

GBP/USD Bulls Are Back? Institutions Are Loading Up1. Price Action & Zone Mapping
GBP/USD is consolidating above 1.3300 after a strong bullish reaction near the demand zone between 1.3040 and 1.3150 — an area that has already rejected price twice in recent months.
While the market structure still shows lower highs, the weekly candlestick formation signals a clear loss of bearish momentum. On the upside, the 1.3500–1.3600 zone remains the key supply area to break for a structural reversal to be confirmed.
2. COT Report – Institutional Positioning (as of May 6, 2025)
Non-Commercials (speculators) added +3,320 long positions and reduced -1,956 shorts, bringing the net long to +7,683 contracts — a strong bullish signal.
Commercials remain net short, but not with increasing aggression.
👉 The net positioning supports continued bullish bias, aligned with the recent technical rebound.
3. USD Index – Opposite Positioning
Non-Commercials increased both longs and shorts slightly on the US Dollar Index, but net positioning remains neutral with a slight bearish tilt.
This suggests a phase of indecision or mild retracement in the dollar, which indirectly supports GBP/USD upside.
4. GBP/USD Seasonality – Historical Behavior in May
According to MarketBulls data, May tends to be neutral-to-weak for the pair:
15-year avg: +0.0023
5-year avg: -0.016
2-year avg: +0.0069
Overall, this supports a ranging or corrective phase — not a high-conviction trending month. A breakout may need more confirmation.
5. Retail Sentiment
Currently, 60% of retail traders are short GBP/USD, with an average price of 1.2959, while only 40% are long from 1.3337.
👉 This imbalance favors a contrarian bullish narrative, especially if the market decides to run stops below 1.3300.
✅ Operational Outlook
GBP/USD is showing bullish consolidation signs, backed by:
Increasing institutional long interest
Contrarian retail sentiment (potential fuel for rallies)
Solid demand near 1.3040–1.3150
However, neutral seasonality and lack of structural breakout advise caution. A pullback towards 1.3200–1.3150 might come before any further upside move toward 1.3500.
🔍 Preferred Play: Wait for a retest of 1.3150 with price action confirmation before entering long. A strong breakout above 1.3350 would be early confirmation of renewed bullish pressure.

GBPUSD LIVE TRADE AND EDUCATIONAL BREAKDOWN FOR BEGINNERS 218PIPGBP/USD holds recovery gains near 1.3350 as US Dollar loses further ground
GBP/USD is trading near 1.3350 in Wednesday’s European session, extending Tuesday's 1% rally. The pair capitalizes on renewed US Dollar sell-off even as risk sentiment turns negative. Fedspeak and trade talks remain in focus.

GBPUSD ANALYSISThe weekly candle rejected weekly resistance and closed as a doji for consecutive weeks, which could mean price could be transitioning to a bearish market. Overall price is still bullish, but it did form an H4 LH so I'd look for price to retrace to the H4 support. If price breaks & retest minor M15 support around 1.32970, I'd start looking for sells with my TP being 1.32100.

CABLE will dump Cable long term idea: we can probabily and mabe very likely see cable dump and no need to retrade into PMH!

Correction It is expected that the correction will form to the specified support levels and then we will see the start of the upward trend. Otherwise, the correction will continue to the next support level.

