GBPUSD may correct after false breakout The currency pair has overcome a huge 0.8% or 110 points since the opening of the session, having wasted all the potential and is trying to test the resistance. The potential for breakout and continuation of growth may not be enough and the price may make a false breakout and correction before the second impulse to the intermediate high, where the scenario with correction may be repeated
Scenario: Breakout of 1.3402. No possibility to continue growth, return under the level and consolidation below the level - further sales.
It is possible that the price will consolidate above 1.34 and will head towards the far, strong level of 1.34425 from which a false breakout and correction can also be considered.
GBPUSD trade ideas

GBP/USD - Triangle Breakout (16.05.2025)The GBP/USD pair on the M30 timeframe presents a Potential Buying Opportunity due to a recent Formation of a Triangle Breakout Pattern. This suggests a shift in momentum towards the upside and a higher likelihood of further advances in the coming hours.
Possible Long Trade:
Entry: Consider Entering A Long Position around Trendline Of The Pattern.
Target Levels:
1st Resistance – 1.3389
2nd Resistance – 1.3441
🎁 Please hit the like button and
🎁 Leave a comment to support for My Post !
Your likes and comments are incredibly motivating and will encourage me to share more analysis with you.
Best Regards, KABHI_TA_TRADING
Thank you.

Lingrid | GBPUSD retest the RESISTANCE zone and FALLFX:GBPUSD price is approaching the confluence of the red resistance trendline and the $1.334 level after an extended climb along the upward trendline. Despite short-term bullish momentum, this zone has acted as a strong barrier in the past. A rejection here could signal the start of a local correction toward $1.325 or lower.
📌 Key Levels
Support: $1.32540
Resistance: $1.33413
Reversal Zone: Red trendline near $1.334
⚠️ Risks
Breakout above $1.334 could invalidate the reversal setup
Momentum remains bullish above the blue trendline
Failure to reject the red trendline may shift bias to breakout continuation
Traders, if you liked this idea or if you have your own opinion about it, write in the comments. I will be glad 👩💻

GBPUSD COT and Liquidity AnalysisCOT Report Analysis:
We can see 6K drop in the longs. closed on the Tuesday highs, if they want to take prices higher, they will build a poosition on the lower prices. Hence, I think we will see a bearish week.
Hey, what up traders, another week, another COT data and Liquidity report. This is a big part of my FX Trading. I'm always trying to trade with the Big players, so knowing their positions is a good thing.
📍Please be aware that institutions report data to the SEC on Tuesdays and data are reported on Fridays - so again, we as retail traders have a disadvantage, but there is the possibility to read between the lines. Remember, in the report is what they want you to see; that's why prices mostly reverse on Wednesday after the report, so their cards are hidden as long as possible. However, if the trend is running, you can read it and use it to your advantage.
📍Tip: If the level has confluence with the high volume on COT, it can be strong support / Resistance.
Analysis done on the Tradenation Charts
Disclosure: I am part of Trade Nation's Influencer program and receive a monthly fee for using their TradingView charts in my analysis.
"Adapt what is useful, reject what is useless, and add what is specifically your own."
Have a great trading week, see in the next report.
— David Perk aka Dave FX Hunter ⚔️

GBPUSD: Will DXY Bounce Back? |GBPUSD Swing Sell|The GBPUSD pair is currently rallying towards a potential selling zone, where sellers could push the price down. However, the main concern is the current state of the DXY, which clearly indicates another sell-off and could lead to another lower low. Please remember to use risk management while trading forex pairs.
There are three take-profit targets that can be set according to your trading plan. This analysis doesn’t guarantee that the price will move as described.
Good luck and trade safely!
Thank you for your unwavering support! 😊
If you’d like to contribute, here are a few ways you can help us:
- Like our ideas
- Comment on our ideas
- Share our ideas
Team Setupsfx_
❤️🚀

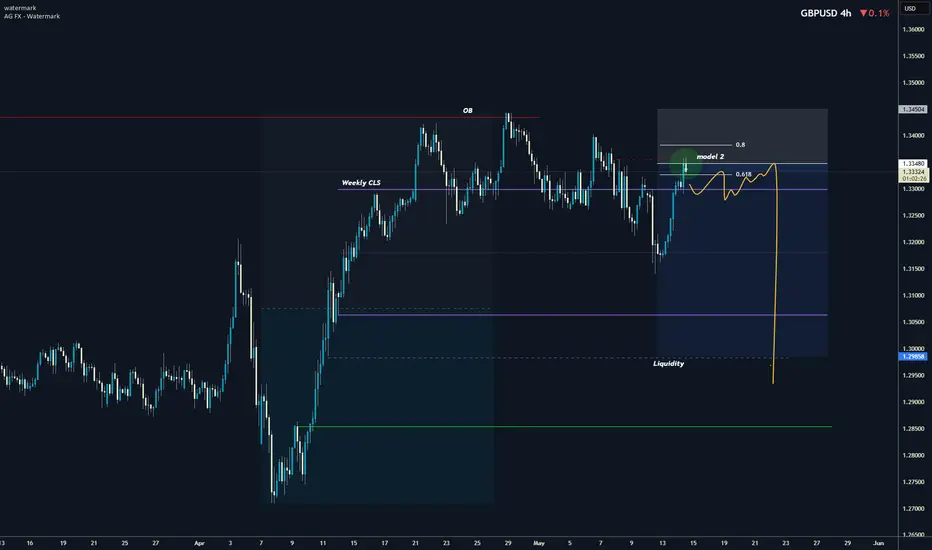
GBPUSD I Weekly CLS I Model 2 Target opposing rangeHey, Market Warriors, here is another outlook on this instrument
If you’ve been following me, you already know every setup you see is built around a CLS range, a Key Level, Liquidity and a specific execution model.
If you haven't followed me yet, start now.
My trading system is completely mechanical — designed to remove emotions, opinions, and impulsive decisions. No messy diagonal lines. No random drawings. Just clarity, structure, and execution.
🧩 What is CLS?
CLS is real smart money — the combined power of major investment banks and central banks moving over 6.5 trillion dollars a day. Understanding their operations is key to markets.
snapshot
✅ Understanding the behaviour of CLS allows you to position yourself with the giants during the market manipulations — leading to buying lows and selling highs - cleaner entries, clearer exits, and consistent profits.
snapshot
🛡️ Models 1 and 2:
From my posts, you can learn two core execution models.
They are the backbone of how I trade and how my students are trained.
📍Model 1
is right after the manipulation of the CLS candle when CIOD occurs, and we are targeting 50% of the CLS range. H4 CLS ranges supported by HTF go straight to the opposing range.
snapshot
📍Model 2
occurs in the specific market sequence when CLS smart money needs to re-accumulate more positions, and we are looking to find a key level around 61.8 fib retracement and target the opposing side of the range.
snapshot
👍 Hit like if you find this analysis helpful, and don't hesitate to comment with your opinions, charts or any questions.
⚔️ Listen Carefully:
Analysis is not trading. Right now, this platform is full of gurus" trying to sell you dreams based on analysis with arrows while they don't even have the skill to trade themselves.
If you’re ever thinking about buying a Trading Course or Signals from anyone. Always demand a verified track record. It takes less than five minutes to connect 3rd third-party verification tool and link to the widget to his signature.
"Adapt what is useful, reject what is useless, and add what is specifically your own."
— David Perk aka Dave FX Hunter ⚔️
GBP/USD About to Explode?GBP/USD is currently trading around the 1.3360–1.3380 zone after testing the key weekly resistance area between 1.3400 and 1.3450. The bullish momentum remains strong, supported by speculative positioning still favoring the pound, while the dollar shows signs of softening. On the macro side, the interest rate differential between the UK and the US may narrow in the coming months, but for now, it continues to support upward pressure on the pair.
From a technical standpoint, price has broken out of an ascending triangle on the daily chart, showing strong momentum and confirmation with multiple closes above 1.3300. Market sentiment remains skewed to the short side, adding contrarian fuel to the bullish bias. The key short-term support lies between 1.3270 and 1.3300. As long as this area holds, the base case favors a continuation toward 1.3520 and potentially 1.3600. A break below 1.3170 would invalidate the current bullish structure and open the door for a deeper pullback toward 1.3000.
From an execution standpoint, a confirmed breakout above 1.3415 could offer a long entry opportunity with active management. Still, caution is advised around the weekly supply zone due to its historical responsiveness. Eyes remain on upcoming macro data and potential volatility from central bank statements.

GBP/USD - Triangle Breakout (23.05.2025)The GBP/USD pair on the M30 timeframe presents a Potential Buying Opportunity due to a recent Formation of a Triangle Pattern. This suggests a shift in momentum towards the upside and a higher likelihood of further advances in the coming hours.
Possible Long Trade:
Entry: Consider Entering A Long Position around Trendline Of The Pattern.
Target Levels:
1st Resistance – 1.3502
2nd Resistance – 1.3534
🎁 Please hit the like button and
🎁 Leave a comment to support for My Post !
Your likes and comments are incredibly motivating and will encourage me to share more analysis with you.
Best Regards, KABHI_TA_TRADING
Thank you.
Disclosure: I am part of Trade Nation's Influencer program and receive a monthly fee for using their TradingView charts in my analysis.

GBP/USD Short Trade Setup – Targeting 1.31580 from 1.34281Entry Point: 1.34281
Stop Loss: 1.34554 (about 27 pips above entry)
Target Points:
Target One: 1.32698
Final Target (EA Target Point): 1.31580 (approx. 270 pips from entry)
Risk/Reward Ratio: Favorable, given the tight stop and wider target.
📈 Chart Features
Highlighted Zones:
Resistance Zone (top purple area): A strong supply zone, where price reversed multiple times.
Support Zone (bottom purple area): Historical demand zone, previous price reactions.
Orange Circles: Represent key swing highs and lows (likely used to confirm the zones or a double/triple top/bottom pattern).
Moving Averages:
Red Line: Likely a shorter-period MA (e.g., 20 EMA).
Blue Line: Likely a longer-period MA (e.g., 50 or 200 EMA), often used for trend confirmation.
🧠 Interpretation
Price Action: The chart suggests the price recently hit a resistance zone and is expected to reverse.
Trade Bias: Bearish – expecting the market to drop from the resistance.
Indicators Support:
Price has rejected multiple times at the top.
Entry is slightly below resistance, confirming a potential reversal.
Targets align with support and past consolidation zones.

GBPUSD Analysis – Bearish Setup Into Key ResistanceGBP/USD is trading into a key multi-week resistance zone between 1.3360 and 1.3413. The pair has failed to break this area multiple times, and current price action shows signs of compression and hesitation. With elevated UK inflation limiting BoE easing flexibility and renewed USD support following bond yield spikes, this setup offers a compelling bearish opportunity. Clean downside targets lie at 1.3177, 1.3016, and potentially 1.2890. The trade remains valid unless price breaks and holds above 1.3413.
🔍 Technical Analysis
Structure:
Price is testing a significant resistance zone (1.3360–1.3413) that’s held since early April.
Bearish trendline from May highs remains intact.
A descending structure is forming with lower highs and failed breakouts.
Support Levels to Watch:
1.3177 – Previous structure low
1.3016 – Strong horizontal support
1.2890 – March swing low and fib extension target
Confluence:
EUR/USD overlay shows rejection at similar highs, reinforcing risk-off dollar strength
Price failing to hold above fib retracement levels from prior swings
🌍 Fundamental Context
🇬🇧 British Pound (GBP):
UK inflation is climbing again (expected 3.0% CPI for April), delaying BoE's ability to cut further.
BoE’s Pill has pushed back on rapid easing, citing persistent service inflation.
UK-EU trade agreement provides medium-term support, but short-term upside appears priced in.
🇺🇸 U.S. Dollar (USD):
Despite Moody’s downgrade, U.S. yields are rising, supporting USD demand.
Trump’s tariff threats have injected global risk-off tones, lifting the dollar as a safe haven.
Fed remains cautious — no rate cuts expected soon.
🎯 Trade Setup
Bias: Bearish
Entry Zone: Near 1.3360–1.3413 resistance (wait for rejection candle confirmation)
Targets:
First: 1.3177
Second: 1.3016
Third: 1.2890
Invalidation: A daily close above 1.3413 would invalidate the bearish thesis
⚠️ Risk & Management Tips
Don’t short blindly into resistance — wait for strong wick or bearish engulfing candle.
Watch upcoming UK inflation data or Fed commentary for macro triggers.
Avoid over-leveraging: false breakouts near highs are common.
🧭 Conclusion
GBP/USD is coiling near a powerful resistance area. A confirmed rejection opens the door for a multi-leg downside move into 1.30 and below. As long as price holds beneath 1.3413, the risk-reward profile favors sellers. Patience and precision are key at this stage.

GBPUSDBuy. Market Execution. trade 1:2. riesgo 0.50%
I went into buying because the market is respecting the buyers' zone.


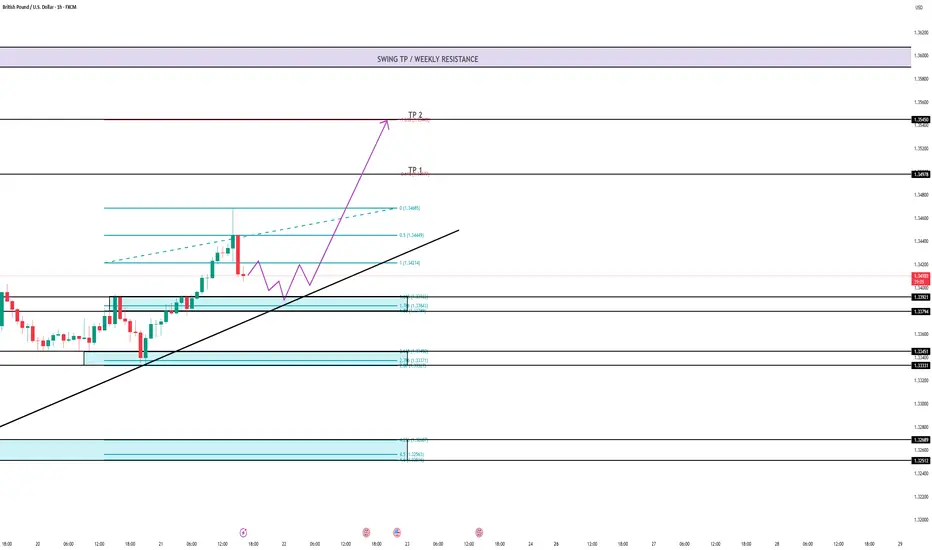
GU-Wed-21/05/25 TDA-GBP CPI higher than expected, Bullish!Analysis done directly on the chart
Follow for more, possible live trades update!
Risk management. You can take bad trades but
you can recover with good risk management.
The profitable strategy alone isn't enough to
succeed in this game.
Not financial advice, DYOR.
Market Flow Strategy
Mister Y


GBPUSD Possibilities To Make Big ShotHi traders,
Here The analysis for FX:GBPUSD im looking for. GBP CPI data already release 2 hours ago. It shows the strong data. The annual inflation rate in the UK jumped to 3.5% in April 2025, the highest since January 2024, from 2.6% in March and above forecasts of 3.3%.
Thus, im prepare for the oppurtuniti come after the data release. At the blue zone 1.33921 - 1.33794 is the best zone to execute. I will waiting in the zone and follow the SOP on lowest timeframe to ensure the best time to execute with quality of trade.
ZONE : 1.33921 - 1.33794
TP1 : 1.34980
TP2 : 1.35450
TP SWING : 1.36000
STOPLOSS : 1.33700
GBPUSD 4H Bearish OutlookGBPUSD Analysis
I don’t see any reason for an upside move here.
Price is expected to continue lower.
Bearish targets:
• 1.3226
• 1.3180
• 1.3153
Only a breakout and hold above 1.3293 will invalidate this analysis.

Current Trend Analysis and Trading Strategies for GBP/USDThe real-time trading signals we provided have been profitable every day. If you don't know how to get started, you can refer to my strategies. 👉🏼👉🏼👉🏼
On Wednesday, influenced by the UK's inflation data that exceeded expectations, the GBP/USD climbed to the 1.3400 zone, breaking through the peaks of 2024 and 2025 and reaching a three - year high of 1.3468. However, the gains were short - lived as traders took profits.
The weakening of the US dollar, along with the unexpected sharp rise in UK consumer prices in April, has increased the pressure on the central bank to reduce interest rate cuts or postpone easing policies, enhancing the attractiveness of the pound. Overall, the bullish structure is expected to be maintained.
Technically, the daily chart shows a fully bullish trend, but overbought conditions and resistance levels may cause bulls to consolidate. Pullbacks are likely to be limited, providing opportunities for long - positions to enter the market.
GBPUSD
buy@1.34000-1.34200
tp:1.34500-1.35000
Investment itself is not risky; it is only when investment is out of control that risks occur. When trading, always remember not to act on impulse. I will share trading signals every day. All the signals have been accurate without any mistakes for a whole month. No matter what gains or losses you've had in the past, with my help, you have the hope of achieving a breakthrough in your investment.👇🏽👇🏽👇🏽

GBPUSD: MACD Cross confirms more upsideGBPUSD is bullish on its 1D technical outlook (RSI = 59.696, MACD = 0.006, ADX = 36.278) as it's been inside a Channel Up since the start of the year (January 13th 2025 low). At the moment the 1D MA50 is holding and provides the short term support. The 1D MACD just formed a Bullish Cross, validating the new bullish wave. We are bullish, aiming for another +3.63% HH rise (TP = 1.3600).
See how our prior idea has worked out:
## If you like our free content follow our profile to get more daily ideas. ##
## Comments and likes are greatly appreciated. ##

GBPUSD Trade Plan (GBPUSD Daily - 18/05)Pound index is showing signs of some easing from the bulls following return to previous highs from Sept 2024.
Price is still in an up trend, so the plan is to wait for the next opportunity higher, but for that I want a cheaper price.
Dollar is showing signs of recovering so lets hold for fib levels and check support levels. Ideally we want a breakout but I don't think its now.

Sell area gbpusd Deep selling structure currently just respecting the higher high but still not break
Wait to break it and sweep high then enter into sell with a strong confirmation
It's preparing itself to change the trend

GBPUSD: Bearish Move Confirmed?! 🇬🇧🇺🇸
GBPUSD looks bearish after a release of UK GDP this morning.
I see a strong bearish imbalance after a test of a key horizontal resistance
and a confirmed Change of Character CHoCH as a confirmation.
I expect a bearish continuation at least to 1.3224
❤️Please, support my work with like, thank you!❤️
I am part of Trade Nation's Influencer program and receive a monthly fee for using their TradingView charts in my analysis.

GBP/USD 1HOUR BEARISH I'm providing here (GBP/USD, 1-hour timeframe)
Pattern Observation:
The price tested a resistance zone around 1.33400 – 1.33550 multiple times (triple top).
A potential bearish move is forecasted, as indicated by the drawn black and blue arrows.
Ichimoku Cloud shows bearish pressure (price is under the cloud).
Suggested Trade Setup:
Trade Type: Sell (Short)
Entry Point:
Around current price: 1.32800–1.32900
Take Profit (TP) Levels:
TP1: 1.32000 (recent support area)
TP2: 1.31580 (target marked on the chart)
TP3: 1.30800 (next key support zone if momentum continues)
Stop Loss (SL):
Above the resistance zone: 1.33550–1.33600
This protects the trade if price breaks above the established resistance.
Risk Management Tips:
Risk no more than 1–2% of your trading capital.
Adjust lot size based on SL distance and your risk tolerance.
Monitor for major news events near the 21–23 May period as marked on your chart.

Gbpusd sellShould be start of downwards , price should melt now , just my thoughts
2 RRR
GL Traders
NOT ADVICE !
