GBPUSD Approaches Key Resistance: Watch for Bearish ReversalGBPUSD pair is trading within a clearly defined ascending channel on the 1-hour chart, showing a short-term bullish structure. However, this bullish move appears corrective within a broader consolidation range capped near the 1.3590 resistance zone.
🔍 Technical Breakdown:
Current Price: 1.35535
Immediate Resistance: 1.35885–1.35929 (previous highs and psychological level)
Support Levels:
Trendline support near 1.3530
Horizontal support: 1.34282, 1.34176
Structure:
Price has formed a bullish flag breakout and is now approaching key resistance.
A new higher high is anticipated toward 1.3590, but this level has repeatedly rejected price in the past.
The projected path indicates a potential liquidity grab above 1.3590 followed by a sell-off toward 1.3420–1.3410 area, aligning with a trendline break scenario.
Bearish Scenario:
A strong rejection from the 1.3590 zone, especially if accompanied by bearish divergence or a strong candle close, could trigger a shift back down to the 1.3417–1.3428 support zone.
This would confirm a short-term top and potential retracement toward lower liquidity zones.
📊 Fundamental Backdrop:
USD-side:
Recent U.S. labor market strength (e.g. ADP report and low jobless claims) supports a hawkish bias, favoring USD upside.
However, Fed policymakers remain cautious due to trade tensions and tariff uncertainty. This has injected short-term volatility into USD pairs.
GBP-side:
UK economic data has been mixed, with GDP growth forecasts under scrutiny.
BoE policymakers are dovish, emphasizing weak productivity and wage pressures, making the pound vulnerable to downside catalysts.
📌 Conclusion:
Watch for a potential bull trap near 1.3590, followed by a bearish reversal toward 1.3420–1.3410 if momentum weakens and sellers step in. This would complete the expected technical leg down and align with broader risk sentiment if dollar strength returns.
GBPUSD trade ideas

GBP/USD.2H chart pattern.here's a breakdown of the GBP/USD 2-hour chart setup and the target points indicated:
🔍 Technical Analysis Summary
Pair: GBP/USD
Chart timeframe: 2h
Indicators used: Ichimoku Cloud, Trendline (Support), Risk-to-Reward box
Setup: Bearish break of trendline support
Direction bias: Short (Sell)
Chart pattern: Break of ascending trendline with a rejection from previous highs
Entry zone: Around 1.3540–1.3560
Stop loss: Above 1.3662
Take profit zones:
1. First Target (TP1): 1.33270
2. Second Target (TP2): 1.32110
🎯 Target Points
Target Price Description
TP1 1.33270 First support area
TP2 1.32110 Major support zone
These target points are based on previous support levels and the height of the pattern projected down from the breakout point.
Let me know if you'd like this analysis transferred to another time frame or want updated targets based on more recent price action.

Potential GBP/USD Short Trade from Double Top ResistanceThis GBP/USD chart displays a bearish setup following a double top pattern near the upper trendline of an ascending channel. Price failed to break above resistance and has begun reversing, indicating potential downside momentum. The Ichimoku Cloud shows weakening bullish pressure as price starts to dip below the cloud. Key support levels have been highlighted where price may react. A break below the lower boundary of the channel and the cloud could confirm a bearish continuation. Volume and structure suggest sellers gaining control, making this setup favourable for a short position based on technical confluence and potential trend reversal.
Entry: 1.35850
Target 1: 1.35460
Target 2: 1.35030
If you found this analysis helpful, don’t forget to drop a like and comment. Your support keeps quality ideas flowing—let’s grow and win together! 💪📈

GBPUSD stuck in a tight range - Waiting for the final moveGBPUSD stuck in a tight range - Waiting for the final move
On Thursday, GBPUSD tested 1.3590 again and briefly reached 1.3615, but the bullish attempt failed. The price dropped back below the resistance zone.
For almost two weeks, GBPUSD has been moving up and down in this area. No major economic events are expected this week.
However, US and China officials will meet in London on Monday, June 9. Optimism for a deal is high, and this could push GBPUSD lower from this zone.
Bearish targets: 1.3425, 1.3350, 1.3250, 1.3170.
⚠️ Watch out! This pair is heavily influenced by news.
You may find more details in the chart!
Thank you and Good Luck!
❤️PS: Ple ase support with a like or comment if you find this analysis useful for your trading day❤️
Disclosure: I am part of Trade Nation's Influencer program and receive a monthly fee for using their TradingView charts in my analysis.

GBP/USD Is This the Last Dip Before 1.37?🔹 1. Price Action & Technical Structure (Weekly & Daily Charts)
Price has broken above the ascending channel highlighted on the weekly chart.
The 1.3545 area is currently acting as dynamic resistance — a weekly close above it is crucial to confirm a breakout.
Below, we find a bullish order block (demand zone) around 1.3340 – 1.3280, aligning with the 0.5 Fibonacci level.
RSI is neutral, showing no bearish divergence at the moment.
🔹 2. COT Report (Commitment of Traders)
USD Index:
Non-commercial traders: +823 new longs, +363 new shorts → Neutral to bullish positioning.
Commercials remain net short, indicating short-term USD strength potential.
EUR FX (inverse proxy for USD):
Significant reduction in speculative long positions → Less bullish pressure on the Euro, favoring USD strength.
🔹 3. Sentiment
67% of retail traders are short GBP/USD vs. 33% long.
This is a bullish contrarian signal, suggesting potential continuation toward the 1.36–1.37 zone.
🔹 4. Seasonality
Historically, June tends to be bearish for GBP/USD over the past 5–10 years.
However, the first 10 days of the month often start with bullish momentum before correcting in the second half.
🔹 5. Economic Calendar
Today: Construction PMI (GBP), ECB Press Conference (EUR), Unemployment Claims (USD).
Tomorrow: High potential volatility across all USD pairs.
Watch out — upcoming macro data may strongly impact breakout confirmation.
🔹 6. Operational Outlook
Primary Bias: Neutral/Bullish with potential for a technical pullback.
📍 Key Levels:
Resistance: 1.3545 – 1.3593 (Supply zone + 0.0 fib)
Support: 1.3340 – 1.3280 (OB + 0.5/0.618 fib)
🧠 Scenario 1 – Bullish Continuation:
Retest of 1.3340 → long targeting 1.3590 / 1.3680
Confirmation on daily close above 1.3550
🔻 Scenario 2 – Bearish Retracement:
Rejection below 1.3550 + USD macro strength → drop toward 1.3280
If that breaks → extended move to 1.3170 / 1.3150

#GBPUSD: Smaller Time-Frame Tells A Different Story! GBPUSD has exhibited strong bullish sentiment in shorter timeframes. However, an analysis of shorter timeframes reveals a different picture. The current price trend is upward, and it is anticipated to continue. Nevertheless, we anticipate a price correction around 1.3470, followed by a continuation of the bullish move. We strongly recommend conducting your own analysis before making any investment decisions.
Best of luck in your trading endeavours, and please remember to prioritise safety.
Kindly consider liking, commenting, and sharing this analysis for further insights.
Team Setupsfx_

Massive GBP/USD Reversal Ahead? Head & Shoulders FormationGBP/USD is at a critical technical juncture following a sharp bullish impulse that pushed the pair above the 1.34 handle, printing a strong weekly bullish engulfing candle and breaking out of a multi-week consolidation zone. This move unfolded in a macro context where the U.S. Dollar Index (DXY) is showing clear signs of weakness, with Non-Commercial net long positions dropping drastically—from around 20,000 to less than 5,000 contracts. This shift points to a fading speculative appetite for the dollar, historically a leading indicator of upcoming corrective phases or broader declines in the DXY.
On the flip side, the Commitments of Traders (COT) report on the British Pound reveals that Non-Commercials (typically hedge funds and asset managers) remain net long on GBP, with a slight increase week-over-week. However, Commercials (generally institutions and hedgers) have aggressively built up a significant net short position—levels that in the past preceded major reversals on the pair. This divergence between speculators and institutional hedgers suggests short-term bullish potential, but with rising risk of exhaustion near current resistance levels.
Adding fuel to this outlook is the retail sentiment: approximately 63% of retail traders are currently short GBP/USD, with an average entry price around 1.3021. This kind of retail crowd positioning, typically inefficient from a historical perspective, adds contrarian support for further upside, as long as price holds above the 1.3340 structure.
From a seasonality perspective, June tends to be a mildly bullish-to-sideways month for GBP/USD, especially when looking at the 10- and 15-year seasonal averages. While the seasonal bias is not particularly strong, there’s also no statistical downward pressure this time of year, leaving room for technically-driven moves influenced by liquidity and sentiment rather than macro patterns alone.
On the technical front, the daily chart shows a steep rally capped by a large green candle on Monday, breaking cleanly through the 1.34 resistance zone. The price is now hovering inside a key supply area between 1.3499 and 1.3550—a historically reactive zone that has triggered major rejections in previous months. How price reacts here will likely shape the next major swing. A confirmed breakout and consolidation above 1.3550 would open the door for an extension toward 1.37–1.3750. Conversely, a sharp rejection followed by a break below 1.3412—and especially under 1.3340—would set the stage for a deeper correction toward 1.3170.
The RSI is currently showing early signs of momentum loss, although no strong bearish divergence has emerged yet. This implies that the pair could still fuel another push higher before running out of steam—possibly forming the right shoulder of a head & shoulders pattern if the rejection scenario plays out.

GBP/USD💰Symbol: { GBP/USD }
🟩Price: { 1.35618 }
🟥Stop: { 1.36046 }
1️⃣profit: { 1.35092 }
2️⃣profit: { 1.34570 }
3️⃣profit: { 1.34000 }
📊Check your chart before entering.
🚨Check before use to make sure there is no important news.🚨

GBPUSD SHORT/SELL 1:3.5Reason for selling:
* Break of structure
* B wave of corrective structure forming
* Expanding flat forming
* MACD divergence
* Liquidity under 1.33860
Strategy to use: FIB retracement on 50/61.8
Engulfing candle to the downside
Entry: 1.35616
Stop Loss: 1.36155
Take Profit: 1.33875

GBP/USD Robbery: Can You Grab the Cash Before the Cops Arrive?🚨 GBP/USD "The Cable" forex bank Heist Alert: The Bullish Breakout Robbery Plan (Swing & Scalp Strategy) 🚨
🌟 Hi! Hola! Ola! Bonjour! Hallo! Marhaba! 🌟
Attention Money Makers & Market Robbers! 🤑💰💸
Based on the 🔥Thief Trading Style🔥, here’s our master plan to loot the GBP/USD "The Cable" forex bank. Follow the strategy on the chart—focusing on LONG entries—and escape near the high-risk Red Zone. This area is overbought, consolidating, and a potential reversal trap where bears lurk. 🏆 Take profits fast—you’ve earned it! 💪
🎯 Heist Entries:
📈 Entry 1: "The Breakout Heist!" – Wait for Resistance (1.36200) to break, then strike! Bullish profits await.
📈 Entry 2: "Big Players’ Pullback!" – Jump in at 1.34000+ buy above at any price for a safer steal.
🔔 Pro Tip: Set a chart alert to catch the breakout instantly!
🛑 Stop Loss Rules:
*"Yo, listen! 🗣️ If you’re entering with a buy-stop, DON’T set your SL until AFTER the breakout. Place it at the nearest swing low (3H timeframe) or wherever your risk allows—but remember, rebels risk more! 🔥"*
🏴☠️ Target: 1.37500
🧲 Scalpers: Only play LONG! Use trailing SL to lock in profits. Big wallets? Go all in. Small stacks? Join the swing heist!
📊 Market Pulse:
The GBP/USD "The Cable" is neutral but primed for bullish momentum. Watch:
Fundamentals (COT, Macro, Geopolitics)
Sentiment & Intermarket Trends
Positioning & Future Targets & Overall score
📌 Check our bioo linkks for deep analysis! 🔗🌍
⚠️ Trading Alert:
News = Volatility! Protect your loot:
Avoid new trades during major news
Use trailing stops to secure profits
💥 Boost This Heist!
Hit 👍 & 🔄 to strengthen our robbery crew! Let’s dominate the market daily with the Thief Trading Style. 🚀💵
Stay tuned—another heist drops soon! 🎯🐱👤

GBP/USD: Ttrading Plan for the U.S Session Sell Below 1.3591In my morning forecast. I focused on the 1.3536 level and planned to make trading decisions based on it. Let's take a look at the 5-minute chart and see what happened. A rise and formation of a false breakout around 1.3536.
On Tuesday, the GBP/USD currency pair also showed a downward movement, although the decline and the day's volatility were relatively weak. Once again, the market effectively ignored the macroeconomic background, The minimal reaction from traders was prompted by the jolts report in the U.S., which showed job openings exceeding forecasts, leading to a slight strengthening of the dollar.
Overall, everything remains the same. If the British pound falls, it does so very weakly and for a short time. Whenever there's too much, "chaos," and the dollar grows longer than expected, Trump steps in and puts everything back in its place. Thus, expecting a sustained rise in the dollar remains extremely difficult. Technically, The pair remains above the indicator lines, so the uptrend is intact despite the price breaking out of the ascending channel.
As the global trade war situation continues to worsen, the dollar lacks medium-term growth prospects. For the market, the trade war factor is currently the only thing that matters; practically all other factors are being ignored.

GBP/USD Breakdown After Fake Resistance Break | Bearish Targets 📉 GBP/USD Breakdown After Fake Breakout Trap
Price action formed a fake breakout above the recent resistance near 1.35920, trapping late buyers. Shortly after, a clean breakdown below the ascending trendline confirmed a shift in structure. This move suggests smart money manipulation followed by trend continuation.
✅ Current Setup:
Fake Breakout above resistance
Trendline Breakdown + Retest
Short Bias Active
🎯 Bearish Targets:
Target 1: 1.33368
Target 2: 1.32571
🔎 Waiting for price to stay below trendline with lower highs forming on LTFs (lower timeframes) for extra confirmation.
🧠 Note: This analysis is for educational purposes only. Always use proper risk management and follow your own strategy before entering any trade.
#GBPUSD #Forex #SmartMoney #PriceAction #Breakdown #FXAnalysis #TechnicalAnalysis #TradingView

GBPUSD Potential UpsidesHey Traders, in today's trading session we are monitoring GBPUSD for a buying opportunity around 1.35400 zone, GBPUSD is trading in an uptrend and currently is in a correction phase in which it is approaching the trend at 1.35400 support and resistance area.
Trade safe, Joe.

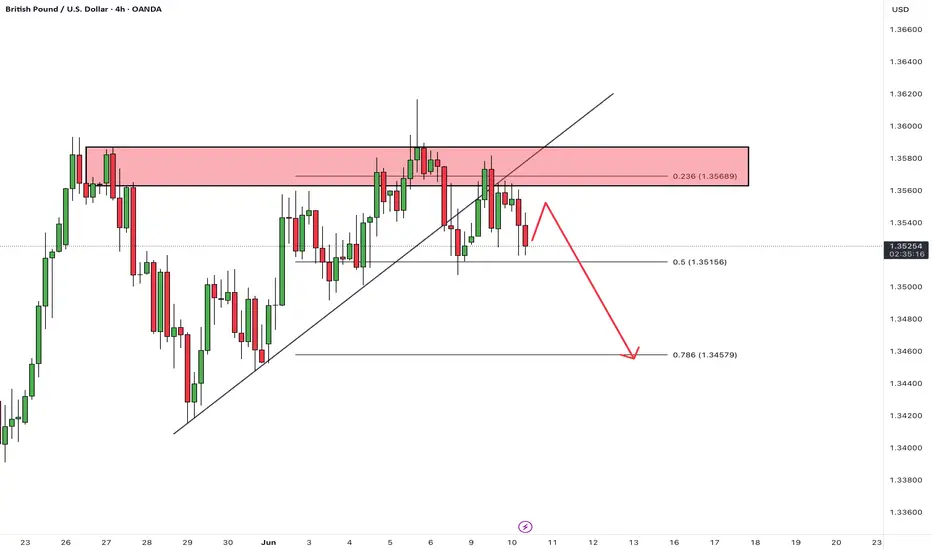
GBPUSD: Liquidity Grab & Bearish SentimentThe 📉GBPUSD pair fall below a significant support cluster on the 4-hour chart.
Following this breakout, the previous support has now become a solid resistance level, which is currently being retested.
I observed a confirmed liquidity grab along with a bearish imbalance candle.
There is a strong likelihood that the price will decline to at least 1.3502.

GBP-USD Local Long! Buy!
Hello,Traders!
GBP-USD made a bearish
Breakout of the rising support
So we are bearish biased mid-term
But locally the pair will soon
Hit a horizontal support
So we will be expecting a
Rebound and a local move up
Buy!
Comment and subscribe to help us grow!
Check out other forecasts below too!
Disclosure: I am part of Trade Nation's Influencer program and receive a monthly fee for using their TradingView charts in my analysis.

EURUSD short term analysis in US sessionEURUSD is trading in the price range of 1.161 and 1.158. It is unlikely that there will be a breakout through this price range today. If the pair retreats slightly to 1.156, it is considered a good buy signal. Let's wait and see what the next short-term developments of EURUSD are.
I will send you the long term analysis of the pair tomorrow.

GBPUSD Edges HigherGBPUSD Edges Higher
GBP/USD is attempting a fresh increase above the 1.3500 resistance.
Important Takeaways for GBP/USD Analysis Today
- The British Pound is attempting a fresh increase above 1.3515.
- There was a break above a key bearish trend line with resistance at 1.3535 on the hourly chart of GBP/USD at FXOpen.
GBP/USD Technical Analysis
On the hourly chart of GBP/USD at FXOpen, the pair declined after it failed to clear the 1.3615 resistance. The British Pound even traded below the 1.3575 support against the US Dollar.
Finally, the pair tested the 1.3500 zone and is currently attempting a fresh increase. The bulls were able to push the pair above the 50-hour simple moving average and 1.3540. There was a break above a key bearish trend line with resistance at 1.3535.
The pair tested the 50% Fib retracement level of the downward move from the 1.3616 swing high to the 1.3507 low. It is now showing positive signs above 1.3540.
On the upside, the GBP/USD chart indicates that the pair is facing resistance near 1.3575 and the 61.8% Fib retracement level of the downward move from the 1.3616 swing high to the 1.3507 low.
The next major resistance is near 1.3590. A close above the 1.3590 resistance zone could open the doors for a move toward 1.3615. Any more gains might send GBP/USD toward 1.3650.
On the downside, immediate support is near the 1.3515. If there is a downside break below 1.3515, the pair could accelerate lower. The first major support is near the 1.3500 level. The next key support is seen near 1.3450, below which the pair could test 1.3420. Any more losses could lead the pair toward the 1.3350 support.
This article represents the opinion of the Companies operating under the FXOpen brand only. It is not to be construed as an offer, solicitation, or recommendation with respect to products and services provided by the Companies operating under the FXOpen brand, nor is it to be considered financial advice.

GBPUSDHello Traders! 👋
What are your thoughts on GBPUSD?
On the 4-hour timeframe, GBPUSD has broken below its ascending trendline and is now trading below a key resistance zone.
We expect the pair to consolidate briefly within this area, and then move lower toward the specified support level.
As long as the price remains below the resistance and the broken trendline, the bearish bias remains valid.
Don’t forget to like and share your thoughts in the comments! ❤️
GBPUSD Analysis Today: Technical and Order Flow !In this video I will be sharing my GBPUSD analysis today, by providing my complete technical and order flow analysis, so you can watch it to possibly improve your forex trading skillset. The video is structured in 3 parts, first I will be performing my complete technical analysis, then I will be moving to the COT data analysis, so how the big payers in market are moving their orders, and to do this I will be using my customized proprietary software and then I will be putting together these two different types of analysis.

GBP/USD - Weekend analysis, a short opportunity
We begin the analysis on the 30 minute chart, we can see that a 5 point trendline has been broken on Friday, the end of the week. Price never recovered above the trendline by day end and is currently trending down as we can see from the new trendline connecting the closing prices of a few recent candles.
When we zoom in on the chart we can also see that the break of the trendline occurred on high volume, a key signal that we should respect this break and expect a potential significant move to follow.
We can also see on the RSI that price is below 50 which means downside momentum is still present. This is a good opportunity to get in on a short trade and place a stop loss above the trendline that was broken, aiming for a take profit that grants a 1:1.5 RR.

Analysis of Trades and Trading Tips for the British PoundThe price test at 1.3535 in the second half of the day occurred just as the RSI indicator was beginning to move downward from the zero line. This confirmed the correct entry point for selling the pound, resulting in a decline of more than 30 pips.
U.S economic indicators published on Friday sparked a wave of optimism across financial markets. Non-farm employment showed confident growth, surpassing economists' forecasts and reaching 139,000 new jobs, while market expectations hovered around 127,000. This factor immediately impacted currency rates. prompting the U.S. dollar to strengthen against major world currencies, particularly the British pound. The unemployment rate, remaining stable at 4.2%, also added to the positive sentiment. A low unemployment rate indicates the U.S. economy's healthy state and stable labor demand. This provides a favorable backdrop for continued economic growth and strengthens the dollar's position. The British pound's reaction to this news was expected - a decline against the U.S dollar. investors, assessing U.S. economic prospects as more favorable, redirected their capital, increasing demand for the dollar and decreasing demand for the pound sterling.
Today, there is no economic data from the UK, so it possible that after Friday's pullback, pound buyers may continue to act within the bullish market framework, betting on further growth in the GBP/USD pair. The absence of fresh economic data leaves room for speculation and allows traders to rely on already-established trends. However, existing risks should not be forgotten, Global economic uncertainty due to U.S. tariffs could exert pressure on the British currency at any moment.

GBPUSD - Very InterestingWith NFP creating massive volatility on Friday this pair is a bit messy.
We have however created an internal structure shift on the 15min timeframe to the downside lower the HTF order flow still being bullish
This could be a case of get what we can to the downside until we hit the HTF demand and look to get long.
As you can see I am already trying to forecast ahead of what could potentially happen with this pair as when it gets to certain levels and there are reactions it will come as no surprise.
If I can be of assistance to anybody please don't hesitate to message.

GBPUSD I Weekly CLS I Model 1 I TR Liquidity TPHey, Market Warriors, here is another outlook on this instrument
If you’ve been following me, you already know every setup you see is built around a CLS Footprint, a Key Level, Liquidity and a specific execution model.
If you haven't followed me yet, start now.
My trading system is completely mechanical — designed to remove emotions, opinions, and impulsive decisions. No messy diagonal lines. No random drawings. Just clarity, structure, and execution.
🧩 What is CLS?
CLS is real smart money — the combined power of major investment banks and central banks moving over 6.5 trillion dollars a day. Understanding their operations is key to markets.
✅ Understanding the behavior of CLS allows you to position yourself with the giants during the market manipulations — leading to buying lows and selling highs - cleaner entries, clearer exits, and consistent profits.
📍 Model 1
is right after the manipulation of the CLS candle when CIOD occurs, and we are targeting 50% of the CLS range. H4 CLS ranges supported by HTF go straight to the opposing range.
"Adapt what is useful, reject what is useless, and add what is specifically your own."
— David Perk aka Dave FX Hunter ⚔️
👍 Hit like if you find this analysis helpful, and don't hesitate to comment with your opinions, charts or any questions.
