GBP/USD - Triangle Breakout (23.05.2025)The GBP/USD pair on the M30 timeframe presents a Potential Buying Opportunity due to a recent Formation of a Triangle Pattern. This suggests a shift in momentum towards the upside and a higher likelihood of further advances in the coming hours.
Possible Long Trade:
Entry: Consider Entering A Long Position around Trendline Of The Pattern.
Target Levels:
1st Resistance – 1.3502
2nd Resistance – 1.3534
🎁 Please hit the like button and
🎁 Leave a comment to support for My Post !
Your likes and comments are incredibly motivating and will encourage me to share more analysis with you.
Best Regards, KABHI_TA_TRADING
Thank you.
Disclosure: I am part of Trade Nation's Influencer program and receive a monthly fee for using their TradingView charts in my analysis.
GBPUSD trade ideas

GBPUSD Trade Setup – Entry at 1.34708 with Target at 1.27735Entry Point: ~1.34708
Stop Loss Zone: ~1.35734 (roughly 100 pips above entry)
Target Points:
EA Target Point One: 1.31769
EA Final Target Point: 1.27735
---
Technical Observations:
1. Price Action:
The price is consolidating below the 1.34708 resistance level.
Multiple failed attempts to break above suggest selling pressure around this zone.
2. Moving Averages:
Two MAs (possibly 50 EMA and 200 EMA) show a recent crossover, potentially indicating a shift in momentum.
3. Bearish Bias:
Based on the annotated targets, the trader anticipates a reversal from the current level.
A drop to 1.27735 represents a 5.09% move from the entry point.
4. Risk-Reward Ratio:
Risk (Entry to Stop Loss): ~100 pips
Reward (Entry to Final TP): ~700+ pips
Risk-reward is highly favorable (~1:7)
Confluence & Support Zones:
1.31769: Previously tested support/resistance level – a logical intermediate target
1.27735: Historical support zone from early March – final bearish target.
Summary:
This setup is a swing short trade with an attractive risk-reward profile.
Confirmation via bearish reversal candlesticks near 1.34708 would strengthen the case.
Watch out for news catalysts or USD data that might impact volatility and invalidate the setup.

GBPUSD may correct after false breakout The currency pair has overcome a huge 0.8% or 110 points since the opening of the session, having wasted all the potential and is trying to test the resistance. The potential for breakout and continuation of growth may not be enough and the price may make a false breakout and correction before the second impulse to the intermediate high, where the scenario with correction may be repeated
Scenario: Breakout of 1.3402. No possibility to continue growth, return under the level and consolidation below the level - further sales.
It is possible that the price will consolidate above 1.34 and will head towards the far, strong level of 1.34425 from which a false breakout and correction can also be considered.

GBPUSD: Will DXY Bounce Back? |GBPUSD Swing Sell|The GBPUSD pair is currently rallying towards a potential selling zone, where sellers could push the price down. However, the main concern is the current state of the DXY, which clearly indicates another sell-off and could lead to another lower low. Please remember to use risk management while trading forex pairs.
There are three take-profit targets that can be set according to your trading plan. This analysis doesn’t guarantee that the price will move as described.
Good luck and trade safely!
Thank you for your unwavering support! 😊
If you’d like to contribute, here are a few ways you can help us:
- Like our ideas
- Comment on our ideas
- Share our ideas
Team Setupsfx_
❤️🚀

GBPUSD COT and Liquidity AnalysisHey what up traders welcome to the COT data and Liquidity report. It's always good to go with those who move the market here is what I see in their cards. I share my COT - order flow views every weekend.
🎯 Longs and shorts decreasing but overal maintained bullish exposure 58% which is not much but seems to me like Key level will be reached..
📍Please be aware that institutions report data to the SEC on Tuesdays and data are reported on Fridays - so again we as retail traders have disadvantage, but there is possibility to read between the lines. Remember in the report is what they want you to see, that's why mostly price reverse on Wednesday after the report so their cards are hidden as long as possible. However if the trend is running you can read it and use for your advantage.
💊 Tip
if the level has confluence with the high volume on COT it can be strong support / Resistance.
👍 Hit like if you find this analysis helpful, and don't hesitate to comment with your opinions, charts or any questions.
Analysis done on the Tradenation Charts
Disclosure: I am part of Trade Nation's Influencer program and receive a monthly fee for using their TradingView charts in my analysis.
"Adapt what is useful, reject what is useless, and add what is specifically your own."
— David Perk aka Dave FX Hunter ⚔️

GBP/USD - POTENTIAL RETRACEMENT SETUP (15 MIN CHART)Market Structure :
Price made a strong bullish move and is now showing signs of a retracement from a clear supply zone around the recent highs. The impulsive leg is being respected, and the market has started pulling back from the top.
Key Technical Points:
Supply Zone marked where price reversed aggressively.
Fibonacci retracement levels drawn from the swing low to the swing high.
Price currently sitting between the 38.2% and 50% retracement zone.
The 61.8% - 78.6% zone, along with ascending trendline support (in orange), creates a confluence area for a possible bullish reaction.
Two potential entry zones are highlighted:
1. Near the trendline and fib golden zone
2. Deeper retracement near OB demand zone and the 78.6% level.
Bias:
Bullish continuation if price respects the trendline and demand zones. Waiting for confirmations like bullish engulfing or break of structure from lower timeframes before entry.
Risk Management:
SL below demand zone. TP targeting retest of supply zone or potential breakout depending on momentum

GBP/USD About to Explode?GBP/USD is currently trading around the 1.3360–1.3380 zone after testing the key weekly resistance area between 1.3400 and 1.3450. The bullish momentum remains strong, supported by speculative positioning still favoring the pound, while the dollar shows signs of softening. On the macro side, the interest rate differential between the UK and the US may narrow in the coming months, but for now, it continues to support upward pressure on the pair.
From a technical standpoint, price has broken out of an ascending triangle on the daily chart, showing strong momentum and confirmation with multiple closes above 1.3300. Market sentiment remains skewed to the short side, adding contrarian fuel to the bullish bias. The key short-term support lies between 1.3270 and 1.3300. As long as this area holds, the base case favors a continuation toward 1.3520 and potentially 1.3600. A break below 1.3170 would invalidate the current bullish structure and open the door for a deeper pullback toward 1.3000.
From an execution standpoint, a confirmed breakout above 1.3415 could offer a long entry opportunity with active management. Still, caution is advised around the weekly supply zone due to its historical responsiveness. Eyes remain on upcoming macro data and potential volatility from central bank statements.

GBPUSD I Weekly CLS I Model 1 Target MOBHey, Market Warriors, here is another outlook on this instrument
If you’ve been following me, you already know every setup you see is built around a CLS range, a Key Level, Liquidity and a specific execution model.
If you haven't followed me yet, start now.
My trading system is completely mechanical — designed to remove emotions, opinions, and impulsive decisions. No messy diagonal lines. No random drawings. Just clarity, structure, and execution.
🧩 What is CLS?
CLS is real smart money — the combined power of major investment banks and central banks moving over 6.5 trillion dollars a day. Understanding their operations is key to markets.
✅ Understanding the behaviour of CLS allows you to position yourself with the giants during the market manipulations — leading to buying lows and selling highs - cleaner entries, clearer exits, and consistent profits.
🛡️ Models 1 and 2:
From my posts, you can learn two core execution models.
They are the backbone of how I trade and how my students are trained.
📍 Model 1
is right after the manipulation of the CLS candle when CIOD occurs, and we are targeting 50% of the CLS range. H4 CLS ranges supported by HTF go straight to the opposing range.
📍 Model 2
occurs in the specific market sequence when CLS smart money needs to re-accumulate more positions, and we are looking to find a key level around 61.8 fib retracement and target the opposing side of the range.
👍 Hit like if you find this analysis helpful, and don't hesitate to comment with your opinions, charts or any questions.
⚔️ Listen Carefully:
Analysis is not trading. Right now, this platform is full of gurus" trying to sell you dreams based on analysis with arrows while they don't even have the skill to trade themselves.
If you’re ever thinking about buying a Trading Course or Signals from anyone. Always demand a verified track record. It takes less than five minutes to connect 3rd third-party verification tool and link to the widget to his signature.
"Adapt what is useful, reject what is useless, and add what is specifically your own."
— David Perk aka Dave FX Hunter ⚔️

IS THE BULLISH CHANNEL NEARING EXHAUSTION OR JUST GEARING UP?GBPUSD OUTLOOK – IS THE BULLISH CHANNEL NEARING EXHAUSTION OR JUST GEARING UP?
📊 Macro Overview:
The USD continues to soften slightly as markets begin pricing in a potential rate cut by the Fed later in Q3. Meanwhile, the British Pound (GBP) is holding firm, supported by stronger-than-expected UK macroeconomic data—particularly retail sales and inflation figures.
However, UK fiscal concerns remain a headwind, and GBPUSD is highly sensitive to upcoming U.S. data—especially Core PCE and employment figures this week.
📉 Technical Analysis:
On the 1H chart, GBPUSD is moving within a broad ascending channel and is now approaching the upper resistance trendline at 1.3555 – a key zone that could trigger short-term profit-taking.
EMAs 13 and 34 are still in bullish alignment, supporting ongoing momentum.
Despite the bullish setup, current candle structure suggests a potential pullback to the 1.3448 support zone before a continuation higher—if buyers regain control.
🔑 Key Price Levels:
Resistance Zones:
🔸 1.3555 – Channel top resistance
🔸 1.3586 – Extended resistance zone
Support Zones:
🔹 1.3448 – Technical and Fibo confluence
🔹 1.3398 – Major structure support in case of breakdown
🛠️ Trade Scenarios:
✅ Scenario 1: BUY on retracement
Entry: 1.3448 (watch for bullish confirmation on H1)
Stop Loss: 1.3394
Take Profit: 1.3500 → 1.3555 → 1.3585
✅ Scenario 2: SELL scalp from resistance
Entry: 1.3555
Stop Loss: 1.3588
Take Profit: 1.3500 → 1.3460
🧠 Final Thoughts:
GBPUSD remains bullish in structure but is testing key resistance levels. A clean pullback to the 1.3448 region may provide a strong buying opportunity if confirmed by price action. If this level breaks, bearish divergence could kick in and push the pair back to deeper support zones. Stay alert for high-impact economic releases and trade with solid risk management!


GBPThe resistance has been broken so I’m waiting for retest back to the origin that caused the break then I will long it

GBP/USD Breakout – Long Opportunity Above Key ResistanceGBP/USD has broken above the 1.3500 resistance level, confirming bullish momentum. The pair is trading at 1.35388 with a strong daily candle and volume backing the move. This breakout aligns with a bullish flag pattern formed over the past two weeks.
RSI remains below overbought levels, suggesting more upside potential. MACD is also crossing above the signal line, adding confirmation.
Trade Setup:
Entry: 1.3540 (confirmation of breakout)
Take Profit: 1.3650 (previous high from February)
Stop Loss: 1.3475 (below the breakout zone and recent consolidation)
Risk/Reward: Approximately 1:2, aligning with my trading strategy.

GBP/USD bullish run still going?This week’s analysis for GU is centred around the current pro-trend momentum and where we could see potential entries to continue riding it.
To begin with, there’s a refined 3D supply zone located at a premium level which could cause a short-term bearish reaction. I’ll be monitoring this area for any possible short setups — but only with strong confirmation.
However, the overall structure remains predominantly bullish, as shown by a series of higher highs and higher lows, along with significant breaks of structure. The most relevant point of interest for a bullish continuation sits around the 1.34200 level, where a clean 9H demand zone resides. This is where I’ll be looking to enter long positions if price retraces to that area.
Confluences for GU Buys:
- Clear formation of higher highs and higher lows, confirming bullish structure
- Strong 9H demand zone that initiated the recent break of structure
- Liquidity above still yet to be cleared
- DXY remains bearish, supporting continued bullish momentum on GBP/USD
P.S. Don’t get too caught up chasing countertrend moves. The real edge lies in identifying the nearest POI that aligns with the overall trend and waiting for your setup to unfold there.

GBPUSD BULLISH OR BEARISH DETAILED ANALYSISGBPUSD has played out exactly as forecasted, completing a clean bullish leg from the Fibonacci confluence zones and breaking through the key 1.3430 resistance level. The structure remains strongly bullish, and after this minor retest, I’m anticipating another impulsive wave to the upside, with the next target sitting firmly at the 1.3900 level. The pair continues to respect both structure and momentum, showing consistent demand on dips.
Fundamentally, the British pound continues to gain strength backed by sticky inflation data and hawkish tone from the Bank of England. With UK CPI remaining elevated and core services inflation running hot, the BoE is being forced to hold its tightening bias. This contrasts sharply with the Federal Reserve, where recent data shows signs of softening labor markets and cooling price pressure, bringing rate cut expectations back on the table for the second half of 2025.
Technically, GBPUSD has cleanly respected all key fib levels from the previous correction. The breakout above 1.3430 has flipped structure into bullish continuation, and the market has already begun forming higher highs and higher lows on both daily and 4H timeframes. As long as price holds above the 1.3430–1.3450 retest zone, the bullish outlook remains intact with high-probability momentum toward 1.3900.
In current market sentiment, GBPUSD remains one of the strongest trending pairs, with institutions adding to long exposure as the dollar index weakens. As a professional trader, I remain long-biased and look to scale in on lower timeframe retracements. This is a textbook continuation play backed by both technicals and macro momentum. Let the trend work—bulls remain in full control.

GBPUSD - One More Leg for Bears to Take Over!Hello TradingView Family / Fellow Traders. This is Richard, also known as theSignalyst.
📈GBPUSD has been overall bullish trading within the rising broadening wedge pattern marked in red.
However, it is currently approaching the upper bound of the wedge acting as an over-bought zone.
And the $1.365 - $1.375 is a strong resistance zone.
🏹 Thus, the highlighted red circle is a strong area to look for sell setups as it is the intersection of resistance and upper red trendline acting as a non-horizontal resistance.
📚 As per my trading style:
As #GBPUSD approaches the red circle zone, I will be looking for bearish reversal setups (like a double top pattern, trendline break , and so on...)
📚 Always follow your trading plan regarding entry, risk management, and trade management.
Good luck!
All Strategies Are Good; If Managed Properly!
~Rich
Disclosure: I am part of Trade Nation's Influencer program and receive a monthly fee for using their TradingView charts in my analysis.

GBPUSD next move (Bulls are still in play)(23-05-2025)Go through the analysis carefully, and do trade accordingly.
Anup BIAS (23-05-2025) (mid term)
Current price- 1.34400
"if Price stay above 1.33700 then next target is 1.35400 and 1.37000"
-POSSIBILITY-1
Wait (as geopolitical situation are worsening )
-POSSIBILITY-2
Wait (as geopolitical situation are worsening)
Best of luck
Never risk 2% of principal to follow any position.
Support us by liking and sharing the post.

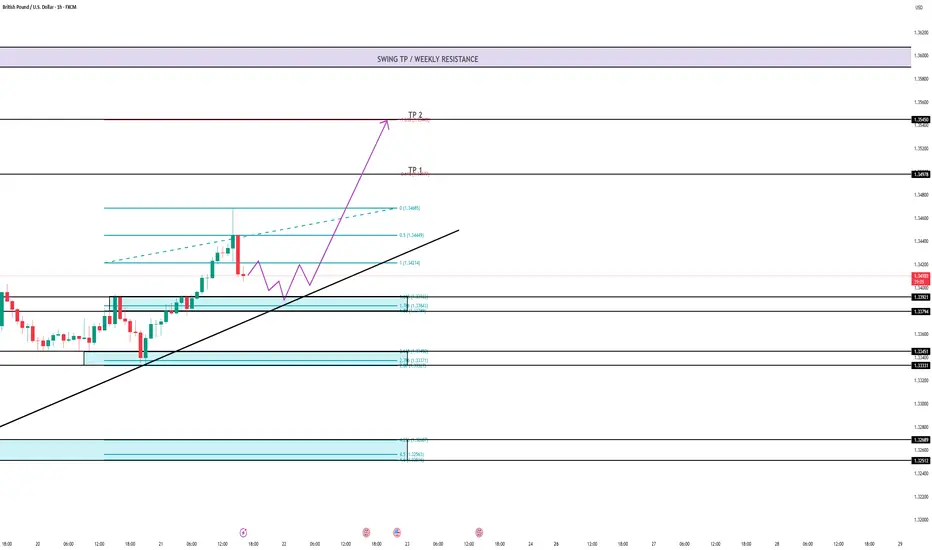
GBPUSD Possibilities To Make Big ShotHi traders,
Here The analysis for FX:GBPUSD im looking for. GBP CPI data already release 2 hours ago. It shows the strong data. The annual inflation rate in the UK jumped to 3.5% in April 2025, the highest since January 2024, from 2.6% in March and above forecasts of 3.3%.
Thus, im prepare for the oppurtuniti come after the data release. At the blue zone 1.33921 - 1.33794 is the best zone to execute. I will waiting in the zone and follow the SOP on lowest timeframe to ensure the best time to execute with quality of trade.
ZONE : 1.33921 - 1.33794
TP1 : 1.34980
TP2 : 1.35450
TP SWING : 1.36000
STOPLOSS : 1.33700
GU-Wed-21/05/25 TDA-GBP CPI higher than expected, Bullish!Analysis done directly on the chart
Follow for more, possible live trades update!
Risk management. You can take bad trades but
you can recover with good risk management.
The profitable strategy alone isn't enough to
succeed in this game.
Not financial advice, DYOR.
Market Flow Strategy
Mister Y

Sell GBPUSDGBPUSD may be bearish today judging from this given structure. Let us sell here fro here at take profit at 1,3406

GBPUSD 4H Bearish OutlookGBPUSD Analysis
I don’t see any reason for an upside move here.
Price is expected to continue lower.
Bearish targets:
• 1.3226
• 1.3180
• 1.3153
Only a breakout and hold above 1.3293 will invalidate this analysis.

GBPUSD: MACD Cross confirms more upsideGBPUSD is bullish on its 1D technical outlook (RSI = 59.696, MACD = 0.006, ADX = 36.278) as it's been inside a Channel Up since the start of the year (January 13th 2025 low). At the moment the 1D MA50 is holding and provides the short term support. The 1D MACD just formed a Bullish Cross, validating the new bullish wave. We are bullish, aiming for another +3.63% HH rise (TP = 1.3600).
See how our prior idea has worked out:
## If you like our free content follow our profile to get more daily ideas. ##
## Comments and likes are greatly appreciated. ##

GBP/USD BREAKOUT SIGNAL FOR BULLISH CONTINUATION?We were anticipating a breakout of range last week which we finally saw to the upside. The range lasted over a week and the breakout to the upside was a significant signal of bullish strength in price. We are clear on the fact that we are still in a bullish trend and the current correction in price is likely to prepare us for a bull run with no less than 200 pips in sight.
Let's observe patiently and let's see how price reacts so we can cash in on any potential move.

Gbpusd sellShould be start of downwards , price should melt now , just my thoughts
2 RRR
GL Traders
NOT ADVICE !
