GBP/USD Bearish Trend Analysis GBP/USD Bearish Trend Analysis
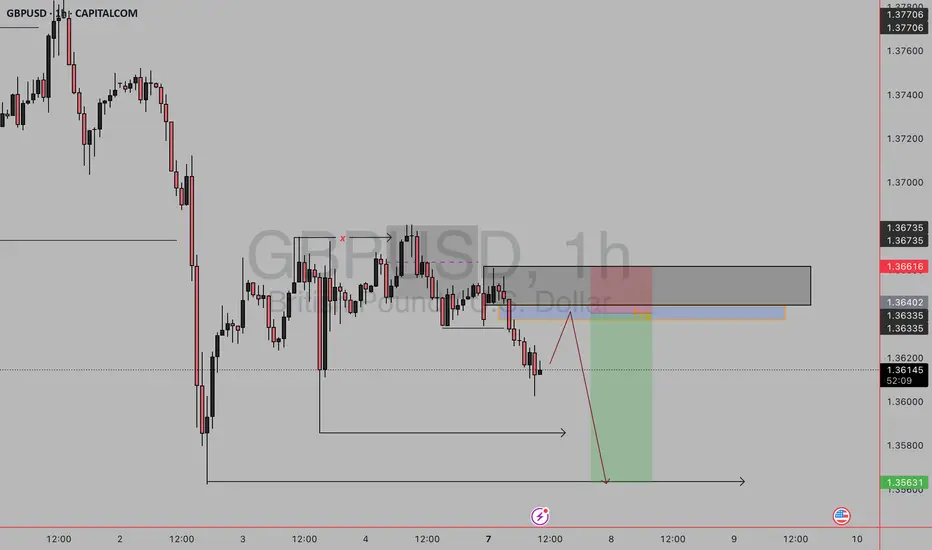
The GBP/USD pair is currently exhibiting a bearish trend on the 1-hour chart, with the market forming lower lows, a clear indication of sustained selling pressure. This downward momentum suggests that traders are favoring short positions, and the bearish sentiment may continue in the upcoming trading sessions.
Bearish Flag Pattern Suggests Further Downside
Adding to the bearish outlook, the price action is forming a bearish flag pattern, which is typically a continuation signal in a downtrend. This pattern consists of a sharp decline (the flagpole) followed by a slight upward or sideways consolidation (the flag). A breakdown below the flag’s support could trigger another wave of selling, reinforcing the bearish bias.
Key Support Levels to Watch
If the downtrend continues, the market could target the following support levels:
- 1.35850 – The initial downside target, likely to act as a short-term support zone.
- 1.35100 – A deeper support level that may come into play if selling pressure intensifies.
A break below these levels could open the door for further declines, potentially extending toward 1.34500 or lower, depending on market momentum.
Resistance Level as a Key Barrier
On the upside, the 1.37900 level serves as a critical resistance. If the price retraces higher, this zone could act as a strong barrier where sellers might re-enter. A sustained break above this resistance could invalidate the bearish outlook, signaling a potential trend reversal or consolidation phase.
Trading Strategy Considerations
- Bearish Scenario: Traders may look for short opportunities near resistance levels or upon a confirmed breakdown below the bearish flag.
- Risk Management: A stop-loss above 1.37900 (or a recent swing high) could help mitigate risk if the market reverses unexpectedly.
- Bullish Caution: If GBP/USD breaks above 1.37900 with strong momentum, the bearish thesis may need reevaluation.
Conclusion
The GBP/USD pair remains bearish in the short term, supported by the lower lows and the bearish flag pattern. Traders should monitor the 1.35850 and 1.35100 support levels for potential downside targets, while keeping an eye on 1.37900 as a key resistance that could determine whether the downtrend continues or reverses. Proper risk management remains essential in navigating this market structure.
GBPUSD trade ideas

GBP/USD – Uptrend Channel Analysis!GBP/USD is trading inside a strong uptrend channel on the 4-hour chart.
Recent price action confirmed a Break of Structure (BOS), signaling solid bullish control.
Buyers have pushed price firmly above previous resistance zones.
Price is now near the upper boundary of the channel.
Signs of short-term exhaustion suggest a likely retracement ahead.
A pullback into the retracement level or channel midline would offer better risk-reward.
Key Levels to Watch:
Channel support for potential bounce.
Retracement zone as a buy opportunity.
Trade Plan:
Wait for a clean retracement toward support.
Look for bullish confirmation before entering long.
Avoid chasing highs – focus on discounted entries.
Bias: Bullish while price holds the uptrend channel structure.
Expect continuation after healthy correction.
Patience is critical – let the market set up a quality entry.
Traders should align with the dominant trend and manage risk carefully.
Like, comment, share, and follow for more trading ideas.

SHORT and SHORT in GBPUSDHello Fellow traders,
I am sharing my short position in GBP/USD today.
I have decided to go short on GBP/USD, following the announcement of steep U.S. tariffs. Fundamentally, this aligns with my outlook: the USD is acting as a safe haven, while the GBP remains more risk-sensitive amidst global uncertainty.
From a technical standpoint—though I keep things simple—my analysis supports the bearish sentiment, and I have entered a short position accordingly.
Good luck, everyone, and trade safe!

GU-Tue-08/07/25 TDA-GU stagnant ahead of tomorrow's FOMC minutesAnalysis done directly on the chart
Follow for more, possible live trades update!
I often share my live trades in Tradingview public chat in London session, stay tuned!
Green flags, Red flags when you follow someone in trading:
Red flags:
-Always and only share winning trades
-No track records
-A lot of marketing campaign, offering paid courses and more but
with no proof of real trading skills
(I'm not against paid course etc... Just to keep in mind)
-Just sharing buy or sell but without explaining the confluences,
the setups, the reasons, the lot size, how risk manage the trade...
-Simply don't even know where to put sl and tp in advance
Green flags:
-Do live streaming in real time
-Keeping transparent about trade setups, ideas,
about wins and losses
-Share live track record of an account
These are just some signs (could be more green and red flag signs),
and should not be used as effective methods.
If you have more of green flags or red flags ideas, comment down below!
Premise:
A simple idea plan (like Tradingview public posts) won't describe everything.
No one can predict how market will move, it's always good to react to how it moves.
It gives an idea of how price might move, but no one come from FUTURE.
So I always encourage people to openly and actively discuss in real time.
For example discussing on Tradingview public chat (and more).
I don't give signals blindly, people should learn
and understand the skill.
Following blindly signals you won't know how to
manage the trade, where precisely put sl and tp,
lot size and replicate the move over time.
That's why you need active real time discussions.
Trading is not get rich quick scheme!
Active in London session!
Not financial advice, DYOR.
Market Flow Strategy
Mister Y

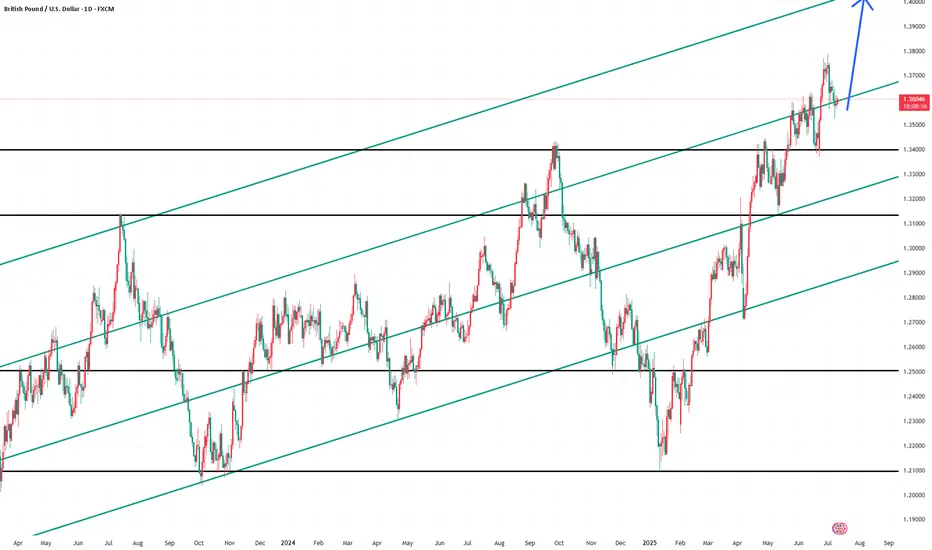
GBP/USD Bullish Breakout Setup | Targeting 1.4000+GBP/USD is showing strong bullish structure after respecting the key support zone around 1.3550–1.3570. A potential breakout above the 1.3740–1.3780 resistance zone could fuel further upside momentum.
🟡 Support Area: 1.3550 – 1.3570
🟡 Breakout Area: 1.3740 – 1.3780
🔵 Target Point: 1.4000+
📈 If the price holds above the breakout zone, we expect a clean rally toward 1.4000 psychological level. Watch for confirmation and volume to support the move
#GBPUSD
#Forex
#FXAnalysis
#PriceAction
#BreakoutSetup
#SmartMoney
#LiquidityGrab
#TechnicalAnalysis
#BullishSetup
#ForexForYou
#ForexTradingView
#FXTrader
#MarketStructure
#ForYou
#ForYou #GBPUSD #BreakoutSetup #SmartMoney #Forex

GBPUSD InsightHello to all our subscribers!
Please feel free to share your personal thoughts in the comments. Don’t forget to hit the boost button and subscribe!
Key Points
- U.S. President Trump revealed letters sent via Truth Social to the leaders of seven countries, including the Philippines and Algeria. Notably, he warned of a 50% tariff on imports from Brazil.
- The June FOMC minutes confirmed that key Fed members are divided on the outlook for rate cuts within the year.
- The U.S. 10-year Treasury yield reversed course and fell for the first time in six sessions, following strong demand in the latest bond auction.
Major Economic Events This Week
+ July 10: Germany – June Consumer Price Index (CPI)
+ July 11: United Kingdom – May Gross Domestic Product (GDP)
GBPUSD Chart Analysis
While the pair recently faced resistance near the 1.38000 level and experienced a pullback, it appears to be regaining momentum, supported by the trendline near 1.36000.
If this support holds and the price moves as expected, a rally toward the 1.40000 level could be anticipated.
However, if the current support fails, the pair could retreat toward the 1.34000 level. Therefore, it is important to closely monitor the price action in the current zone.
short for gbpusdLooking at the daily time frame for gbpusd, I am bearish and belive we will attack that sellside this week or next week. Lets break this down.1st PDAY array- We have a breaker that is failing to hold price, we could see that breaker act an an inversion. The second PD array that is failing is that discount daily fvg, we are hovering on it, but it has provided no bounce, indicating weakness. DXY also looks solid, and out of eurusd pr gbpusd, pound is the one to be shorting right now. If you look at the eurgbp chart, eur has been stronger that gbp.

Potential Long Setting Up on GBP 4HLong term uptrend. Strong chart.
Need to see short term trend turn around. Close needs to hold.
Entry with 1:1.75 profit and 120 point stop.
Let's see how it plays out.

GU breaker block analysisSo as GU broke 1.3600 with strong impulse on 25th June, price left behind an OB at that same 1.3600 level. I see price has come back to that OB with a very strong drop on 2nd July and completely gone through the OB. As that OB or 1.36000 level has acted as support, it has been tested multiple times but price has now broken through couple of times, turning the 25 June OB into a breaker block, which now acts as resistance and I expect price to drop lower towards the next 4h OB at 1.34000 level.
I'm now waiting for price to reach the 4h OB left at 1.36190 on 8th July to short down towards 1.34000 level. For entry I'm going lower to 15min chart to see the Choch for extra entry confirmation.

GBPUSDThe market structure on GBPUSD shows a clear liquidity sweep above recent highs, followed by a market structure shift (MSS) to the downside, signaling a potential reversal. After the liquidity grab, price failed to sustain above the swept highs and started to form lower highs.
The RSI indicator also confirms a bearish divergence, strengthening the bearish bias. Currently, price is consolidating below the MSS level, which could act as a supply zone on any retest.
A strong bearish continuation is expected, targeting the SSL (Sell-side Liquidity) level marked below, which aligns with a potential demand zone from late June. The bearish projection suggests a move toward the 1.3350–1.3400 area.
This setup favors short opportunities on lower timeframe pullbacks, maintaining a bearish outlook as long as the price remains below the MSS.

GBPUSD - 2 potential selling opportunitiesLooking at GBPUSD
We have 2 potential selling POI's.
The first one being a point in which we will need to sit on our hands for a little bit to see what price does at there is no inducement in the push down in the impulse leg. With that being the case we will need to see some sort of inducement built before we enter that POI
IF we clear the first POI I think I will take a more aggressive entry on the secondary POI that sits a little bit higher. This is due to us having already put in some sort of liquidity in and around that POI before pushing lower.
Will wait and see what happens.
Tomorrow could be a very good trading day

A Good Trade & An Even Better Trading LessonA good trading idea on the GBPUSD, looking at a potential bearish trend continuation trade using a breakout & pullback technique. But an even better trading lesson on the importance of having rules for how to analyze the market so that you can avoid confusion and/or conflicting signals.
If you have any questions or comments please leave them below.
Akil

Gbpusd long scalpWaiting confirmation with close above 1.35565, entry will at retest of that level for trade #7.
So far 6 out of 100 trades.
5 losses 1 win.

GBPUSD Is Going Up! Buy!
Take a look at our analysis for GBPUSD.
Time Frame: 9h
Current Trend: Bullish
Sentiment: Oversold (based on 7-period RSI)
Forecast: Bullish
The market is testing a major horizontal structure 1.360.
Taking into consideration the structure & trend analysis, I believe that the market will reach 1.370 level soon.
P.S
We determine oversold/overbought condition with RSI indicator.
When it drops below 30 - the market is considered to be oversold.
When it bounces above 70 - the market is considered to be overbought.
Disclosure: I am part of Trade Nation's Influencer program and receive a monthly fee for using their TradingView charts in my analysis.
Like and subscribe and comment my ideas if you enjoy them!

GBPUSD LONG FORECAST Q3 D8 W28 Y25GBPUSD LONG FORECAST Q3 D8 W28 Y25
Professional Risk Managers👋
Welcome back to another FRGNT chart update📈
Diving into some Forex setups using predominantly higher time frame order blocks alongside confirmation breaks of structure.
Let’s see what price action is telling us today!
💡Here are some trade confluences📝
✅Daily order block
✅1H Order block
✅Intraday breaks of structure
✅4H Order block
🔑 Remember, to participate in trading comes always with a degree of risk, therefore as professional risk managers it remains vital that we stick to our risk management plan as well as our trading strategies.
📈The rest, we leave to the balance of probabilities.
💡Fail to plan. Plan to fail.
🏆It has always been that simple.
❤️Good luck with your trading journey, I shall see you at the very top.
🎯Trade consistent, FRGNT X

Bearish reversal off pullback resistance?GBP/USD is rising towards the resistance level which is a pullback resistance that is slightly above the 50% Fibonacci retracement and could drop from this level to our take profit.
Entry: 1.3683
Why we like it:
There is a pullback resistance level that is slightly above the 50% Fibonacci retracement.
Stop loss: 1.3746
Why we like it:
There is a pullback resistance level.
Take profit: 1.3590
Why we like it:
There is a pullback support level.
Enjoying your TradingView experience? Review us!
Please be advised that the information presented on TradingView is provided to Vantage (‘Vantage Global Limited’, ‘we’) by a third-party provider (‘Everest Fortune Group’). Please be reminded that you are solely responsible for the trading decisions on your account. There is a very high degree of risk involved in trading. Any information and/or content is intended entirely for research, educational and informational purposes only and does not constitute investment or consultation advice or investment strategy. The information is not tailored to the investment needs of any specific person and therefore does not involve a consideration of any of the investment objectives, financial situation or needs of any viewer that may receive it. Kindly also note that past performance is not a reliable indicator of future results. Actual results may differ materially from those anticipated in forward-looking or past performance statements. We assume no liability as to the accuracy or completeness of any of the information and/or content provided herein and the Company cannot be held responsible for any omission, mistake nor for any loss or damage including without limitation to any loss of profit which may arise from reliance on any information supplied by Everest Fortune Group.

GBPUSD -SHort TGT 1.3464GBPUSD is expected to hit long. However the pair will retrace to 1.3464 before futher long move.
GBPUSD LONG TRADE PLANThe pair is trading in a bullish channel. Following this pattern, I'll be looking for buy opportunities after retest.
Please do your own analysis before placing any trades.
Cheers and Happy Trading.

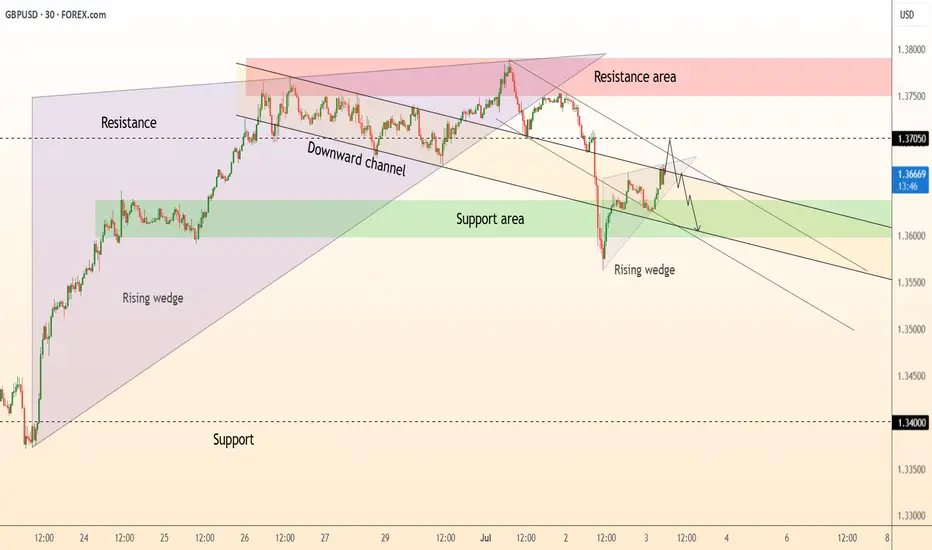
DeGRAM | GBPUSD will continue to correct📊 Technical Analysis
● Price retests the broken wedge-base & channel roof ≈ 1.370 inside a confluence resistance zone (pink). Lower-highs into this cap form a bear flag pointing toward 1.360.
● Intraday rising-wedge has already cracked; projected width and the broader descending channel intersect 1.352-1.355, reinforcing downside targets.
💡 Fundamental Analysis
● Softer UK PMI prices and pre-election caution keep BoE-cut probabilities elevated, while a stronger US JOLTS print plus hawkish FOMC minutes underpin the dollar, favouring renewed GBP/USD pressure.
✨ Summary
Fade rallies 1.368-1.372; slide below 1.360 unlocks 1.355 then 1.343. Bear thesis invalid on a 30 min close above 1.374.
-------------------
Share your opinion in the comments and support the idea with a like. Thanks for your support!
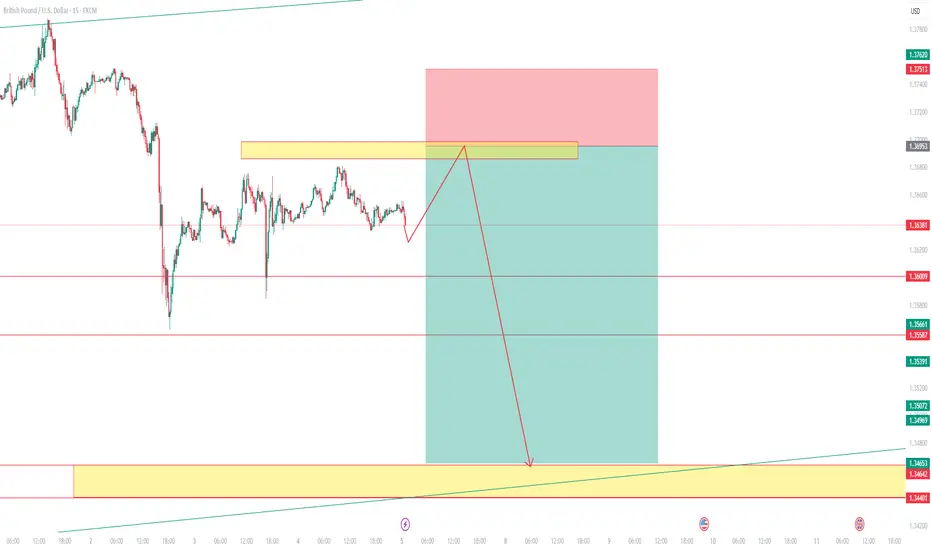
gbpusd sell setup🧠 Setup Summary:
You're anticipating a retracement into a supply zone (marked by the grey box) which contains a Fair Value Gap (FVG) before continuing the bearish move.
🧩 Key Components:
Supply Zone (Grey Box):
A previously mitigated zone where price dropped aggressively.
Likely institutional sell orders remain there.
Fair Value Gap (Orange Zone):
Price moved away fast and left an imbalance.
Your expectation: Price will return here, fill it, and then drop.
Entry Plan:
Sell when price taps into FVG or upper supply zone around 1.36420 – 1.36616.
Confirmation could be a bearish engulfing, liquidity sweep, or BOS on LTF.
Stop Loss: Above the supply zone — around 1.36680.
Take Profit (TP): A major low, likely 1.35631.
Risk-Reward: Strong RR (likely 1:3+), in line with institutional-style trading
GBP/USD BEARS ARE STRONG HERE|SHORT
Hello, Friends!
GBP/USD pair is in the uptrend because previous week’s candle is green, while the price is clearly rising on the 3H timeframe. And after the retest of the resistance line above I believe we will see a move down towards the target below at 1.358 because the pair overbought due to its proximity to the upper BB band and a bearish correction is likely.
Disclosure: I am part of Trade Nation's Influencer program and receive a monthly fee for using their TradingView charts in my analysis.
✅LIKE AND COMMENT MY IDEAS✅

GBP/USD Pulls Back After Rejection – Buyers Eye Lower LevelsHi everyone,
GBP/USD failed to break above the 1.37500 level and saw a rejection from that resistance, dropping further below the 1.36850 support. Since then, price has consolidated and ranged beneath this level.
Looking ahead, if price remains within this range, we anticipate a move lower to find buying interest between the 1.35300 and 1.34600 levels, which could set the stage for another push higher.
As previously noted, a decisive break above 1.37500 would renew our expectation for further upside, with the next key target around 1.38400. We'll be monitoring price action closely to see how it unfolds.
We’ll continue to provide updates on the projected path for GBP/USD as price approaches this target.
The longer-term outlook remains bullish, and we expect the rally to continue extending further from the 1.20991 January low towards 1.40000 and 1.417000.
We’ll be keeping you updated throughout the week with how we’re managing our active ideas. Thanks again for all the likes/boosts, comments and follows — we appreciate the support!
All the best for the week ahead. Trade safe.
BluetonaFX

GBPUSD BUILDING TARGET GBP/USD Technical Analysis – 4H Timeframe (July 9, 2025)
This chart shows a technical analysis of the British Pound (GBP) versus the US Dollar (USD) on the 4-hour timeframe. The market is currently trading within a well-defined range, with a strong support zone (highlighted in purple) and a clear resistance level (marked in blue).
Key Levels:
Support Zone: 1.33700 – 1.34400
This zone has been tested multiple times and has acted as a strong demand area, where price has often reversed to the upside.
Current Price: 1.35991
The price is currently above the support zone but showing signs of bearish pressure.
Resistance / Target Point: 1.37921
This level has acted as a strong resistance in the past. If the price reverses from the support zone, this is the likely target point.
Analysis Summary:
The price is expected to drop down toward the support zone around 1.34000.
A bullish reversal is anticipated from this area.
If the reversal happens, the price may rally toward the target level at 1.37921.
Trading Perspective:
Buy Zone: Around 1.34000 (within the purple support box)
Target Zone: Around 1.37921
Suggested Stop-loss: Just below the support zone (e.g., around 1.33500)
