GBPUSD MARKET OUTLOOK!GBPUSD Price just dropped lower following the recent release in US NFP report. Therefore I anticipate a bullish price action to develop away from 1.3500 and 1.3400 level
We’re still looking forward to seeking more bullish price action developments
GBPUSD trade ideas

GBPUSD SELL 1.3762On the 4-hour chart, GBPUSD is currently oscillating. Currently, we can focus on the upper 1.3762 area, which is a potential short position of the bearish bat pattern, and this position is in the previous supply area.

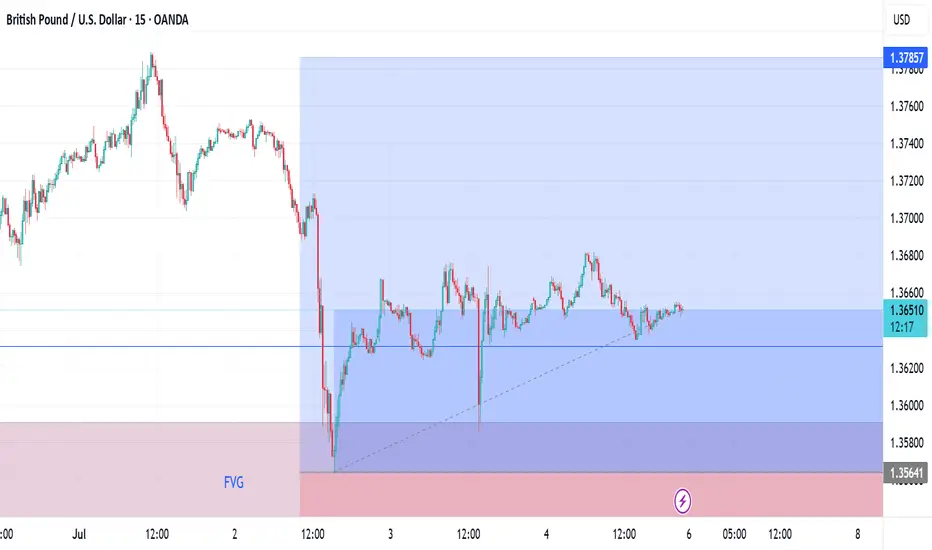
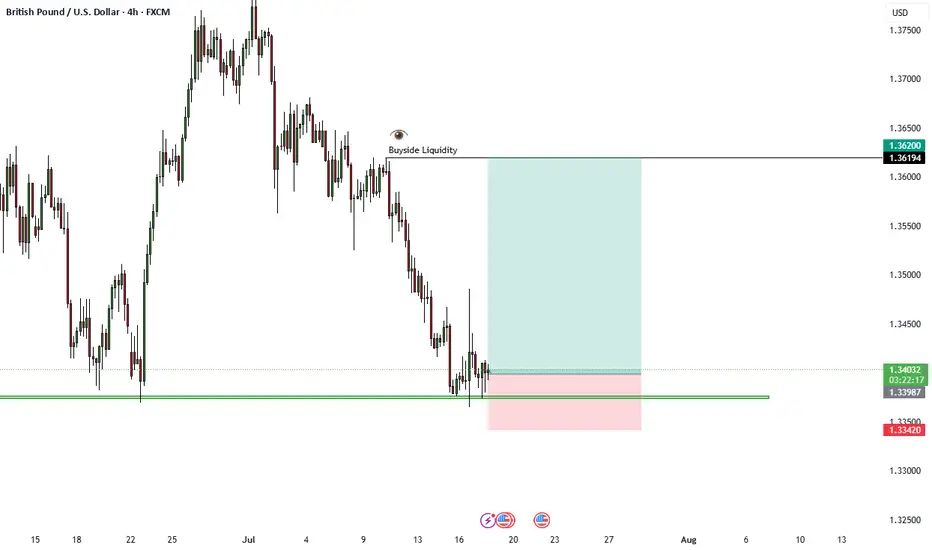
Longs on GBPUSDPrice tapped into the midpoint of the FVG which initial move cleared liquidity, gave an OB and pushed higher, we're expecting price to push to the next DOL
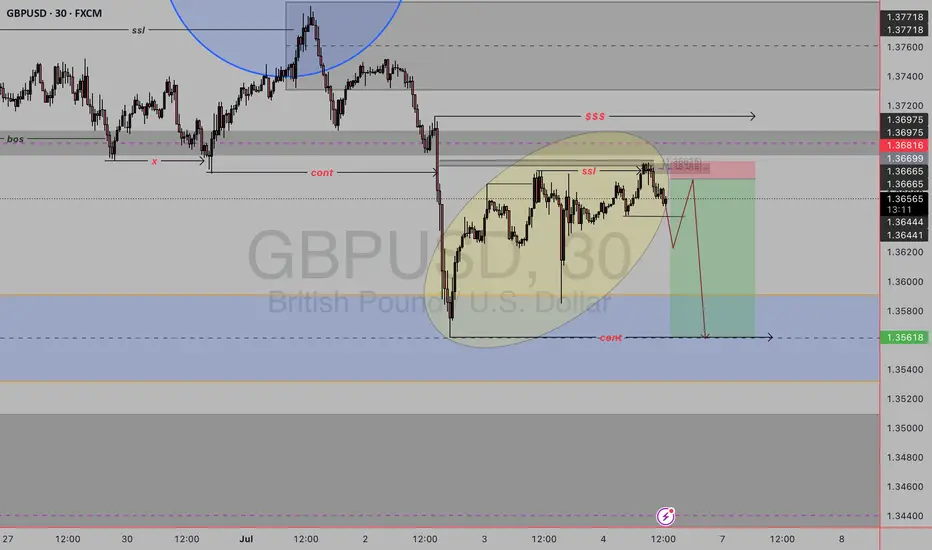
sell gbpusdAs noted there we are in a downtrend as price is breaking lows and forming lower lows but looking at weekly we are currently bullish having a retracement meaning this is a counter trend following the retracement no high has been broken to continue the trend and i see ssl liquidity swept on ltf waiting for trans and reteracement to my liquidity area to take sells but if no tr no trade
GBPUSD DAILY TIMEFRAME ANALYSIS -Bullish Continuation setupChecking my previous analysis which I published we can see that GBPUSD price action retraced to our desired entry which I indicated with a colored rectangle now we are expecting more bullish price action

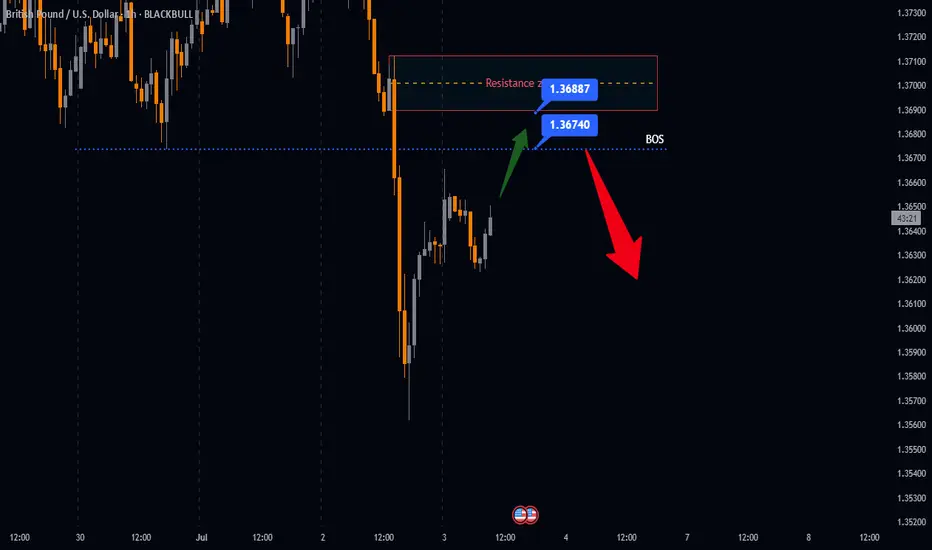
GBPUSD Possible Sell setupsAnalysing GBPUSD price action from yesterday we saw GBPUSD break below 1.36737 and the bearish pressure continued to rally towards 1.35620. If GBPUSD hold below our resistance zone further downside price action should expected. The anticipation is that price will make a correction towards and target levels being:
Sell levels 1.36887 - 1.36740
Targets levels 1.36232 - 1.36232
GBP/USDPrice action trading is a methodology in financial markets where traders make decisions based on the actual price movements of an asset over time, rather than relying heavily on technical indicators or fundamental analysis. It involves observing and interpreting patterns and trends in price charts to predict future price movements.

The scenario ahead..Hello friends...
The marked areas are important ranges for this currency pair.
You can look for confirmation for trading in these areas, and if you are a new trader, the market trend is bullish. Try to make buy trades, rather than sell trades.
If you like these analyses, support our team page, and we will also be happy if you tell us your opinion.


Sell idea!Hello all. price enter a very special but difficult to recognize level and it can push the price lower. be happy. put your SL a little above my level. it is so tight.(wink)

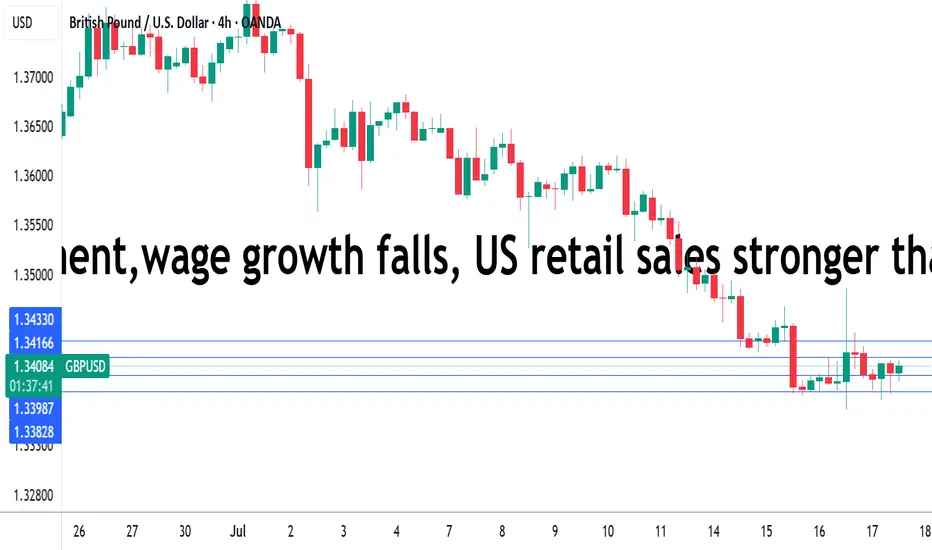
UK employment,wage growth falls, US retail sales shineThe British pound showing limited movement on Thursday. In the North American session, GBP/USD is trading at 1.3406, down 0.09% on the day.
Today's UK employment report pointed to a cooling in the UK labor market. The number of employees on company payrolls dropped by 41 thousand in June after a decline of 25 thousand in May. Still, the May decline was downwardly revised from 109 thousand, easing concerns of a significant deterioration in the labor market.
Wage growth (excluding bonuses) dropped to 5.0% from a revised 5.3%, above the market estimate of 4.9%. The unemployment rate ticked up to 4.7%, up from 4.6% and above the market estimate of 4.6%. This is the highest jobless level since the three months to July 2021.
The latest job data will ease the pressure on the Bank of England to lower rates, as the sharp revision to the May payroll employees means the labor market has not deteriorated as much as had been feared. Still, the employment picture remains weak and the markets are expecting an August rate cut, even though UK inflation was hotter than expected in June.
US retail sales bounced back in June after back-to-back declines. Consumers reacted with a thumbs-down to President Trump's tariffs, which took effect in April and made imported goods more expensive.
The markets had anticipated a marginal gain of just 0.1% m/m in June but retail sales came in at an impressive 0.6%, with most sub-categories recording stronger activity in June. This follows a sharp 0.9% decline in May.
The US tariffs seem to have had a significant impact on retail sales, as consumers continue to time their purchases to minimize the effect of tariffs.
Consumers increased spending before the tariffs took effect and cut back once the tariffs were in place. With a truce in place between the US and China which has slashed tariff rates, consumers have opened their wallets and are spending more on big-ticket items such as motor vehicles, which jumped 1.2% in June.


Pound Retreats Despite UK Inflation SurpriseGBP/USD slipped to 1.3390 during Thursday’s session, paring gains as investors await UK labor data. Strong UK inflation figures may support a hawkish BoE stance, though August’s rate decision could be shaped by slowing labor conditions.
On the U.S. side, rising CPI has reinforced expectations for the Fed to hold rates steady. Fed officials Logan and Williams pointed to tariff-related inflation risks, while the Fed’s Beige Book reported solid activity but growing cost pressures.
June PPI came in flat, while core PPI slowed to 2.6% YoY. U.S. retail sales, jobless claims, and the Philly Fed index are next on watch.
Resistance is at 1.3535, while support holds at 1.3380.
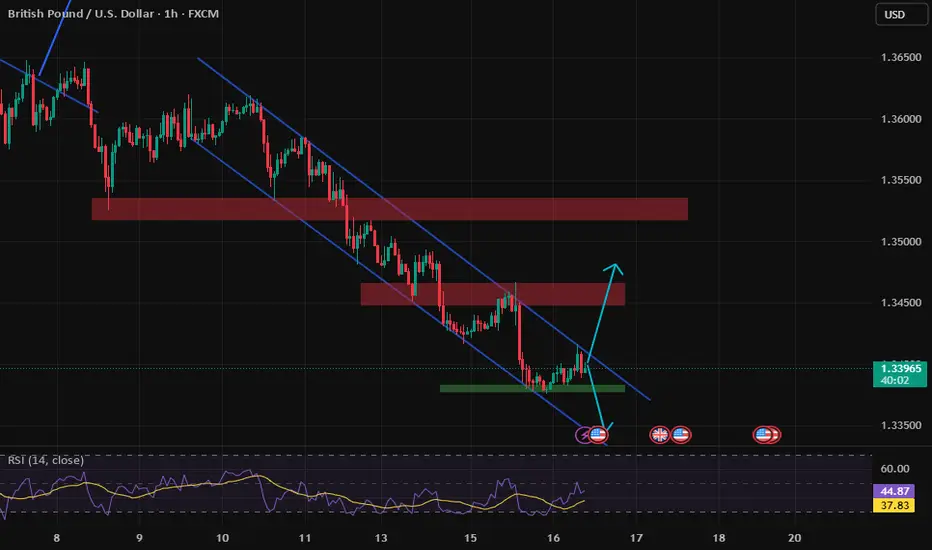
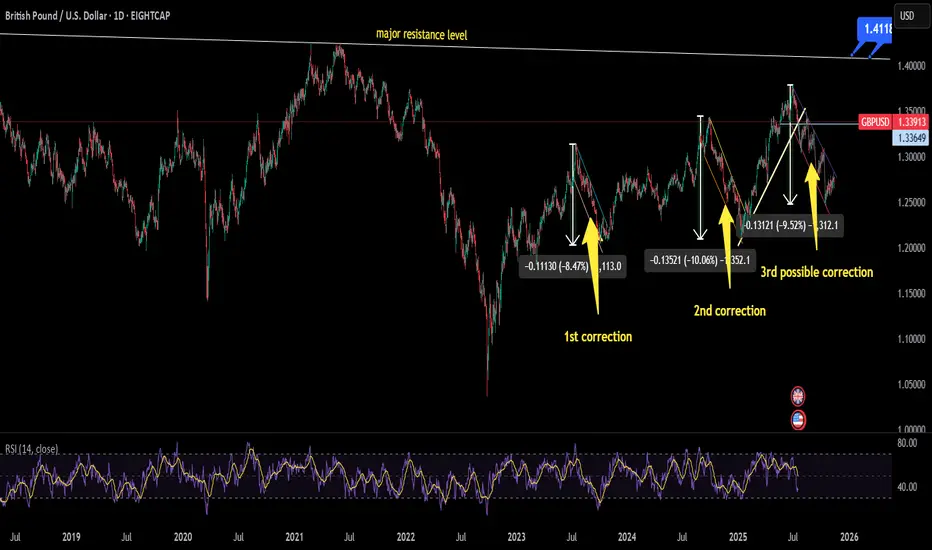
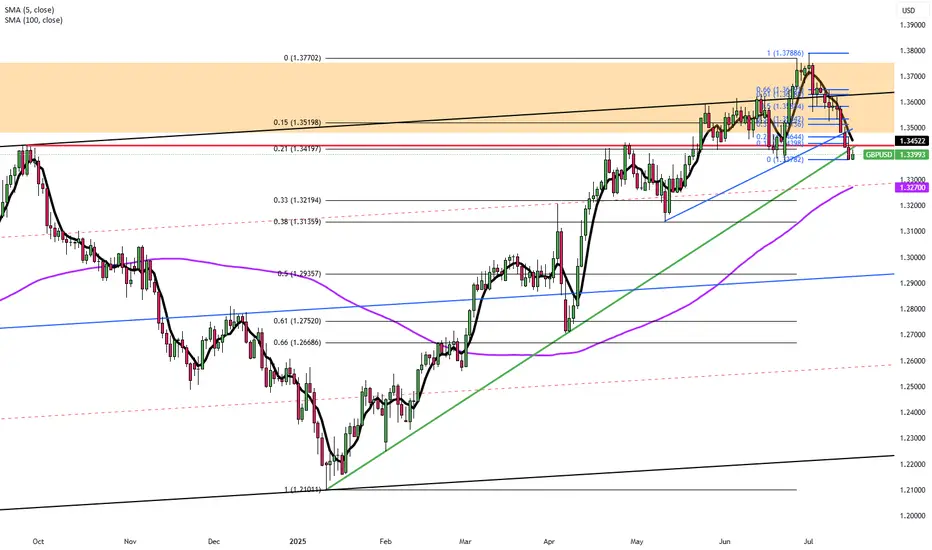
will GBPUSD make its 3rd correction???currently price is testing marked trendline which is acting as support level for a decent time if this level price will reverse its trend from here and will hit major resistance level which also has been drawn but if price action follows what it has done twice in the past then chances are that trend will enter in correction phase which is 3rd phase. In all this movement of DXY will play major role if DXY will continue to move upward pair will follow bearish trend and vice versa
GBPUSD ANALYSIS After seeing the market react to key are of support yesterday and a retrace of a 100% on the Fibonacci seller are still in control of the market a break below support and retest for further sells could occur

GBP USD LONG RESULT Price broken down the support of the falling bearish wedge it was in and then formed a minor falling wedge pattern indicating signs for upward movement, but I knew price would still move to the demand zone before further upsides, which is why I setup the entry at the order block to the Rising channel Support (Schematics) and price moved just as Predicted to Profit.
_THE_KLASSIC_TRADER_.🔥🤲🙏

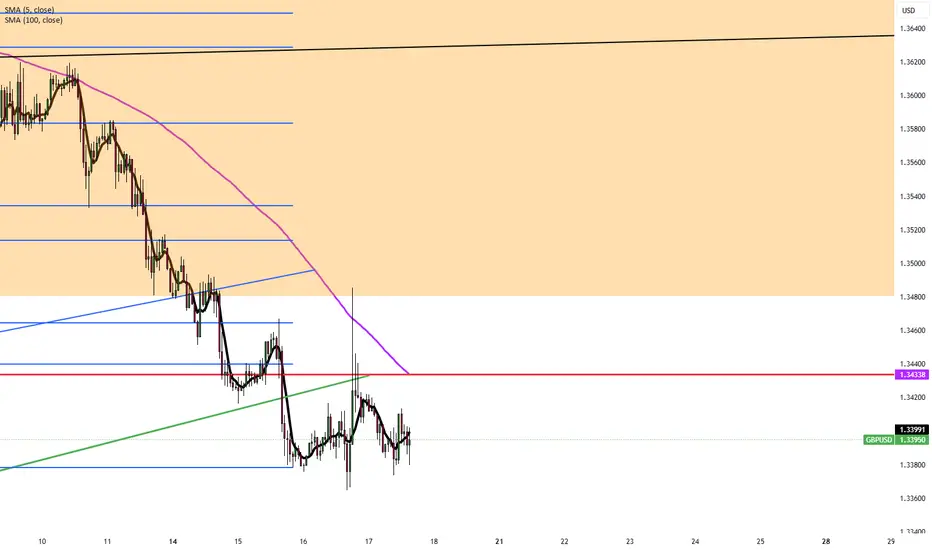
GBPUSD(20250717)Today's AnalysisMarket news:
The annual rate of PPI in the United States in June was 2.3%, lower than the expected 2.5%, the lowest since September 2024, and the previous value was revised up from 2.6% to 2.7%. Federal Reserve Beige Book: The economic outlook is neutral to slightly pessimistic. Manufacturing activity declined slightly, and corporate recruitment remained cautious.
Technical analysis:
Today's buying and selling boundaries:
1.3423
Support and resistance levels:
1.3544
1.3499
1.3470
1.3377
1.3348
1.3303
Trading strategy:
If it breaks through 1.3423, consider buying, and the first target price is 1.3470
If it breaks through 1.3377, consider selling, and the first target price is 1.3348

VMS STRATEGYI hate the days when I get beat up… but I love the days when the wins come in.
What I’ve learned over time is that you need a system you can trust through both.
Here’s a basic overview of the VMS strategy I created through countless good and bad days. It’s a rule-based swing trading strategy I use on the 4-hour chart, and after studying thousands of patterns, I’ve found these setups repeat themselves consistently — across 22 Forex pairs.
VMS Strategy (Created by Darl Wright)
PULLBACK SETUPS:
Must have made a previous high/low before the pullback
Pullback must enter a strong Support/Resistance zone
Must produce an engulfing candle in trend direction
Price action must be near the 50 EMA
Volume trigger must be:
– Stronger than previous opposite candle or
– Two same-color volume candles in a row
Momentum must be above/below 0 and hooking in trend direction
If the setup is valid, drop to the 1H chart to mark SL and TP
SL: Just outside the swing high/low ± ATR (to avoid “equity grabs”)
TP: Previous price level (subjective), but always 2:1 R/R minimum
Feel free to backtest the VMS and make it your own.
I’ll keep posting live trades — wins and losses — using only this system.
If this helps even one person gain clarity or consistency, mission accomplished.
Wishing all of you success — whatever your strategy may be.
— Darl Wright

Pound Pressured by BoE Dovish ToneGBP/USD held around 1.3430–1.3435, just above a three-week low, with traders awaiting US CPI data for further clues on dollar direction. UK economic data remains soft, and BoE Governor Bailey signaled that deeper rate cuts may be on the table if the labor market weakens further. He emphasized growing economic slack, which could help bring inflation down. Meanwhile, a slight dollar pullback provided limited relief to the pair.
Resistance is at 1.3500, while support holds at 1.3380.
GBP-USDWatch for buy with the breakout of the descending trendline, sell with the breakout of support