The Day Ahead China – June Trade Balance
Exports rose 5.8% year-on-year, beating expectations, as exporters rushed to ship goods before new U.S. tariffs.
Imports increased 1.1% year-on-year, recovering slightly from a previous drop.
Trade surplus expanded to $114.7 billion from $103.2 billion in May.
Takeaway: Export strength is driven by temporary factors. Weak imports still point to fragile domestic demand.
Japan – May Core Machinery Orders & Capacity Utilisation
Core machinery orders (a key CapEx gauge) fell 0.6% month-on-month — a softer decline than expected.
Orders were still up 4.4% year-on-year.
Broader machinery orders (including volatile sectors) rose 3.8% month-on-month.
Takeaway: Capital spending is holding up, but investment is uneven. Manufacturing remains cautious amid external uncertainties.
ECB – Vujčić & Cipollone Speeches
Vujčić: Inflation is near target; further rate cuts may not be needed unless data changes. He supports a patient approach.
Cipollone: Focused on the digital euro, stressing the need for secure and inclusive payment systems.
Takeaway: The ECB is moving into a “wait-and-see” mode. The digital euro remains a strategic priority.
This communication is for informational purposes only and should not be viewed as any form of recommendation as to a particular course of action or as investment advice. It is not intended as an offer or solicitation for the purchase or sale of any financial instrument or as an official confirmation of any transaction. Opinions, estimates and assumptions expressed herein are made as of the date of this communication and are subject to change without notice. This communication has been prepared based upon information, including market prices, data and other information, believed to be reliable; however, Trade Nation does not warrant its completeness or accuracy. All market prices and market data contained in or attached to this communication are indicative and subject to change without notice.
GBPUSD trade ideas
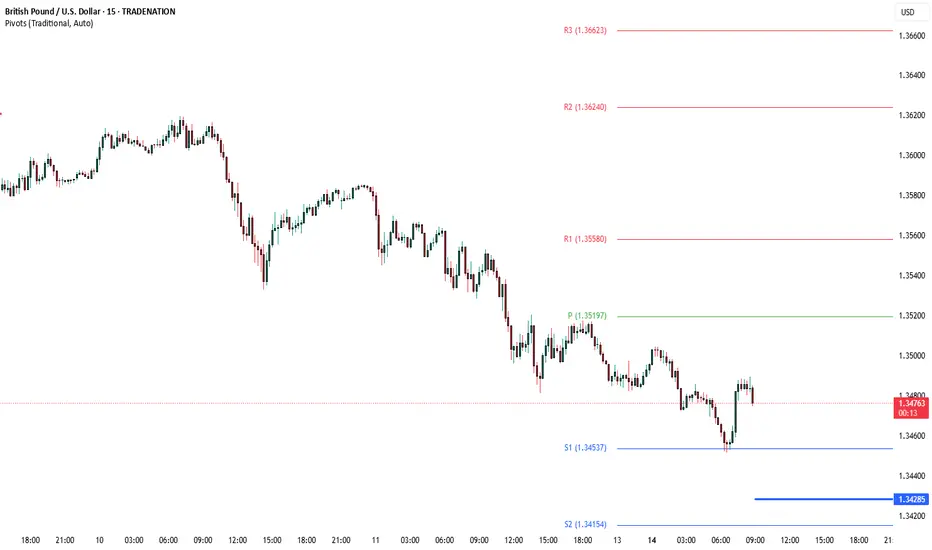
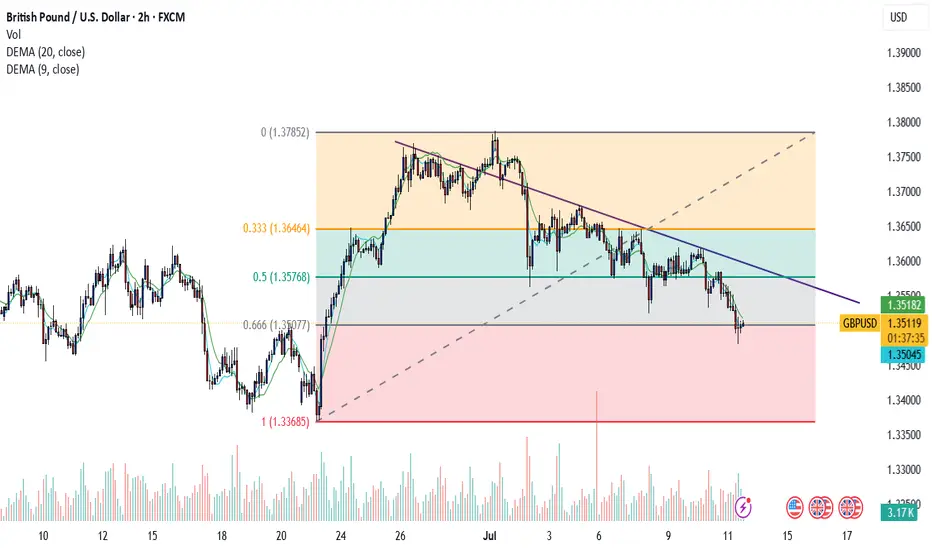
GBP/USD (GU) Weekly Outlook – July 15–19, 2025🔍 Price Enters Extreme Discount – Bounce or Breakdown?
After a clean break in structure and multiple bearish rejections, GBP/USD has entered extreme discount territory. Price is now testing a high-probability reaction zone near the weak low around 1.3440.
📊 Key Technical Zones:
🔻 Weak Low: 1.3440
🔵 1H OB (HP) below weak low: Potential liquidity draw
🔺 Retracement Targets:
0.25 = 1.3500
0.50 = 1.3535
0.75 = 1.3575
🟥 FVG resistance zone: 1.3575–1.3600
🧲 Draw on liquidity: Sub 1.3440 or PDH rejection area
🧠 Base Case:
📈 Expecting a short-term bullish reaction from the extreme discount zone
📉 Bias remains bearish overall unless structure shifts decisively
🎯 Weekly Trade Plan:
✅ Plan A: Watch for bullish CHoCH near 1.3440–1.3450
TP1: 1.3500
TP2: 1.3535–1.3575
🔁 Plan B: If price sweeps lower into OB (below 1.3440) → Look for bullish structure shift on LTF
❌ Invalidation: Sustained break and close below 1.3425 → opens path toward 1.3360s
📌 Price is deep into discount, but without confirmation there is no trade. Patience for reaction setups is key.

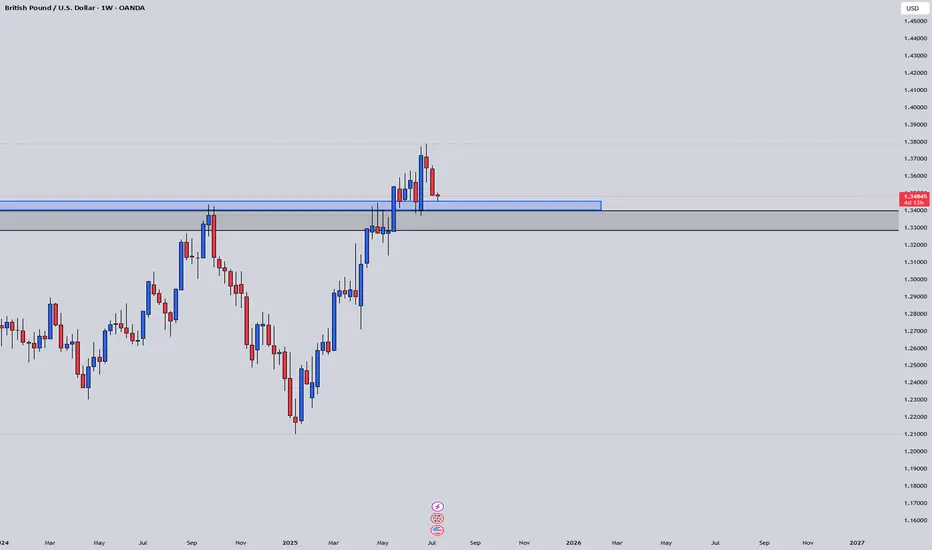
Weekly pattern 14/07/2025Monthly: strong zone around institutional candle. price closed above this candle and has retested
weekly: double pattern above monthly zone. Inverse H&S and Bullish M.
Daily: inverse H&S on daily
4H: waiting for pattern
GBPUSD power day ?I think this monday we gonna have power move for GBP , as there is many news after monday .
This is only day buyers can take advantage and after that banks will eat all of em !
GL TRADERS
NOT ADVICE !

Descending Triangle Formation (GBPUSD)Here I can see a Descending Triangle Formation. I can see all the relevant characteristics such as the 4 touches, breakout and retest. Now it’s just a waiting game to see if it plays out.

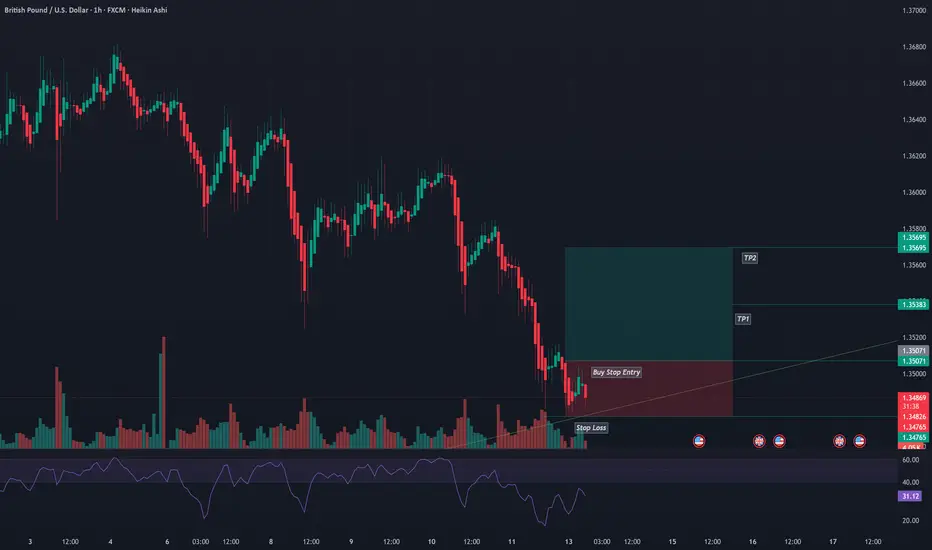
GBPUSD H1 Buy SetupHi Traders,
On the H1 timeframe, I’m observing potential signs of a trend reversal:
🔹 A double bottom has formed on the chart
🔹 Bullish divergence is visible on the RSI
These are strong reversal signals.
📌 A Buy Stop entry could be a solid opportunity if price breaks above the previous Lower High (LH).
As always, follow the trade according to your own risk-reward strategy.
Trade safe and stay disciplined!
GBPUSD| - Bullish BiasHTF Overview (4H): Strong bullish structure in play, with multiple highs being broken and momentum firmly to the upside. Price is clearly respecting bullish order flow, suggesting continuation.
MTF Refinement (30M): Identified a 30M OB aligned with the trend. Waiting for price to mitigate this zone, as it could serve as the springboard for the next impulsive leg up.
Execution Plan: Once the 30M OB is mitigated, I’ll drop to LTF (1M/5M) to watch for confirmation — CHoCH, BOS, or microstructure shift — before executing longs.
Mindset: Bull momentum is intact — patience and confirmation are key to riding it with precision.
Bless Trading!

GBPUSD is in the Selling DirectionHello Traders
In This Chart GBPUSD HOURLY Forex Forecast By FOREX PLANET
today GBPUSD analysis 👆
🟢This Chart includes_ (GBPUSD market update)
🟢What is The Next Opportunity on GBPUSD Market
🟢how to Enter to the Valid Entry With Assurance Profit
This CHART is For Trader's that Want to Improve Their Technical Analysis Skills and Their Trading By Understanding How To Analyze The Market Using Multiple Timeframes and Understanding The Bigger Picture on the Charts

gbp usd bearish flag emergingits like an emerging bearish flage yet to hit the top one more time i expect , since no major news today it can be a valid setup

cup and handle emerging exprimentalthese are just experimental ideas. help me with what you think. and hope you profit today ...

GBPUSD 1D Analysis on a bullish outlookSmaller time frames are bearish, looking for a turn on bullish to match the higher time frames, 1D bullish OB touch then reverting for the 1D Bearish FVG

GBPUSD LONG TERM GBPUSD Live Trading Session/ GBPUSD analysis #forex #forextraining #forexHello Traders
In This Video GBPUSD HOURLY Forecast By World of Forex
today GBPUSD Analysis
This Video includes_ (GBPUSD market update)
GBPUSD Analysis today | Technical and Order Flow
#usdjpy #usdchftechnicalanalysis #usdjpytoday #gold
What is The Next Opportunity on GBPUSD Market
how to Enter to the Valid Entry With Assurance Profit?
This Video is For Trader's that Want to Improve Their Technical Analysis Skills and Their Trading By Understanding How To Analyze The Market Using Multiple Timeframes and Understanding The Bigger Picture on the Charts.
Disclaimer: Financial Trading Has Large Potential Rewards, But Also Large Potential Risk. You must be aware of the Risk and Be Welling to Accept Them in order to Trade the Financial Market . Please be Carefully With Your Money.
We are talking about future market, anything can Happen,Markets are Always like that.dnt Risky more Than 2% of your account
Now you can join with our "vip premium" service
Join us and let's make trading together

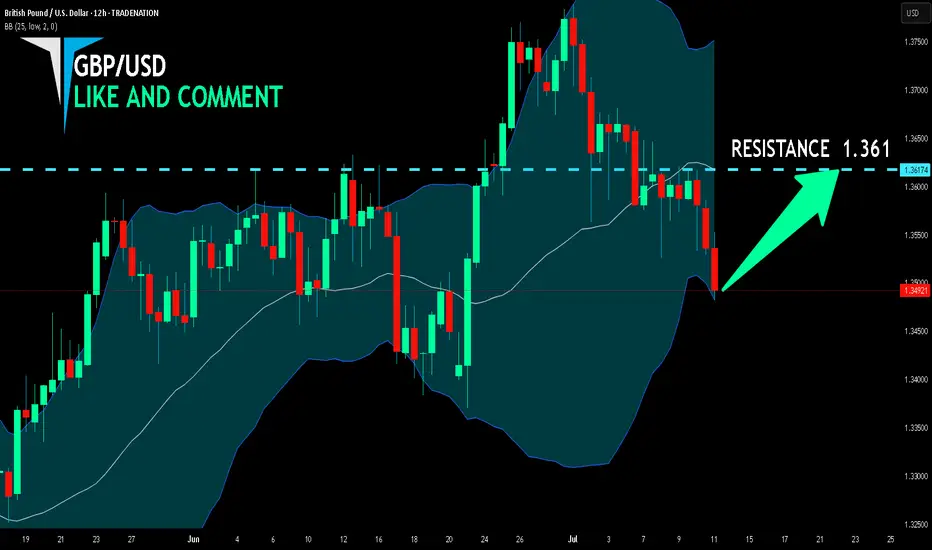
GBP/USD BULLS ARE GAINING STRENGTH|LONG
Hello, Friends!
It makes sense for us to go long on GBP/USD right now from the support line below with the target of 1.361 because of the confluence of the two strong factors which are the general uptrend on the previous 1W candle and the oversold situation on the lower TF determined by it’s proximity to the lower BB band.
Disclosure: I am part of Trade Nation's Influencer program and receive a monthly fee for using their TradingView charts in my analysis.
✅LIKE AND COMMENT MY IDEAS✅
GBPUSD BuyAs we earlier analysed and patiently waited for the price to get to our Zone for days etc.
Now,the market is ready to go "LONG".
Who is with me ?
Let's deal with GPBUSD 1HTF

STRONG BUY BRITISH POUNDits getting close from the 33 line of the fibo and its creating a bullish engolfing , take your position tight
GBPUSD bearish continuation for expect
FX:GBPUSD strong bearish pushing, we can see BEARISH FLAG pat and trend line breaked, here still strong bearish to expect till TPs.
SUP zone: 1.35500
RES zone: 1.33850, 1.33400


GBP USD SHORT RESULT Trend was still overall bearish and ongoing a minor pullback to continue downward movement also formed an ascending wedge pattern on the pullback which is also a strong indicator of bearish movement.
With all the conflunce above is why I took the short and it moved perfectly as predicted 🔥💪👌🎯
_THE_KLASSIC_TRADER_.🔥

GBPUSD - 1H - 95% PredictionGBPUSD - 1H
Bumping to 5 minutes order block and then dumping to create new lower low.

GBP USD SHORT RESULT Price is in an overall bearish trend and also created a double top pattern at 4HTF Bearish Trendline and also holding minor resistance Trendline.
With all this Confluence was why I decided to open the Short position at the order block. Price just missing the set entry before rolling down to TP.
Better Set-ups to come 🔥💪
_THE_KLASSIC_TRADER_.

GBP/USD FUNDAMENTAL ANALYSISGBP/USD holds its winning streak for the fourth successive session, trading above 1.3700 in the European session on Thursday. The pair hangs close to three-year highs amid sustained US Dollar weakness, in light of US President Trump's fresh attack on the Fed's credibility. US data and BoE-speak awaited.

GBPUSD July Playbook: Bearish Setup at Channel High GBPUSD just printed a CC SELL signal right at the top of its rising channel — setting the stage for a potential July pullback.
📌 Breakdown using Vinnie’s Trading Cheat Code System:
✅ RSI Overbought zone triggered
✅ CC Sell + Confirm Sell combo at channel resistance (~1.38)
✅ Price stretched far above the mean with no higher timeframe support nearby
✅ MACD histogram rolling over — momentum shift in play
🎯 Targets:
1.3500 (channel median / recent base)
1.3280 (deeper support / previous Confirm Buy area)
This looks like a textbook trap-the-buyers setup. Patience on the entry — I’ll be stalking rallies to sell into.
🧠 Tools Used:
Vinnie’s Confirm Alerts
CC Trend Indicator
RSI OB/OS Scanner
MACD HPS Screener
Following this closely — could be one of the cleanest short opportunities of the month.

