DeGRAM | GBPUSD preparing for a correction📊 Technical Analysis
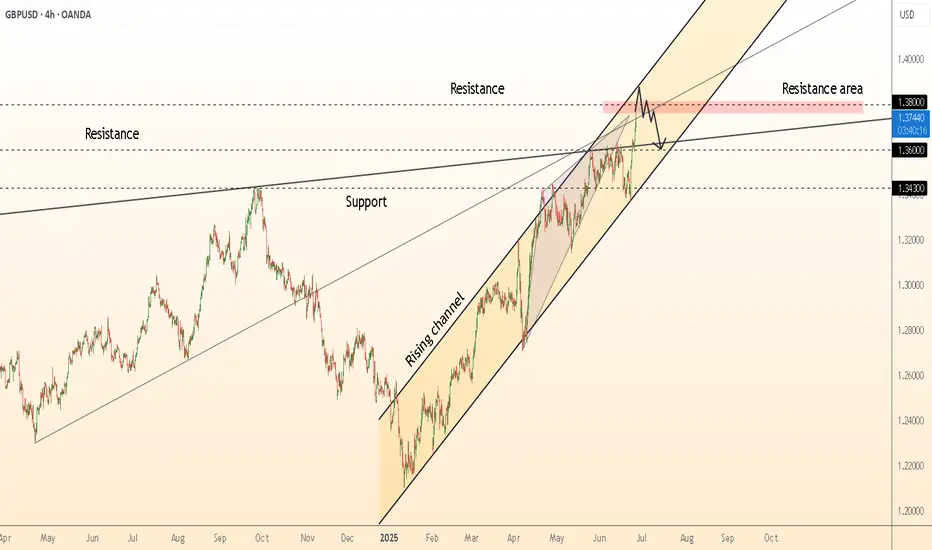
● Cable is pressing the rising-channel ceiling together with the March swing-high supply at 1.378-1.380; successive long-upper-wicks plus fading 4 h RSI signal bull exhaustion at this dual resistance.
● A tiny evening-star has formed inside the pink resistance band and price is slipping back under the broken inner trend-line; first objective is the former breakout shelf / median line near 1.360, with the lower rail and April pivot at 1.343 next in view.
💡 Fundamental Analysis
● UK election blackout, soft retail-sales surprise and firmer month-end USD funding bids narrow the short-rate gap again, sapping fresh sterling demand.
✨ Summary
Short 1.374-1.380; sustain below 1.360 opens 1.343. Bear view void on a 4 h close above 1.380.
-------------------
Share your opinion in the comments and support the idea with a like. Thanks for your support!
GBPUSD trade ideas
NFP DAY! Could we see a bullish bounce in London?Morning everyone,
Forecasting a potential bullish leg this morning towards the 1h order block area, a retracement of yesterdays bearish leg.
Kind regards,
Aman | SMC Wolf FX

GU-Thu-03/07/25 TDA-UK political turmoil triggers market selloffAnalysis done directly on the chart
Follow for more, possible live trades update!
I often share my live trades in Tradingview public chat in London session, stay tuned!
I don't give signals blindly, people should learn
and understand the skill.
Following blindly signals you won't know how to
manage the trade, lot size and replicate the move
over time.
That's why you need active real time discussions.
Trading is not get rich quick scheme!
Active in London session!
Not financial advice, DYOR.
Market Flow Strategy
Mister Y

GBPUSD TRADE IDEA We're looking out for a trade on GBPUSD.
We await a pullback to the downside for a continuation in the original upward movement of the market
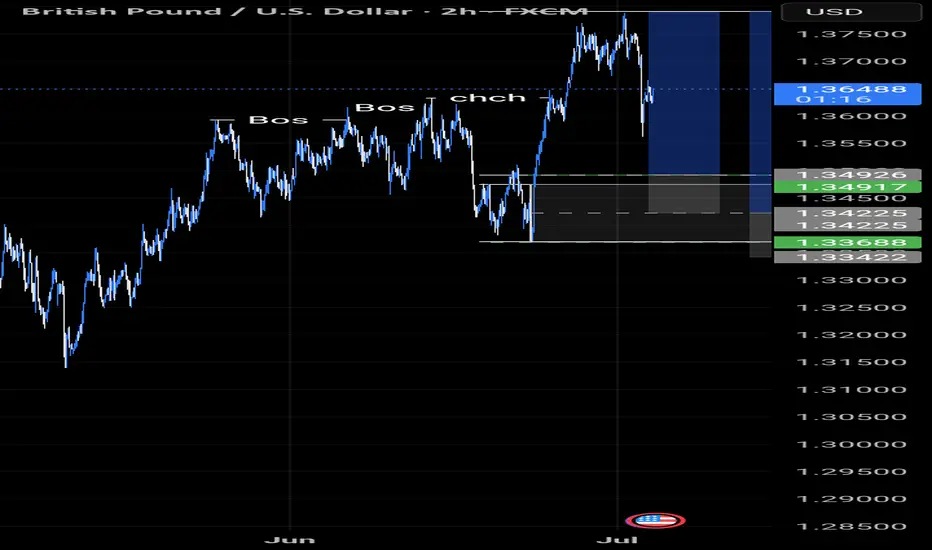
GBPUSD 30m – Elliott Wave + AO ConfirmationPrice is currently testing the 1.36277 zone. I’m closely monitoring for a break of structure below this level. If it breaks, I’ll be watching for a pullback setup to short, ideally aligning with BBMA/EMA confluence.
The wave structure looks clean:
• ✅ Wave (1), (2), (3), and (4) are completed.
• ✅ AO histogram also confirms momentum waves (1) to (4), with the current move likely to complete Wave (5) to the downside.
• 🔻 Wave (4) retraced into the previous imbalance zone and respected resistance, giving further confluence for bearish continuation.
Looking to target below 1.3500 for Wave (5) completion.
Key Levels to Watch:
• 🔑 Break below 1.36277 = Bearish confirmation
• 🎯 Potential TP Zone: 1.3450 – 1.3425
• 🚫 Invalidation if price closes above 1.3700 with momentum
Let’s see how price reacts at this key level 👀
#GBPUSD #ElliottWave #AO #PriceAction #BreakOfStructure #TradingView

Gbpusd short idea I like the daily bearish momentum to the down side.
Not trying to pick the top or anything but I think will will see a follow through.
I like one of the nearest internal range liquidity pool depicted with green line.
Let's see how it goes!

GBPUSD InsightHello to all subscribers,
Please feel free to share your personal opinions in the comments. Don’t forget to hit the booster and subscribe!
Key Points
- According to the ADP National Employment Report, U.S. private employment in June decreased by 33,000 compared to the previous month — the first negative figure since March 2023. This has strengthened expectations for interest rate cuts.
- U.S. President Donald Trump announced that a trade agreement has been reached with Vietnam. Reportedly, Vietnam has agreed to significantly lower its tariffs to 20% in exchange for opening its market. This has raised hopes for progress in ongoing trade negotiations with other countries.
- The EU trade team is currently in Washington, D.C., negotiating with the U.S. side and is reportedly requesting preemptive tariff exemptions in certain sectors.
- In the U.K., the welfare reform plan proposed by the Labour government has been significantly scaled back. Prime Minister Keir Starmer has not confirmed his confidence in Chancellor Rachel Reeves, leading to growing speculation that she may be replaced. If Reeves — who has emphasized fiscal discipline — is replaced, there are concerns that fiscal control could loosen.
Key Economic Events This Week
+ July 3: U.S. Non-Farm Payrolls (June), U.S. Unemployment Rate (June)
GBPUSD Chart Analysis
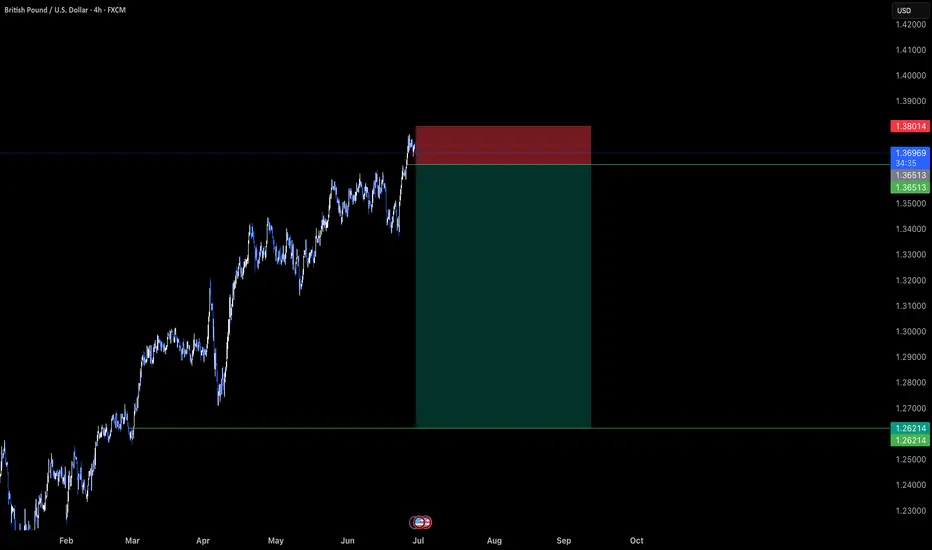
After maintaining an upward trend, GBPUSD experienced a sharp drop. However, the pair appears to have regained its bullish momentum with support from the trendline. The upward view will be maintained toward the resistance level of 1.40000, the trend’s previous high.
That said, caution is advised near the 1.38000 level, where the previous sharp decline occurred, as this zone could introduce volatility.

Sell to Buy ModelTho the sell hit sl but still went according to plan. Still Bullish and holding this buy for NFP happening tomorrow

Political Uncertainty, Dollar Weakness & A Projected CorrectionDespite being a technical trader, there are some fundamental factors floating in the background of today's trading idea.
1) We saw weakness on the GBP today due to some political uncertainty & investors having concerns over the stability of the UK's leadership and economic direction.
2) We saw a drop in the ADP Non-Farm Employment Change for the US Dollar today which is starting to look like a trend rather than a one-off.
Why this is important is because, despite the very bearish day that the FX:GBPUSD had today, I don't think the GBP reaction is as relevant as it's shown and I do think the USD is weaker than it's shown on this particular chart, due to the reactions that we've seen on other crosses.
All in all, that this means is that I wouldn't be shocked to see today's move corrected and price is at the perfect technical level to do just that.
If you have any questions, comments or opinions, please don't hesitate to leave them below.
Akil

Bearish reversal off 50% Fibonacci resistance?The Cable (GBP/USD) is rising towards the pivot and could drop to the 1st support.
Pivot: 1.3681
1st Support: 1.3595
1st Resistance: 1.3746
Risk Warning:
Trading Forex and CFDs carries a high level of risk to your capital and you should only trade with money you can afford to lose. Trading Forex and CFDs may not be suitable for all investors, so please ensure that you fully understand the risks involved and seek independent advice if necessary.
Disclaimer:
The above opinions given constitute general market commentary, and do not constitute the opinion or advice of IC Markets or any form of personal or investment advice.
Any opinions, news, research, analyses, prices, other information, or links to third-party sites contained on this website are provided on an "as-is" basis, are intended only to be informative, is not an advice nor a recommendation, nor research, or a record of our trading prices, or an offer of, or solicitation for a transaction in any financial instrument and thus should not be treated as such. The information provided does not involve any specific investment objectives, financial situation and needs of any specific person who may receive it. Please be aware, that past performance is not a reliable indicator of future performance and/or results. Past Performance or Forward-looking scenarios based upon the reasonable beliefs of the third-party provider are not a guarantee of future performance. Actual results may differ materially from those anticipated in forward-looking or past performance statements. IC Markets makes no representation or warranty and assumes no liability as to the accuracy or completeness of the information provided, nor any loss arising from any investment based on a recommendation, forecast or any information supplied by any third-party.

Bullish bouce off major support?GBP/USD has bounced off the support level which is an overlap support that lines up with the 38.2% Fibonacci retracement and could rise from this level to our take profit.
Pivot: 1.3609
Why we like it:
There is an overlap support level which lines up with the 38.2% Fibonacci retracement.
Stop loss: 1.3534
Why we like it:
There is a pullback support that is slightly above the 61.8% Fibonacci retracement.
Take profit: 1.3750
Why we like it:
There is a pullback resistance.
Enjoying your TradingView experience? Review us!
Please be advised that the information presented on TradingView is provided to Vantage (‘Vantage Global Limited’, ‘we’) by a third-party provider (‘Everest Fortune Group’). Please be reminded that you are solely responsible for the trading decisions on your account. There is a very high degree of risk involved in trading. Any information and/or content is intended entirely for research, educational and informational purposes only and does not constitute investment or consultation advice or investment strategy. The information is not tailored to the investment needs of any specific person and therefore does not involve a consideration of any of the investment objectives, financial situation or needs of any viewer that may receive it. Kindly also note that past performance is not a reliable indicator of future results. Actual results may differ materially from those anticipated in forward-looking or past performance statements. We assume no liability as to the accuracy or completeness of any of the information and/or content provided herein and the Company cannot be held responsible for any omission, mistake nor for any loss or damage including without limitation to any loss of profit which may arise from reliance on any information supplied by Everest Fortune Group.

GBPUSD I Weekly CLS I Model 1 I Target 50%Hey, Market Warriors, here is another outlook on this instrument
If you’ve been following me, you already know every setup you see is built around a CLS Footprint, a Key Level, Liquidity and a specific execution model.
If you haven't followed me yet, start now.
My trading system is completely mechanical — designed to remove emotions, opinions, and impulsive decisions. No messy diagonal lines. No random drawings. Just clarity, structure, and execution.
🧩 What is CLS?
CLS is real smart money — the combined power of major investment banks and central banks moving over 6.5 trillion dollars a day. Understanding their operations is key to markets.
✅ Understanding the behavior of CLS allows you to position yourself with the giants during the market manipulations — leading to buying lows and selling highs - cleaner entries, clearer exits, and consistent profits.
📍 Model 1
is right after the manipulation of the CLS candle when CIOD occurs, and we are targeting 50% of the CLS range. H4 CLS ranges supported by HTF go straight to the opposing range.
"Adapt what is useful, reject what is useless, and add what is specifically your own."
— David Perk aka Dave FX Hunter ⚔️
👍 Hit like if you find this analysis helpful, and don't hesitate to comment with your opinions, charts or any questions.

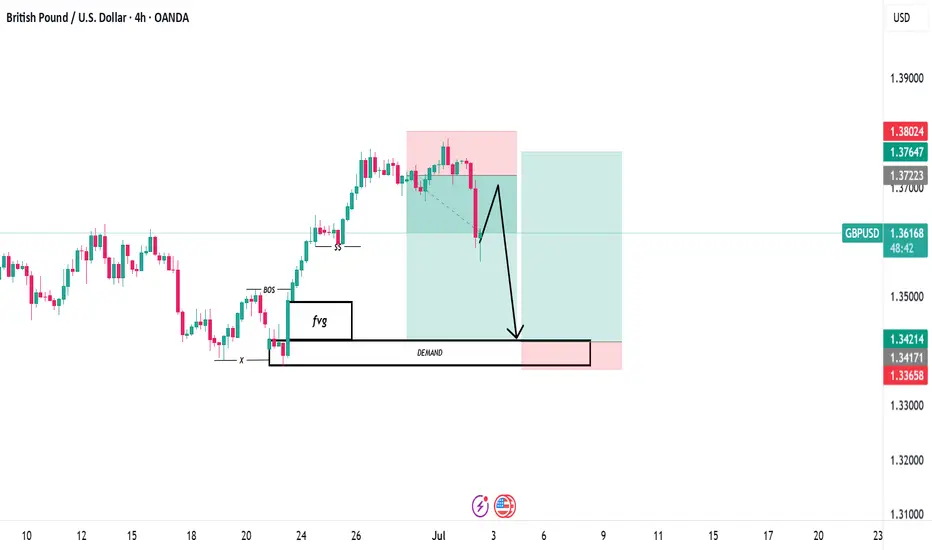
Excepting a bullish movement on GBPUSD H4GBPUSD has been on a strong bullish momentum for months now, though having some correctional moves. GBPUSD gave two demand zones, forming a rally base rally, given a buy signal (bullish pin bar) on H4,we expect a bullish run to the first resistance before any corrections.

skraaaaaa!!!check my previous post and you will see the before of this trade and a comprehensive explanation of my bias and analysis knowledge truly is power want learn SMC concept reach out to me and get a comprehensive understanding today
GBPUSD sweep of lowGBPUSD sweep of low reclaim of low and respecting liquidity aree take to weekly high cautiously after that short of lifetime


GBPUSD opportunity to go SHORTThe pair has been showing weakness for some time through RSI divergence.
On hourly chart it printed the indecision candle followed by two red candles. This gives us the cue for bearish momentum.
Since we need multiple reasons to short sell so we identify the recent low and if the price goes lower than this than we initiate a short trade.
For ready reference the TPs have been marked on chart.
wishing you a PROFIT-able trading.

GBP/USD Made A Double Top Pattern , Short After Breakout ? Here is my opinion on GBP/USD 4H Chart , we have a reversal pattern ( Double Top ) but until now we have not a closure below neckline ,so i`m waiting for 4H Closure below it to confirm the pattern and hen we can sell it , if we have not a closure below then this idea will not be valid .

GBPUSD-SELL strategy 6 hourly chart Reg.ChannelThe pair is overbought considering the longer time frames. we are still positive on indicators short-term, so we seek a SELL level rather than rushing in.
Strategy SELL @ 1.3760-1.3790 and take profit near 1.3617.

GBPUSD - OUTLOOK This is my technical perspective on GBPUSD.
Fundamentally expecting the Dollar to strengthen in the coming weeks
"May fortune attend thee, and thy trade prosper." .......L2Earned
DOLLAR DIPS AHEAD OF JOB REPORT, GBP/USD TECHNICAL OUTLOOK.Global markets rose on Wednesday, with the dollar hovering near a three-year low of 96, as investors considered the increasing likelihood of US interest rate reduction and the push for trade agreements ahead of President Donald Trump's July 9 tariff deadline.
Meanwhile on the radar, the U.S. official Job report would be on the wire later this week and as always, market participants would keenly pay attention to the reading which would give critical gauge of the labor market strength vis a vis the health of the economy. In view of the upcoming report, a strong report could reinforce confidence in the economy while a mixed print may reignite concerns over the slowing growth.
GBP/USD TECHNICAL OUTLOOK
GBP/USD tested 1.3788 on Tuesday, its highest level since 1st of November 2021(approximately 44 months). However, the bears struggled to push prices before the close of the day.
Looking at the daily chart, the broader market structure remains bullish with price bouncing off the trendline multiple times hence acting as a dynamic support.
The pair is currently retracing, with potential target towards 50 level of the Fib. at 1.3588 which would likely act as a minor support, whereas a break below the 50 level would likely usher sellers to the next potential target around 78.6 level of 1.3469. Meanwhile, a break below 1.3380 would mean absolute BOS and then would signal that bearish momentum has prevailed hence sellers would potentially target 1.3176.
On the flip side, if bulls regain control near the trendline or within the Fibonacci zones, the key upside target remains the previous high at 1.3788, followed by a push toward the psychological 1.3800 barrier according to analysts. Breakouts in either direction remain possible in the coming weeks, especially amid heightened volatility and key macroeconomic drivers.

GBPUSD - Trade Idea for Today ! Hurry Up !Details on chart. There some important levels here and we might see a downward move here.
CMCMARKETS:GBPUSD FX:GBPUSD OANDA:GBPUSD FX_IDC:GBPUSD

