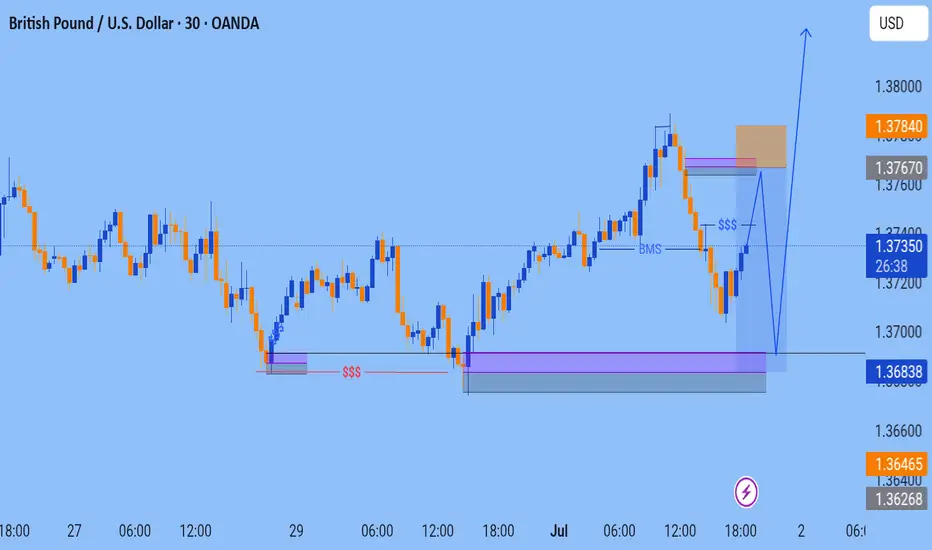
GBPUSD BullishWe are expecting a long continuation on GU after a clear BOS and liquidity sweep on the 1H candle. We patiently wait for a bullish rejection or strong bullish momentum candle as confirmation for entries. Apply proper risk management.
GBPUSD trade ideas

GBPUSD Will Go Up! Buy!
Take a look at our analysis for GBPUSD.
Time Frame: 8h
Current Trend: Bullish
Sentiment: Oversold (based on 7-period RSI)
Forecast: Bullish
The market is on a crucial zone of demand 1.370.
The oversold market condition in a combination with key structure gives us a relatively strong bullish signal with goal 1.378 level.
P.S
Please, note that an oversold/overbought condition can last for a long time, and therefore being oversold/overbought doesn't mean a price rally will come soon, or at all.
Disclosure: I am part of Trade Nation's Influencer program and receive a monthly fee for using their TradingView charts in my analysis.
Like and subscribe and comment my ideas if you enjoy them!

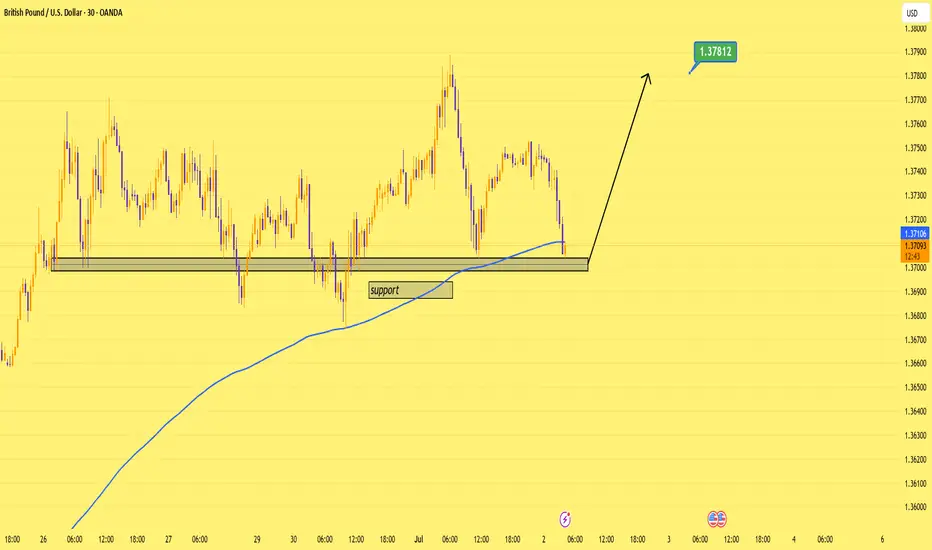
GBPUSD Bounced the Block — 1.3780 in Sight.Price is reacting off a strong support zone and the 200 EMA.
This move is also based on my expectation that upcoming U.S. data will come in weaker than forecasted, which should push USD lower and support GBP strength.
Target: 1.3780 📈
Let’s see how it plays out.
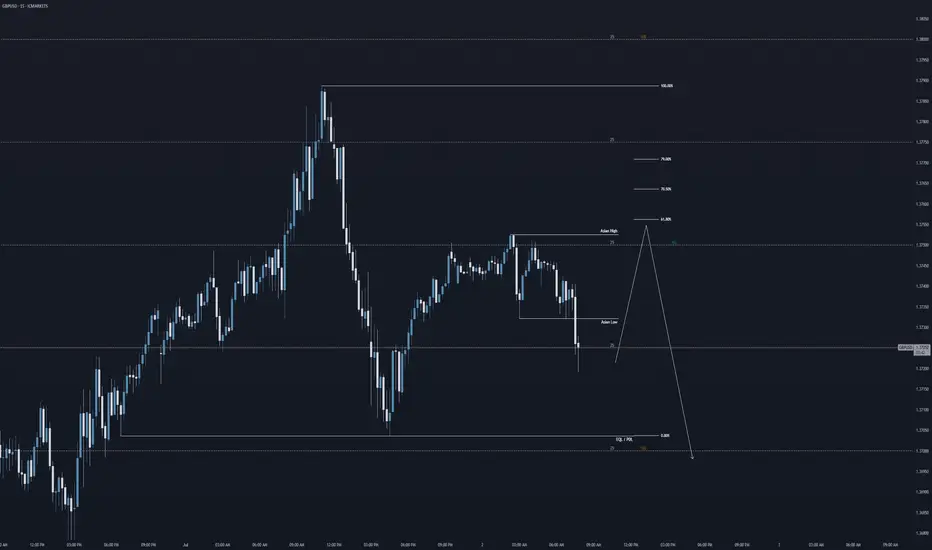
GU: Asian highs > Previous Day Low?Hi everyone,
Here is my forecast this morning for GBPUSD. Overall I'm thinking bearish, but I reckon that price could take out the Asian range highs first and then give us a bearish leg towards the previous day low.
Regards,
Aman | SMC Wolf FX
1-1 student onboarding is currently open (website in my signature & profile)
GU-Wed-02/07/25 TDA-Market positioning not the best atmAnalysis done directly on the chart
Follow for more, possible live trades update!
I often share my live trades in Tradingview public chat in London session, stay tuned!
Another factor that plays huge your trade setups, ideas is
market positioning. Your ideas might be good, but with
bad market positioning there's high chance price might
stop you out before going to your direction.
Active in London session!
Not financial advice, DYOR.
Market Flow Strategy
Mister Y

Fundamental Market Analysis for July 2, 2025 GBPUSDOn Wednesday, during the Asian trading session, the GBP/USD pair is trading unchanged at around 1.37450. However, dovish statements by US Federal Reserve Chairman Jerome Powell and growing concerns about the budget may put pressure on the dollar in the near term. Investors are awaiting the ADP report on US employment for June, which will be released later on Wednesday, in the hope of new momentum.
Powell said on Tuesday that the US central bank would be patient about further interest rate cuts, but did not rule out a rate cut at its July meeting, although the decision would depend on incoming data. According to the CME FedWatch tool, short-term interest rate futures now price in the probability of a rate cut in July at almost 1 in 4, up from less than 1 in 5 previously.
Investors are concerned about US President Donald Trump's massive tax and spending bill, which could increase the national debt by $3.3 trillion. The bill will return to the House of Representatives for final approval. Fiscal concerns could dampen optimism and contribute to a decline in the US dollar.
As for the pound sterling, Bank of England (BoE) Governor Andrew Bailey said last week that there are currently signs of a weakening UK labor market and stressed that interest rates are likely to continue to fall. The UK central bank is expected to cut interest rates three times by the end of 2025, bringing them to 3.5% to combat sluggish economic growth and a weakening labor market. Rate cuts are expected in August, September, and November 2025, with possible quarterly reductions.
Trading recommendation: SELL 1.37450, SL 1.37900, TP 1.36750

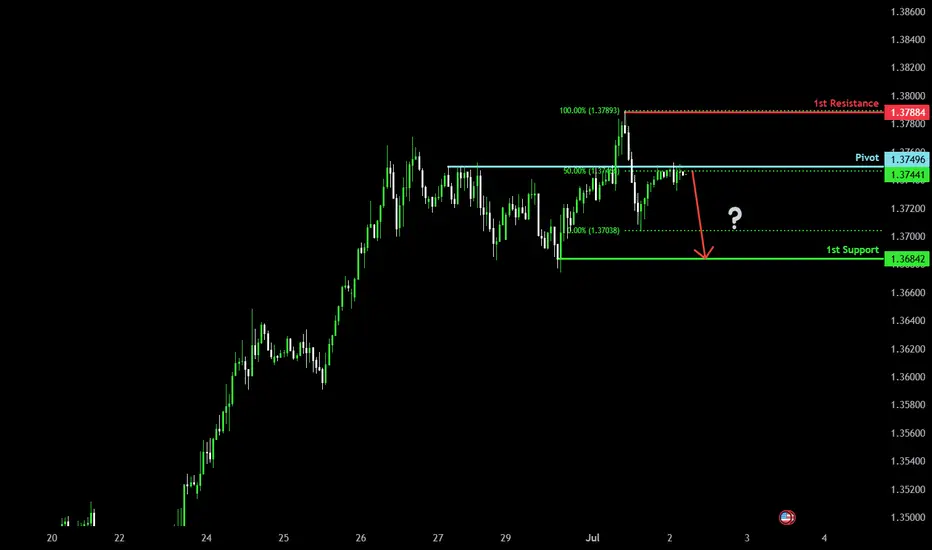
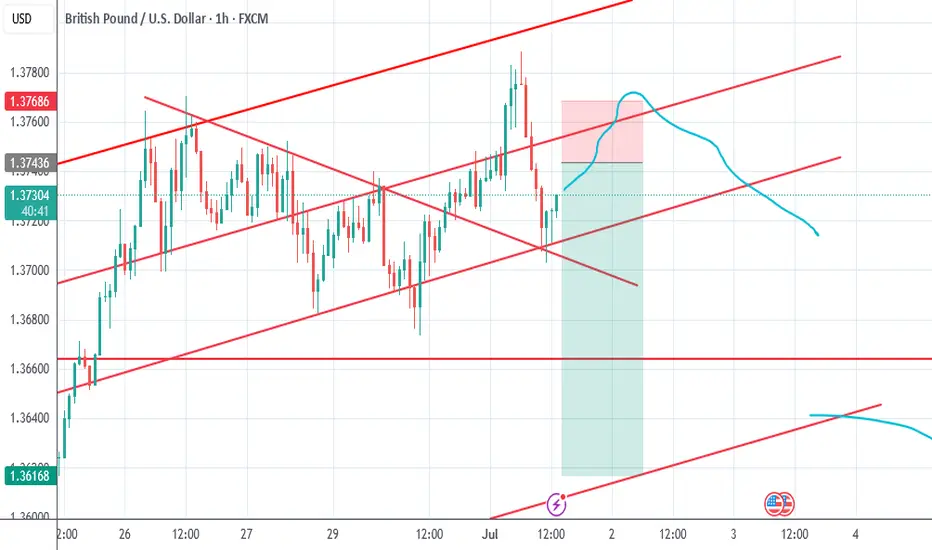
Bearish drop?The Cable (GBP/USD) is reacting off the pivot and could drop to the 1st support.
Pivot: 1.3749
1st Support: 1.3684
1st Resistance: 1.3788
Risk Warning:
Trading Forex and CFDs carries a high level of risk to your capital and you should only trade with money you can afford to lose. Trading Forex and CFDs may not be suitable for all investors, so please ensure that you fully understand the risks involved and seek independent advice if necessary.
Disclaimer:
The above opinions given constitute general market commentary, and do not constitute the opinion or advice of IC Markets or any form of personal or investment advice.
Any opinions, news, research, analyses, prices, other information, or links to third-party sites contained on this website are provided on an "as-is" basis, are intended only to be informative, is not an advice nor a recommendation, nor research, or a record of our trading prices, or an offer of, or solicitation for a transaction in any financial instrument and thus should not be treated as such. The information provided does not involve any specific investment objectives, financial situation and needs of any specific person who may receive it. Please be aware, that past performance is not a reliable indicator of future performance and/or results. Past Performance or Forward-looking scenarios based upon the reasonable beliefs of the third-party provider are not a guarantee of future performance. Actual results may differ materially from those anticipated in forward-looking or past performance statements. IC Markets makes no representation or warranty and assumes no liability as to the accuracy or completeness of the information provided, nor any loss arising from any investment based on a recommendation, forecast or any information supplied by any third-party.
GBPUSD – Multi-Timeframe Bearish Divergence | Trend Weakening AcGBPUSD – Multi-Timeframe Bearish Divergence | Trend Weakening Across the Board 🐻📉
Hey traders 👋
GBPUSD is flashing clear signs of weakness, and this time it’s not just on the lower timeframes. We’re seeing bearish divergence on the 4H, Daily, and Weekly charts — a rare alignment that typically signals a bigger move is brewing.
📉 Technical Breakdown
4H: Price pushing higher, but RSI lagging = short-term exhaustion
Daily: Momentum fading, divergence forming against structure
Weekly: Long-term bearish divergence developing = macro weakness
That kind of multi-timeframe divergence doesn’t just whisper — it screams caution for bulls.
💵 DXY (Dollar Index) Just Hit 0.71 Level
DXY tapping into a key fib level (0.71) — suggesting a short-term correction or pullback
If DXY cools off temporarily, GBPUSD might fake a bounce or wick up
But once that correction is done, expect GBPUSD to resume its slide
This is where timing becomes everything.
🎯 Trade Strategy
Already short from current divergence signals? ✅ Good spot.
Stop-loss: Reasonable level above last high or structure break — no need to choke the trade
If SL gets hit: Don’t chase — wait for next bearish divergence or retest fail, then re-enter with structure confirmation
This is about patience, not prediction. The setup is clean — now it’s all about execution.

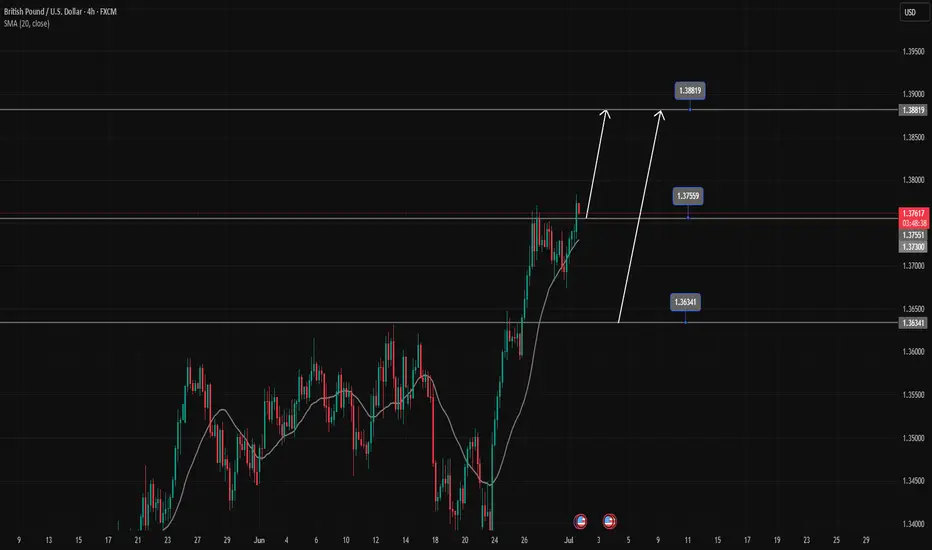
GBPUSD's strong uptrend continuesGBPUSD is in a strong uptrend, Price has just broken the resistance zone of 1.37500.
All the bullish momentum is heading towards the resistance zone of 1.388.
If there is a close of the h4 candle below the resistance zone of 1.375, there will likely be a Pullback to 1.363 to find more buying momentum towards the target at the resistance zone of 1.388
📈 Key Levels
Support: 1.375-1.363
Resistance: 1.388
📊 Recommended Trade Setups
BUY GBPUSD 1.375-1.373 Stoploss 1.37000
BUY GBPUSD 1.363-1.361 Stoploss 1.35800
SELL GBPUSD 1.388-1.390 Stoploss 1.39300
GBPUSD SHORT POSITION I think the price could go down from this range because I think this is a key point.

Short Scalp With Swing OpportunityGBPUSD formed a perfect wedge top, setting up a potential short opportunity in the next days.
1. The move is composed of a clear 3-Push Pattern.
2. The last push/leg is the strongest, indicating a possible exhaustion (Climatic Move).
3. At the top of the last leg, there's a sequence of 5 bars with lots of overlapping - Al Brooks' Final Flag Pattern
With a good bearish signal bar, it's worth scalping part of the position towards to the 20 EMA and swing the rest of it until the Bull TL.

Wednesday Model70% of the time Wednesday is a classic sell
With this Model we take the true Monday high and low(00:00 EST)
Look for a rejection of a Swing high/low from the weekly/monthly TF
4hr CRT and a Market Structure Shift on the 1hr
Entry on the Order Block on the 1hr
Target? the Monday low


Sintra Signals: Central Banks Stay Cautious The ECB Forum in Sintra brought together the heads of the world’s most influential central banks—Lagarde (ECB), Powell (Fed), Bailey (BOE), Ueda (BOJ), and Rhee (BOK).
Across the board, central banks are remaining cautious and data-driven, with no firm commitments on timing for rate changes.
Fed Chair Powell said the U.S. economy is strong, with inflation manageable despite expected summer upticks. He noted tariffs have delayed potential rate cuts and confirmed the Fed is proceeding meeting by meeting.
BOE’s Bailey highlighted signs of softening in the UK economy and said policy remains restrictive but will ease over time. He sees the path of rates continuing downward.
BOJ’s Ueda noted headline inflation is above 2%. Any hikes will depend on underlying core inflation which remains below target.

#GBPUSD: Detailed View Of Next Possible Price Move! GBPUSD exhibited a favourable movement after rejecting a pivotal level previously identified. We anticipate a smooth upward trajectory, potentially reaching approximately 1.45. Conversely, the US Dollar is on the brink of collapse around 90, which will directly propel the price into our take-profit range.
During GBPUSD trading, it is imperative to adhere to precise risk management principles. Significant news is scheduled to be released later this week.
We kindly request your support by liking, commenting, and sharing this idea.
Team Setupsfx_

Short to Long Waiting for the market to reach the poi and wait for reaction to short to the bullish poi
GBPUSDAccording to my Technical analysis GBPUSD pair continue to bearish, i adjust my TP as per price action.
GBPUSD - Bullish Channel (TCB Strategy)📈 GBPUSD – Falling Wedge Breakout Within Bullish Channel (TCB Strategy)
Type: Trend → Countertrend → Breakout
Timeframe: 1H
Status: Trade Running
🔍 Analysis Summary:
GBPUSD is respecting a strong ascending channel, with a recent correction forming a textbook falling wedge pattern. Price has now broken out of the wedge with bullish momentum during the NY session, signaling a potential continuation toward the upper boundary of the channel.
This setup aligns perfectly with my TCB Strategy:
Trend: Bullish market structure intact
Countertrend: Falling wedge correction
Breakout: Clean bullish breakout above wedge resistance
🧠 Trade Plan:
Entry (EP1): 1.37350 (Breakout entry)
SL: 1.36850 (below wedge low)
TP1: 1.37600
TP2: 1.38200 (channel top)
🛠️ Checklist Score: ✅ 100%
All criteria met, including session timing, structure confluence, breakout candle quality, and risk-reward profile.
📌 Watching how price reacts around 1.37600. Clean break above that could open the path to 1.38200+.
Follow for updates.
#GBPUSD #ForexAnalysis #TCBStrategy #BreakoutSetup #FallingWedge #PriceAction

GBPUSD Long, 1 JulyPrice is reacting from a Daily bearish OB, but this setup aims to catch the pullback — making a long valid here despite HTF structure.
LTF gave a clean 15m BOS, followed by reaction from the extreme 15m OB.
Entry was taken after a confirmed 1m BOS + OB retrace, in alignment with structure and location.
🎯 Target: 30 pips (1:3 RR)
⚠️ No clear Asia target, but structure favors this move
📍Entry: 1m OB after BOS
📉 Risk: 0.5%
High-probability pullback play, executed with confirmation and clean structure.

Eurusd And Gbpusd Sell ideas EU 1H
Currently we are in a bulllish trend on EU/GU
And this High might be a short term Top and
EU/GU should sell according to my idea
(This is Counter trend idea And not financial advice
I

GBPUSD GBPUSD will either fall or breakout from the supply roof an ascending trendline ...structure never lies only traders lie.
#gbpusd

GBPUSD – Short-Term Entry Model (Price Action Based)Education time!
This is a quick-execution on GBPUSD this London session based on a failed breakout and structure shift.
Price initially broke above the previous high but failed to sustain the breakout. The second push failed to print a higher high (HH), signaling potential exhaustion. Once the higher low (HL) that led to the failed HH was broken to the downside, a valid short setup was confirmed.
The trade targets the 161.8% Fibonacci extension of the initial move that failed to hold above the high.
📉 Result: The setup played out cleanly, hitting the target with a +17 pip gain.

GBP/USD Trade Update: Re-Entry After SL Hit – Bullish Bias MaintAfter the initial stop-loss was triggered, price action has realigned with the original bullish outlook. Market structure remains intact, and the recent move appears to be a liquidity sweep rather than a full reversal. I’ve re-entered the buy position at a more favorable level, with a clear invalidation point and defined upside targets.
This re-entry reflects confidence in the broader setup and a commitment to disciplined execution. Sometimes, the best trades require patience and a second entry when the market shakes out weak hands.
📈 Follow for live trade updates, risk management insights, and GBP/USD strategy breakdowns. 💬 Let’s navigate the volatility with precision and purpose.
