GBPUSDHello traders,
With all news that happening in middle east since yesterday.
I hope ending the war with no humanity loss.
That will affect GBPUSD and GOLD, both of them looks like near the ups.
active now,
Good luck for me and you
GBPUSD trade ideas

GBP/USD – Bullish Bias Holding Above Demand Zones (1H Chart)📈 GBP/USD – Bullish Bias Holding Above Demand Zones (1H Chart)
The pair is consolidating above key demand zones after a strong bullish move. Price structure suggests buyers are still active.
🔹 First Demand Zone: 1.36561–1.36683
🔹 Secondary Demand Zone: 1.35908–1.36226
🔹 Current Price: 1.37375
📍 As long as price holds above 1.36561, bullish continuation remains on the table. A clean rejection from demand with LTF confirmation could offer fresh long setups.
⚠️ No need to rush — let price test the zone and show intent before buying.
#GBPUSD #FXFOREVER #DemandZone #SmartMoneyTrading #PriceAction #ForexForecast #BullishScenario #StructureSupport


GU-Tue-01/07/25 TDA-Strong resistance area approaching 1.37500Analysis done directly on the chart
Follow for more, possible live trades update!
I often share my live trades in Tradingview public chat in London session, stay tuned!
Timing!
You might ask yourself why sometimes your
trade idea was good but still ended up hitting your sl before it moves to your direction.
The reason is simple: Timing.
price is just not ready to push at that time
and needed extra liquidity and structure before it finally has the force to push.
Understanding when the market is ready is one of the most difficult thing for a trader to do but with experience you start to understand better and improve.
If you like the way I present and analyze, make sure to boost,
share and follow me for more future posts, ideas and useful informations.
Active in London session!
Not financial advice, DYOR.
Market Flow Strategy
Mister Y

GBPUSD D1 LongD1 Long GBPUSD
Based on trend and candle structure
80% probability
TP on next PSYchological level not far at all

GBP/USD 15M CHART PATTERNHere's a clear summary of your GBP/USD sell trade setup:
---
Trade Type: Sell
Entry Price: 1.37440
✅ Take Profit Targets:
1. TP1: 1.37240
2. TP2: 1.37032
3. TP3: 1.36821
❌ Stop Loss:
SL: 1.37674
---
Risk-Reward Overview:
Risk (SL): 1.37674 - 1.37440 = +23.4 pips
Reward:
TP1: 1.37440 - 1.37240 = 20 pips
TP2: 1.37440 - 1.37032 = 40.8 pips
TP3: 1.37440 - 1.36821 = 61.9 pips
So the best-case reward-to-risk ratio is approximately 2.6:1.
Let me know if you’d like a risk management calculator, trailing stop plan, or chart visualization for this setup.
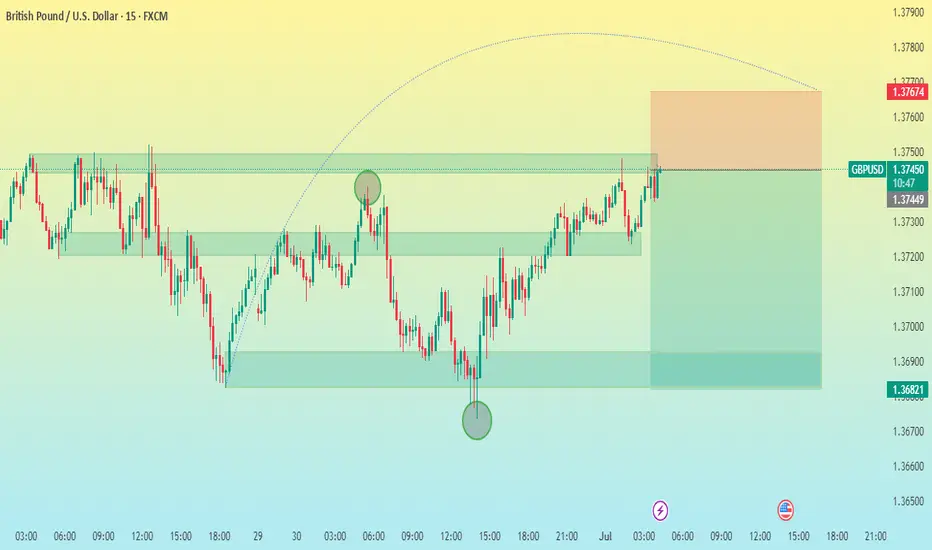
Updated GBP/USD Trade Idea: New Setup If Price Reaches Key LevelAfter successfully executing the previous trade, I’m now monitoring GBP/USD for a fresh opportunity. If the price reaches this point, it aligns with a high-probability zone where market structure suggests a potential reaction. This area has historically acted as a decision point, and I’ll be watching closely for confirmation before entering the next position.
This updated idea reflects a disciplined, price-action-based approach—focused on timing, structure, and market behavior. Whether you're a day trader or swing trader, this setup offers a clean risk-to-reward profile and fits well within an intraday strategy.
📈 Stay tuned for real-time updates, trade management insights, and detailed breakdowns. 💬 Follow for more GBP/USD strategies and actionable forex content.

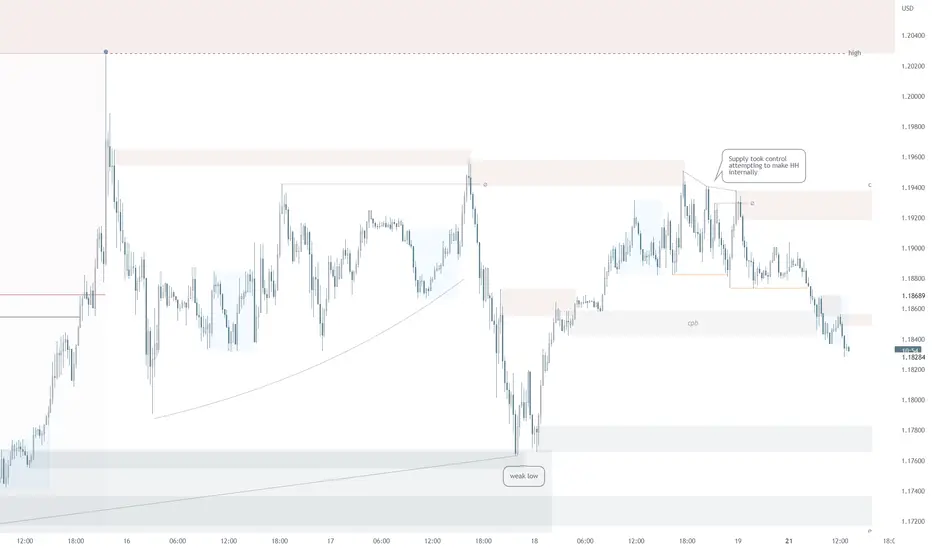
GBP/USD Tactical Shift: Long Closed, Short Bias ActivatedAfter successfully capturing the upside move on GBP/USD, price has now reached a key resistance zone where bullish momentum appears to be fading. The recent price action shows signs of exhaustion, with lower highs forming near the top and a noticeable slowdown in buying pressure.
This shift in structure suggests a potential reversal opportunity. I'm now positioning for a short setup, anticipating a corrective move as sellers begin to step in. The risk is clearly defined above the recent highs, with downside targets aligned with previous reaction zones and intraday support levels.
This transition from long to short reflects a dynamic response to evolving market conditions—focused, disciplined, and opportunity-driven.

GBP/USD – Macro Outlook & Why It’s a Top Pick This WeekMacro Fundamentals (ENDO):
The UK macro backdrop remains inflationary, with solid growth data and resilient employment figures, supporting further GBP strength. Conversely, the US shows increasing deflationary signals and a softer macro pulse.
COT Positioning:
Institutional positioning is highly supportive, with a 74% long bias and strong “flip percentile.” This shows that “smart money” is increasingly positioned for further GBP/USD upside.
Z-Score (Positioning Extremes):
There are no extreme positioning imbalances in Z-Score for GBP or USD, suggesting the trend can continue without risk of a mean-reversion squeeze.
EXO Signals (Risk/Reward, Bias, Interest Rate Outlook):
Risk/reward metrics and bias signals favor the long side. The current risk-on sentiment in global markets also acts as a tailwind for GBP.
FX Sentiment:
The broader sentiment is risk-on, supporting currencies like GBP that tend to outperform in such environments.
Summary & Trading Plan:
Bias: Long GBP/USD
Conviction: High (9.5/10, all key signals aligned)
Ideal Holding Period: 1–3 weeks, as long as risk-on sentiment persists. Exit immediately if risk-off conditions emerge.
Why This Pair?
Because GBP/USD is the rare case where macro, institutional positioning, and market sentiment all support the same direction. This reduces “crosswinds” and increases the probability of a clean swing move. Watch for sustained risk-on flows and monitor for any macro or sentiment shifts.


GBPUSD buyer in controlDaily candle closed with strong bullish.
Expecting a healthy retracement before another bullish movement
Good Luck

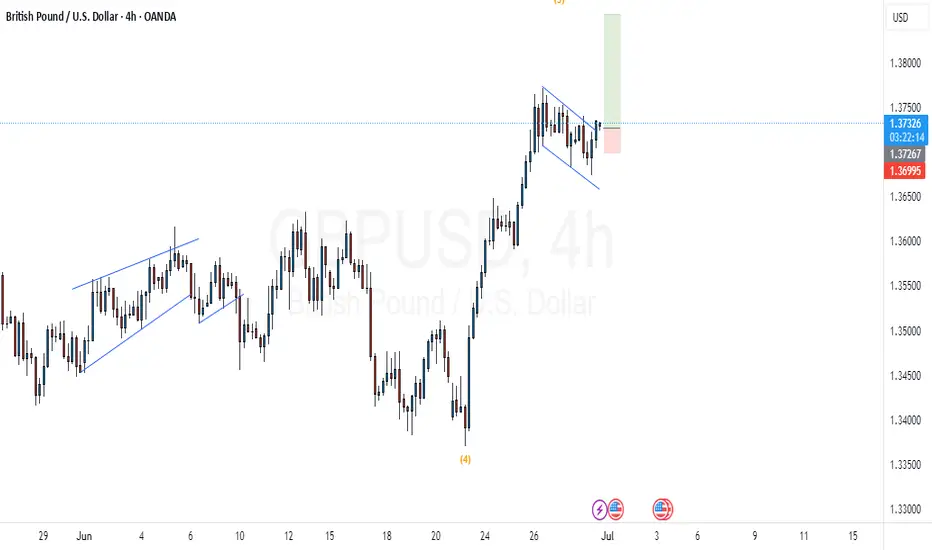
Bullish IdeaMarket forming what seems to be a bullish flag pattern, which results into an upward move. So we expect a good bullish pattern. Break out the structure and we
ready for the show now
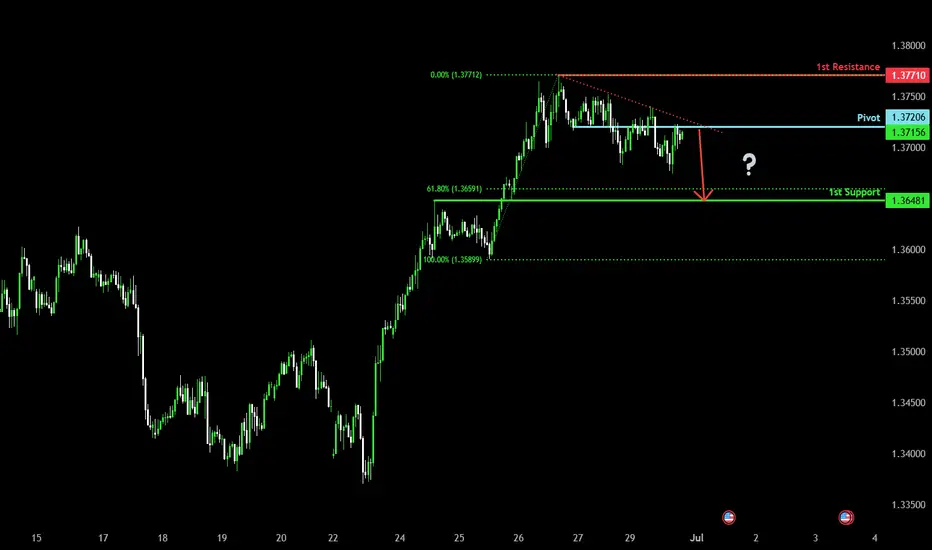
Bearish drop?The Cable (GBP/USD) is reacting off the pivot and could drop to the 1st support.
Pivot: 1.3720
1st Support: 1.3648
1st Resistance: 1.3771
Risk Warning:
Trading Forex and CFDs carries a high level of risk to your capital and you should only trade with money you can afford to lose. Trading Forex and CFDs may not be suitable for all investors, so please ensure that you fully understand the risks involved and seek independent advice if necessary.
Disclaimer:
The above opinions given constitute general market commentary, and do not constitute the opinion or advice of IC Markets or any form of personal or investment advice.
Any opinions, news, research, analyses, prices, other information, or links to third-party sites contained on this website are provided on an "as-is" basis, are intended only to be informative, is not an advice nor a recommendation, nor research, or a record of our trading prices, or an offer of, or solicitation for a transaction in any financial instrument and thus should not be treated as such. The information provided does not involve any specific investment objectives, financial situation and needs of any specific person who may receive it. Please be aware, that past performance is not a reliable indicator of future performance and/or results. Past Performance or Forward-looking scenarios based upon the reasonable beliefs of the third-party provider are not a guarantee of future performance. Actual results may differ materially from those anticipated in forward-looking or past performance statements. IC Markets makes no representation or warranty and assumes no liability as to the accuracy or completeness of the information provided, nor any loss arising from any investment based on a recommendation, forecast or any information supplied by any third-party.
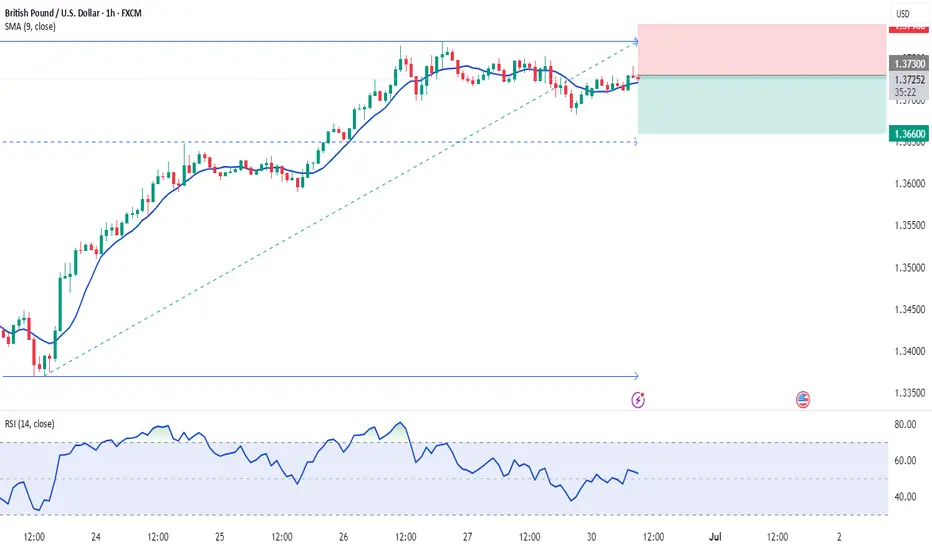
30.06.2025 #GBPUSDSELL 1.37300 | STOP 1.37900 | TAKE 1.36600 | Downward local corrective price movement.
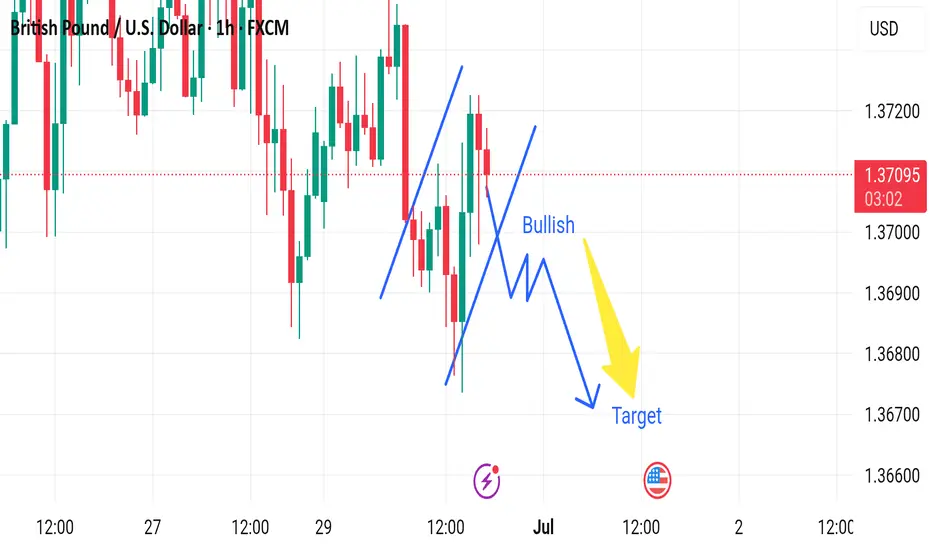
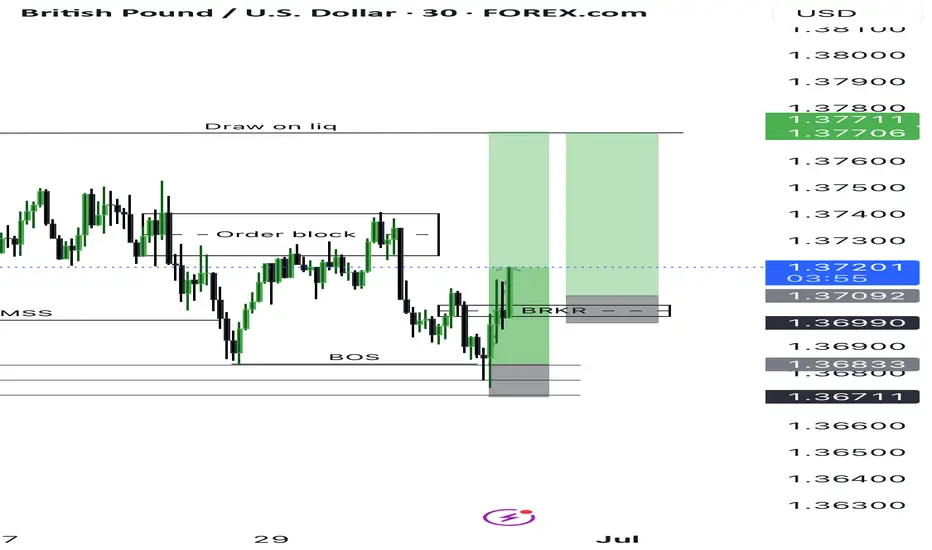
Market next target 🔀 Disruption Analysis – Bullish Alternative Scenario
While the current chart outlines a bearish scenario after a short-term bullish correction, leading to a drop toward the target near 1.36600, here’s how a bullish disruption could unfold instead:
---
🟢 Bullish Disruption Possibility:
1. False Breakdown / Bear Trap:
The market may dip slightly below recent lows to trigger sell stops and liquidity grab, then reverse upward.
If price finds strong buying interest around 1.3690–1.3700, it could spark a bullish reversal.
2. Strong Rejection Candles:
Watch for bullish engulfing or pin bar formations on lower timeframes (15m or 30m) near the dip area.
These would signal loss of bearish momentum.
3. Break of Lower High Structure:
A break above 1.3720 would shift short-term market structure to bullish.
It could lead to a move toward 1.3750–1.3780.
4. Macro Fundamentals:
Hawkish BOE comments or weak U.S. data could reverse USD strength, lifting GBP/USD.
Falling towards pullback support?GBP?USD is falling towards the support level which is a pullback support that lines up with the 38.2% Fibonacci retracement and could drop from this level to our take profit.
Entry: 1.3609
Why we like it:
There is a pullback support level that lines up with the 38.2% Fibonacci retracement.
Stop loss: 1.3534
Why we like it:
There is a pullback support.
Take profit: 1.3746
Why we like it:
There is a pullback resistance.
Enjoying your TradingView experience? Review us!
Please be advised that the information presented on TradingView is provided to Vantage (‘Vantage Global Limited’, ‘we’) by a third-party provider (‘Everest Fortune Group’). Please be reminded that you are solely responsible for the trading decisions on your account. There is a very high degree of risk involved in trading. Any information and/or content is intended entirely for research, educational and informational purposes only and does not constitute investment or consultation advice or investment strategy. The information is not tailored to the investment needs of any specific person and therefore does not involve a consideration of any of the investment objectives, financial situation or needs of any viewer that may receive it. Kindly also note that past performance is not a reliable indicator of future results. Actual results may differ materially from those anticipated in forward-looking or past performance statements. We assume no liability as to the accuracy or completeness of any of the information and/or content provided herein and the Company cannot be held responsible for any omission, mistake nor for any loss or damage including without limitation to any loss of profit which may arise from reliance on any information supplied by Everest Fortune Group.

GBPUSD is in Bearish Trend !GBPUSD in Bearish Trend Because in 1 hour Chart Pattarn Double Top Found there and in RSI Bearish Divergence also there so the Meaning is Market IS Down

GBP/USD Testing Resistance at 2022 HighsSterling marked an outside weekly-reversal through slope resistance last week with the rally trading just below resistance into the close of the month at the 2022 swing high at 1.3749. Look for support at the June high at 1.3633 IF price is heading higher on this stretch with a breach / close higher exposing the 61.8% extension of the 2022 advance at 1.4003. Weekly support rests with the 78.6% retracement at 1.3414 with media-term bullish invalidation now raised to the April high-week close (HWC) at 1.3270.
-MB

GBPUSD My analysis on GBPUSD not a financial advice do your due diligence. Thank you
Feel free to hop on this
GBP/USD💰Symbol: { GBP/USD }
🟩Price: { 1.37252 & 1.37500 }
🟥Stop: { 1.37731 }
1️⃣profit: { 1.36844 }
2️⃣profit: { 1.36397 }
3️⃣profit: { 1.36072 }
📊Check your chart before entering.
🚨Check before use to make sure there is no important news.🚨

Trading Recommendation and Analysis for GBP/USDThe British pound is rising, but the accompanying Marlin oscillator is quite weak. Before the bulls are not just the desired targets - 1.3834, 1.3935, etc. - but also potential traps from which the bears could launch an unstoppable offensive.
On the daily chart, the trend remains upward, which is also confirmed by the Marlin oscillator breaking upward out of its own descending channel. However, there is also suspicion that this might be a trap - it may be a false breakout from the channel, similar to what occurred on May 12, when it was a breakout to the downside (highlighted by a yellow rectangle) .A trend reversal would occur if the price breaks below the support level at 1.3635, which is additionally reinforced by the MACD line.
On the four-hour chart, the price appears to be finishing a consolidation phase. During this consolidation, the Marlin oscillator has had time to decompress and prepare for further growth. As long as the trend remains intact the no signs of reversal appear, we expect the price to continue moving gradually upward.

GBPUSD PullbackGBPUSD is in an overall bullish market
However, after a large bullish push, I am expecting price to pullback (sell off).
Price met resistance a weekly supply zone and closed as an indecision candle on the Daily.
The lower blue EMA crossed below the higher RED EMA on the 1hr chart.
Expecting price to selloff and find support at the 50.0 Fib level which also correlates with a demand zone, before continuing the overall trend.
