GBPUSD is in the Selling DirectionHello Traders
In This Chart GBPUSD HOURLY Forex Forecast By FOREX PLANET
today GBPUSD analysis 👆
🟢This Chart includes_ (GBPUSD market update)
🟢What is The Next Opportunity on GBPUSD Market
🟢how to Enter to the Valid Entry With Assurance Profit
This CHART is For Trader's that Want to Improve Their Technical Analysis Skills and Their Trading By Understanding How To Analyze The Market Using Multiple Timeframes and Understanding The Bigger Picture on the Charts
GBPUSD trade ideas


GBPUSD - market structure GBPUSD - market structure , this is a very clean and easy setup, to trade, use risk managment and trade managment for best result
End of trend with Head & Shoulders forming. On the monthly chart the pair has been ranging between 1.2 and 1.43 since 2016 with resistance established 2018. Currently on up leg of third cycle. Ignoring the Liz Truss blip.
Daily chart uptrend established Jan 25 and should continue up to resistance. However possible head & shoulders forming, which would indicate change of character, at most recent cycle but a good trade up to right shoulder still possible and then it will change to down trend to trend line
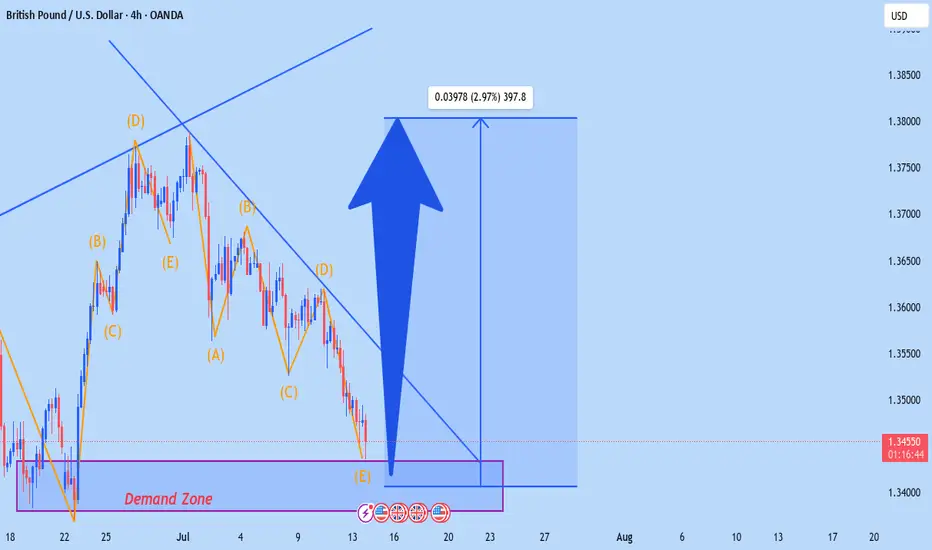
4H - Price at good quality demand with 4 basing candles. Ready for reversal and long to potential right shoulder at 1.355 or higher all the way to multiyear resistance.
COT Non-com and retail are increasing positions and commercials are reducing. Valuation is cheap.
Plan: waiting for US CPI data and confirmation of direction change and then long with stop at 1.33570 and TP at 1.355 to right shoulder. (I like these as worst that can happen, after up move is confirmed, is H&S doesnt form and it continues to upside increasing R:R). Followed by good short.
Let me know what you think

Lets fly high togetherGBPUSD looking bearish lets go against of trend we have a pullback possible now
BUY @ 1.34549 posssible we can take around 300 pips easily hope win this setup happy trading use proper money management stay strong follow ALBERT
GBPUSD: Bullish Move After Liquidity Grab 🇬🇧🇺🇸
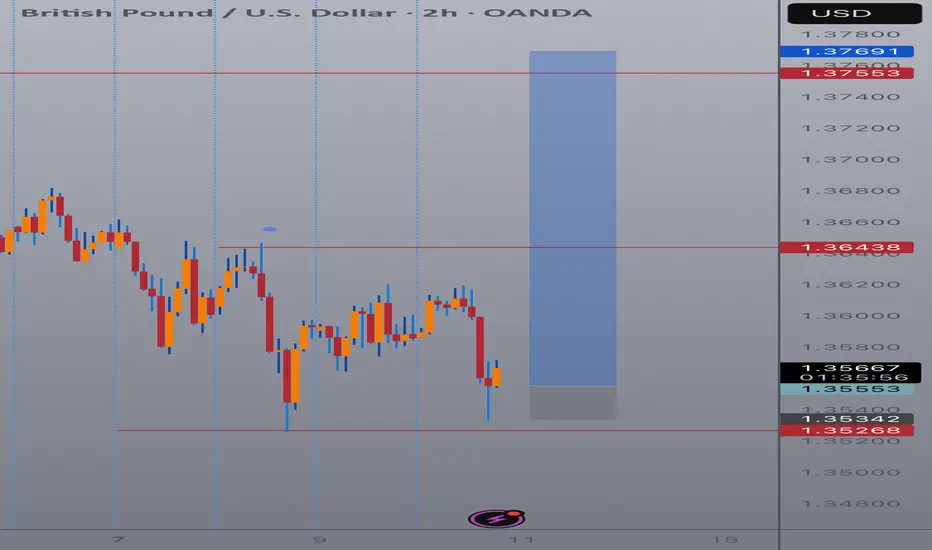
GBPUSD formed a bullish high range candle with a long lower wick going
below a key horizontal demand zone on a 4H.
A consequent recovery and a bullish London session opening suggest
a highly probable rise today.
Goal - 1.363
❤️Please, support my work with like, thank you!❤️
I am part of Trade Nation's Influencer program and receive a monthly fee for using their TradingView charts in my analysis.

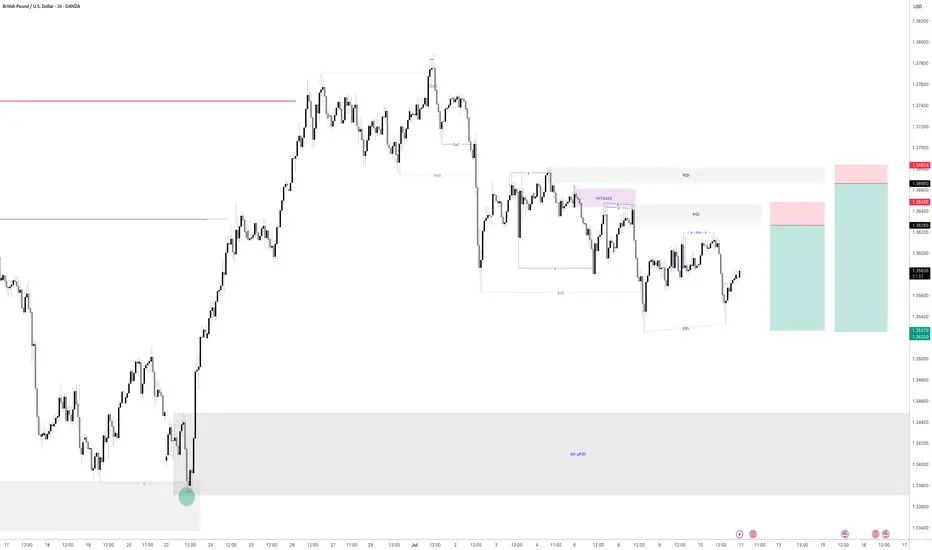
GBPUSD – Levels, Adjustments, and Scenario PlanningAs mentioned in our pinned analysis, we had two levels on GBPUSD —
✅ Both of them were broken.
📉 After the break of the first level, we shorted the pullback and took a great profit.
📍 Now after the second level has also broken, I’ve adjusted the level slightly —
There’s a chance price retraces to 1.35774 before continuing its drop.
🟢 Below, there’s a solid buy zone.
🔁 My Updated Scenarios:
✅ If price pulls back to the short level before hitting the buy zone → I’ll take the short.
⚠️ But if price touches the buy zone first, then any short afterward will just be partial or used for pyramiding — not a major trade.
Let’s stay patient and let the market tell us what to do.
📌 All previous scenarios are still valid.

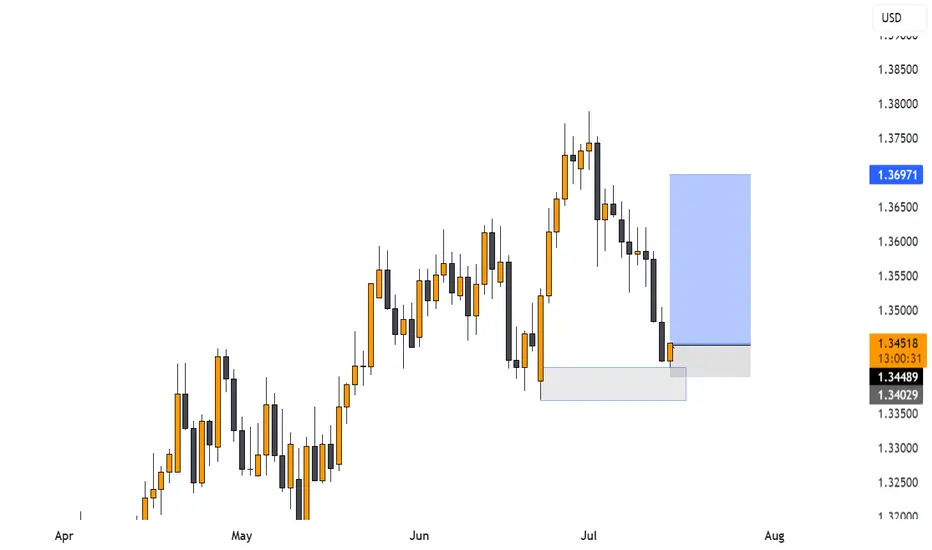
GBPUSD Pullback Another Bullish PatternThe GBPUSD recently closed around 1.33750, testing a key support zone. Although there are signs of potential further decline, the broader outlook depends significantly on the strength of the US Dollar.
A corrective move against the backdrop of a strong overall trend is within normal expectations, and bullish sentiment remains intact.
If buyers are able to defend the 1.33750 – 1.33600 support zone, a pullback or reversal could be expected then next resistance would be 1.36004 / 1.37001.
You can find more details in the chart Ps Support with like and comments for more better analysis Thanks for Supporting.

GBP USD LONGAs it is near the bottom side of the channel, we could see a correction toward the target shown on the chart, if it bounces from this level.

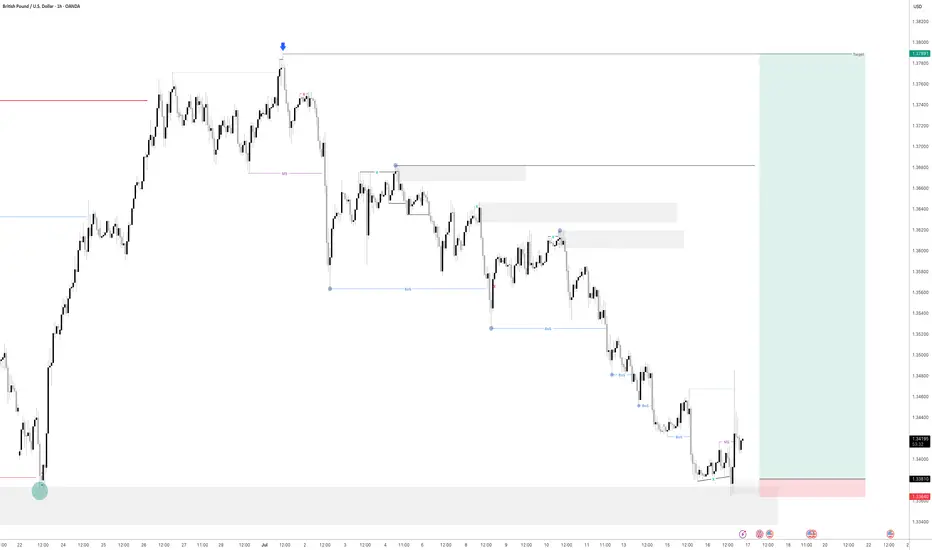
GBPUSD - 2 Selling opportunitiesLooking at GBPUSD
We have 2 opportunities to get short. Both have a build of liquidity before the areas of supply before them. This means we are looking for the early seller to get into the market before we get in so that all the early seller get stopped out.
As we can see the order flow on this is still bearish. So until the market shows me it want to go higher then we will remain bearish
Keep a close eye on this for tomorrow
GBP/USD Rate Falls to Key Support LevelGBP/USD Rate Falls to Key Support Level
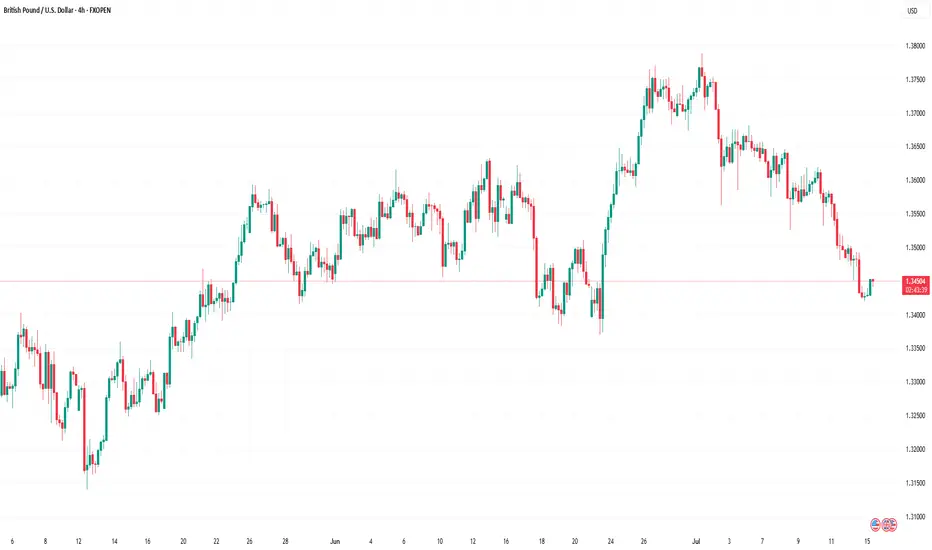
As of today, the GBP/USD chart indicates that the British pound has declined by more than 2% against the US dollar since the beginning of July. Notably, the pace of the decline accelerated on Friday and continued into Monday.
According to Reuters, the pound is under pressure due to market concerns over a potential economic slowdown amid an escalating trade war. Last week’s data confirmed a contraction in UK GDP, which could have far-reaching implications. In this context, criticism of the UK government’s failure to reduce public spending is becoming more pronounced.
What’s next for GBP/USD?
Technical Analysis of the GBP/USD Chart
From a bullish perspective, it is worth noting that the pair has fallen to a significant support level around 1.3425. This level previously acted as resistance in the spring, but after a breakout, it has now turned into support (as indicated by arrows on the chart). Additionally, the RSI indicator shows strong oversold conditions, which suggests a potential short-term rebound.
From a bearish standpoint, it is concerning that the sharp rally from point A to point B has been entirely erased by the July decline. This indicates that despite significant gains by the bulls, they failed to hold them—casting doubt on GBP/USD's ability to sustain growth in the medium term.
Ongoing pressure may lead to an attempt by bears to push GBP/USD below the June low at point A. However, it is also possible that bearish momentum will weaken thereafter, potentially leading to a recovery within the developing downward channel (marked in red).
This article represents the opinion of the Companies operating under the FXOpen brand only. It is not to be construed as an offer, solicitation, or recommendation with respect to products and services provided by the Companies operating under the FXOpen brand, nor is it to be considered financial advice.
GBPUSD Bearish Signal | Technical + Custom AlgoSmart Trend Signal | Technical Analysis + Custom Algorithm
This signal is the result of a combination of classic technical trend analysis and a proprietary software I personally developed.

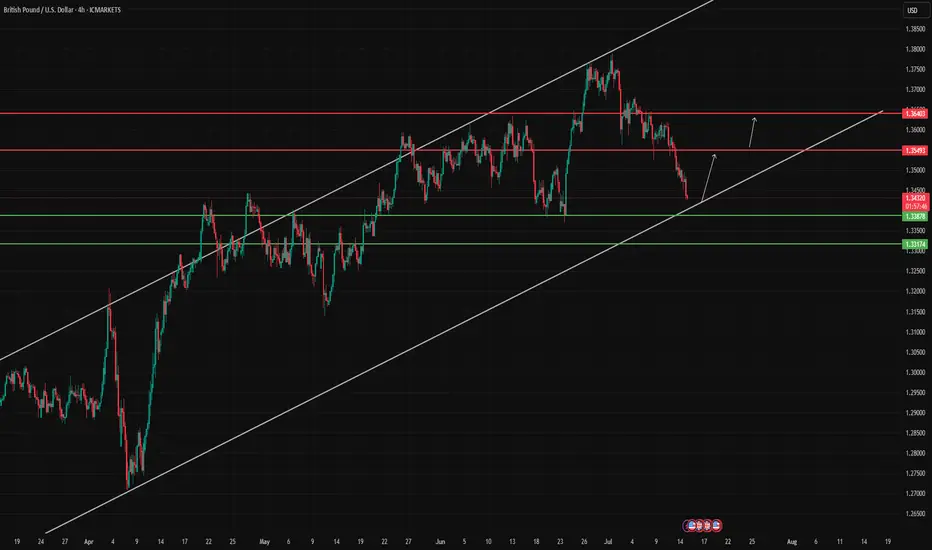
GBPUSD Internal Summary GBPUSD is approaching a key confluence area formed by a long-term channel and horizontal support. Bullish bounce is expected if this zone holds.
❌ Invalidation: Below 1.33174
GBPUSD BUY IDEA • Descending Liquidity Sweep:
• Triple equal lows (₤₤₤) have been drawn and swept via a liquidity run, hinting at smart money accumulation.
• The price is pushing toward a higher-timeframe demand zone (~1.3380–1.3420), signaling a potential low-risk buy area.
• Bullish Scenario Outlook:
• Following the liquidity grab, the market is projected to form a higher low, suggesting an internal shift in market structure.
• Anticipating a multi-leg move toward the 1.3600+ level, likely retracing to a previous supply/imbalance zone.
• Ideal Entry Approach:
• Await price reaction within the demand zone.
• Confirmation of a micro-structure shift could provide a high-probability buy setup.

GBP_USD GROWTH AHEAD|
✅GBP_USD is trading in an uptrend
Along the rising support line
Which makes me bullish biased
And the pair is about to retest the rising support
Thus, a rebound and a move up is expected
With the target of retesting the level above at 1.3650
LONG🚀
✅Like and subscribe to never miss a new idea!✅
Disclosure: I am part of Trade Nation's Influencer program and receive a monthly fee for using their TradingView charts in my analysis.

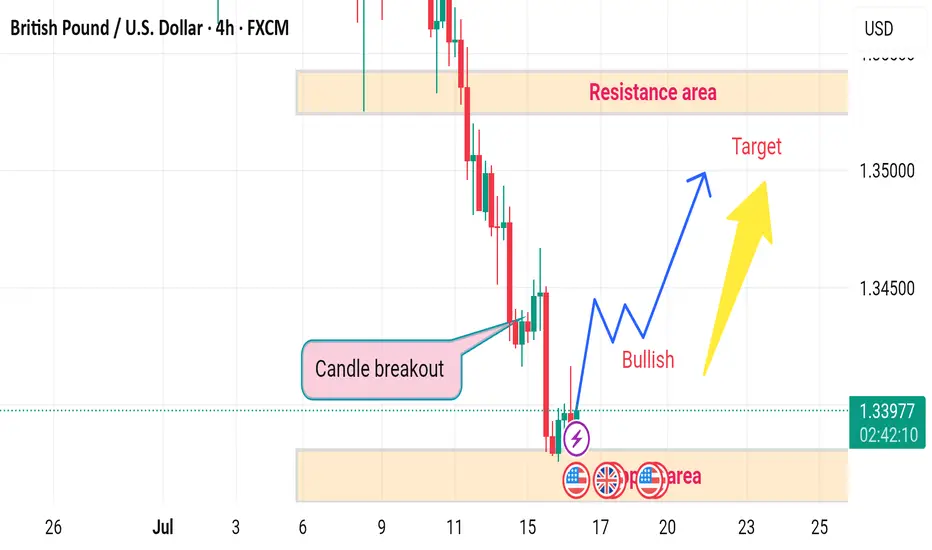
GBPUSD H4 RISESDisruption Analysis – GBP/USD (4H)
🕯️ Candle Breakout Misleading
The marked “Candle Breakout” area is followed by weak bullish momentum, but lacks strong volume confirmation or higher timeframe reversal structure.
The quick rejection after the breakout may indicate a false breakout, not a sustainable trend reversal.
⚠️ Demand Zone Weakness
The “Support Area” (demand zone) has already been tested multiple times.
Multiple touches weaken the demand zone—buyers may be exhausted, increasing the chances of a breakdown instead of a bounce.
📉 Macro Trend Still Bearish
The recent sharp downtrend shows a strong bearish structure (lower highs, lower lows).
A few bullish candles are not enough to confirm a reversal—this could just be a retracement.
💣 Upcoming Fundamental Risks
The presence of multiple economic event icons (UK & US flags) indicates high-impact news—could result in unexpected volatility or trend reversals.
Fundamental factors may disrupt the projected bullish move entirely.
🎯 Bullish Target Overoptimistic
Target near 1.35000 lies within the Resistance Area, which has previously caused sharp rejections.
Without a strong breakout above 1.3400, this target is unrealistic in current market conditions.
GBPUSD MULTI TIME FRAME ANALYSISHello traders , here is the full multi time frame analysis for this pair, let me know in the comment section below if you have any questions , the entry will be taken only if all rules of the strategies will be satisfied. wait for more price action to develop before taking any position. I suggest you keep this pair on your watchlist and see if the rules of your strategy are satisfied.
🧠💡 Share your unique analysis, thoughts, and ideas in the comments section below. I'm excited to hear your perspective on this pair .
💭🔍 Don't hesitate to comment if you have any questions or queries regarding this analysis.

GBPUSD ANALYSIS After seeing the previous day close bearish we can expect the market to continue in to support area of 133.750 but a slight retracement could be in play before further push down

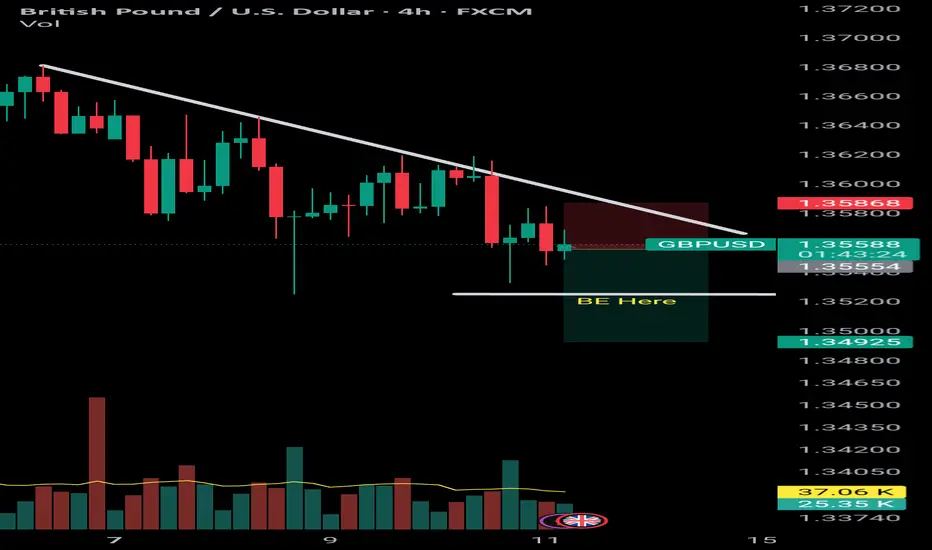
GBPUSD Bearish Bias Expected till 1.35250Little bit sign of strength observed by the lower wicks rejections but each price price shows no real intention to upside yet. We can expect atleast for the short term toward sell side min 1.35250, if hold and reverse we can move trade to Breakeven, otherwise our main target will be near 1.35300 area.
GBPUSD- H4 BUY Price is moving in a channel and weekly show uptrend. Price reach strong area of Support, and FIBO show 78.60
Price show Divergency in Daily frame. All this can indicate that price is finish the correction and now ready to join the main uptrend.

GBPUSD LONG FORECAST Q3 D16 W29 Y25GBPUSD LONG FORECAST Q3 D16 W29 Y25
Welcome back to the watchlist GBPUSD ! Let's go long ! Alignment across all time frames.
Professional Risk Managers👋
Welcome back to another FRGNT chart update📈
Diving into some Forex setups using predominantly higher time frame order blocks alongside confirmation breaks of structure.
Let’s see what price action is telling us today!
💡Here are some trade confluences📝
✅Daily order block
✅1H Order block
✅Intraday breaks of structure
✅4H Order block
📈 Risk Management Principles
🔑 Core Execution Rules
Max 1% risk per trade
Set alerts — let price come to your levels
Minimum 1:2 RR
Focus on process, not outcomes
🧠 Remember, the strategy works — you just need to let it play out.
🧠 FRGNT Insight of the Day
"The market rewards structure and patience — not emotion or urgency."
Execute like a robot. Manage risk like a pro. Let the chart do the talking.
🏁 Final Words from FRGNT
📌 GBPUSD is offering textbook alignment — structure, order flow, and confirmation all check out.
Let’s approach the trade with clarity, conviction, and risk-managed execution.
🔑 Remember, to participate in trading comes always with a degree of risk, therefore as professional risk managers it remains vital that we stick to our risk management plan as well as our trading strategies.
📈The rest, we leave to the balance of probabilities.
💡Fail to plan. Plan to fail.
🏆It has always been that simple.
❤️Good luck with your trading journey, I shall see you at the very top.
🎯Trade consistent, FRGNT X

GBPUSD - Is it Ready? Looking at GBPUSD
We have had a Market shift to the upside from a HTF Point of Interest. I am now waiting for price to come back into a 15min demand area and hopefully price will take off to the upside from here.
We have also swept liquidity before a drastic move to the upside.
Lets see how this one plays out