GBPUSD – Rejection From New Price High Questions UptrendThe escalation in geo-political risks overnight in the Middle East, marked by Israel's attack on Iranian nuclear sites which was followed by Iran's retaliatory drone strikes against Israel, have seen a rush to safe haven assets, which this time included buying dollars (a rarity of late!).
This has seen GBPUSD fall quickly from a fresh 2025 high hit early this morning at 1.3633, back down to lower levels around 1.3540 (at time of writing) and questions whether the highs for GBPUSD may now be in place in the short term, with traders possibly reluctant to add to fresh longs into the weekend, and ahead of next week's Bank of England (BoE) rate meeting on Thursday (June 19th).
Looking forward into the Friday close, traders may now be on headline watch, especially considering Iran's vow to respond to Israel's initial attack with harsh blows against both Israel and the US. Any attack by Iran against US targets, while potentially unlikely, could be viewed as a level up and President Trump has stated that the US are on high alert just in case.
On the data front, the US Preliminary Michigan Consumer Sentiment for June is released at 1500 BST today. This will provide the next update on US consumer inflation expectations as well as sentiment, which although important are possibly unlikely to shift the focus of traders from progress reports regarding geo-political developments in the Middle East.
Technical Update: Rejection From New Price High Questions Uptrend
Of late, it has been a positive phase of sentiment that has been evident for GBPUSD, as a price pattern of higher highs and higher lows has formed, as the chart below shows.
This has resulted in a new recovery price high being posted this morning at 1.3633, which represents the highest trade in GBPUSD since late February 2022. However, so far this new upside extreme in price has held and seen price weakness emerge.
This may now see some traders questioning the ability of GBPUSD to maintain its current upside momentum, even suggest the potential of a more extended phase of weakness.
What support and resistance levels might be worth watching to maybe help determine the next direction of price movement?
Potential Support Levels:
Having held price weakness seen earlier this week, the rising Bollinger mid-average may continue to be a support focus. This currently stands at 1.3504, and closing breaks below this level, if seen, might result in a more extended phase of weakness.
Such downside breaks in price, while not a guarantee of further price declines, could see focus then shift to potential support at 1.3444, which is equal to the 38.2% Fibonacci retracement level, and if this in turn gives way on a closing basis, towards 1.3385, the deeper 50% retracement level.
Potential Resistance Levels:
As the chart below shows, sellers have been found this morning at the 1.3633 level and may be again. This could prove to be the first resistance point to monitor if fresh attempts at price strength are seen over coming sessions.
Successful closing breaks above 1.3633 as a result, could point to an extension of the current uptrend pattern, with the next resistance level then potentially being 1.3749, which is the January 2022 high.
The material provided here has not been prepared
accordance with legal requirements designed to promote the independence of investment research and as such is considered to be a marketing communication. Whilst it is not subject to any prohibition on dealing ahead of the dissemination of investment research, we will not seek to take any advantage before providing it to our clients.
Pepperstone doesn’t represent that the material provided here is accurate, current or complete, and therefore shouldn’t be relied upon as such. The information, whether from a third party or not, isn’t to be considered as a recommendation; or an offer to buy or sell; or the solicitation of an offer to buy or sell any security, financial product or instrument; or to participate in any particular trading strategy. It does not take into account readers’ financial situation or investment objectives. We advise any readers of this content to seek their own advice. Without the approval of Pepperstone, reproduction or redistribution of this information isn’t permitted.
GBPUSD trade ideas

CHECK GBPUSD SIGNAL READ CAPTAINgbpusd sell now ✅
entry point (1.35370) (1.35300)
TAKE PROFIT 1: (1.35050)
TAKE PROFIT 2: (1.34650)
LAST TARGET 1.34350()
STOP LOSS (1.35600)

GBPUSD – Sterling Slips Amid Geopolitical Risk |GBPUSD – Sterling Slips Amid Geopolitical Risk | Will Support Hold for a Bounce?
🌍 Macro & Geopolitical Overview
The British Pound (GBP) is under pressure as risk sentiment deteriorates following a sharp escalation between Israel and Iran.
Israel launched a major military campaign, striking dozens of nuclear and military facilities in northeastern Tehran.
PM Netanyahu announced the start of "Operation Rising Lion", aimed at eliminating the Iranian nuclear threat.
US President Donald Trump voiced support, stating that Iran “must never have a nuclear bomb.”
Investors reacted by fleeing to safe-haven assets, pushing the US Dollar (DXY) from 97.60 to nearly 98.30.
Meanwhile, next week’s Bank of England (BoE) and Federal Reserve meetings are in focus. Both are expected to hold rates steady, but weak UK economic data may pressure the BoE to adopt a more cautious or dovish tone.
📉 Technical Analysis – H1 Chart
🔸 Trend Structure
GBPUSD broke down from its recent high at 1.36288 and is now approaching key support between 1.35350 and 1.34957.
As long as 1.3495 holds, the move appears to be a technical correction, not a reversal.
🔸 Fibonacci & Moving Averages
Current price sits near Fibonacci 0.236 retracement of the recent swing.
Price is trading below the EMA 13 & 34, but EMA 200 near 1.353x still acts as potential support.
🔸 Resistance to Watch
The next upside target sits at 1.3588, followed by the previous high at 1.3628.
🧠 Market Sentiment
Risk aversion is dominating due to geopolitical headlines.
GBP is vulnerable as a risk-sensitive currency.
However, if tensions ease and central bank decisions next week come in line with expectations, GBP could rebound from its currently discounted levels.
🎯 Trade Setup Suggestion
✅ BUY ZONE: 1.35350 – 1.34957
Stop-Loss: 1.3460
Take-Profit Targets: 1.3588 → 1.3628
Enter only on bullish price action confirmation around the support zone.
✅ Conclusion
GBPUSD is trading under geopolitical stress, but the technical setup around 1.3495 – 1.3535 offers a potential bounce zone. A short-term recovery could unfold if sentiment stabilizes and central banks maintain the expected policy stance.

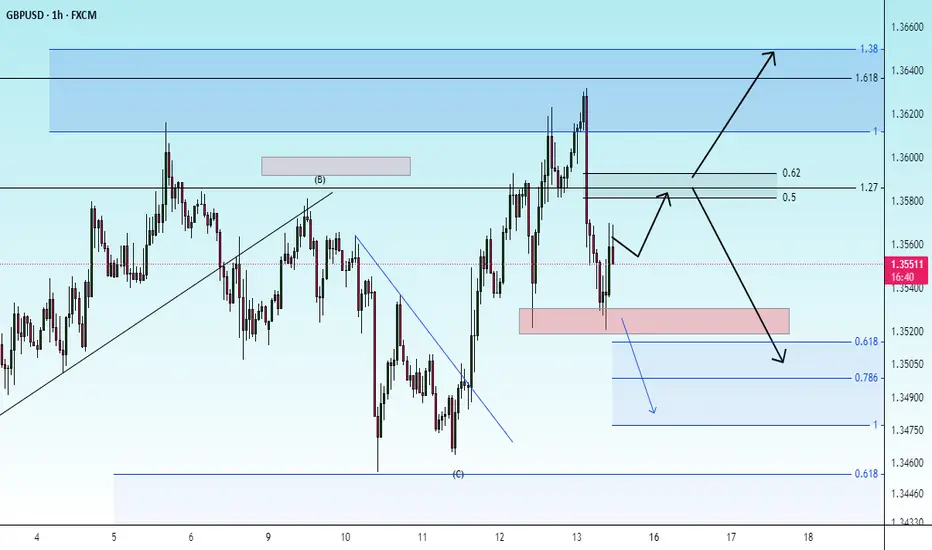
GBPUSD Key Levels Structure Outlook & Price ZonesSharing a personal breakdown of the levels I’m watching on GBPUSD based on structure and price behavior.
This is not financial advice just how I approach the chart and prepare for possible scenarios.
Focusing on key zones, market structure shifts, and reaction areas.
Let the market confirm. I stay reactive, not predictive.


Weaker PPI Caps Dollar Strength in GBP/USDGBP/USD fell to around 1.3530 early Friday as escalating tensions in the Middle East supported demand for the US Dollar. Israel’s preemptive strike on Iran raised fears of retaliation, with Iranian officials warning of severe consequences for both the US and Israel, pressuring risk-linked currencies like the Pound. However, weaker US PPI data limited further USD strength. May’s PPI increased just 0.1%, below the 0.2% forecast, while the core PPI also came in softer. Attention now turns to the upcoming Michigan consumer sentiment report.
Resistance is at 1.3600, with support around 1.3425.

GBPUSD Is Going Down! Sell!
Please, check our technical outlook for GBPUSD.
Time Frame: 7h
Current Trend: Bearish
Sentiment: Overbought (based on 7-period RSI)
Forecast: Bearish
The price is testing a key resistance 1.354.
Taking into consideration the current market trend & overbought RSI, chances will be high to see a bearish movement to the downside at least to 1.345 level.
P.S
Overbought describes a period of time where there has been a significant and consistent upward move in price over a period of time without much pullback.
Disclosure: I am part of Trade Nation's Influencer program and receive a monthly fee for using their TradingView charts in my analysis.
Like and subscribe and comment my ideas if you enjoy them!

check the trendThe upward trend is expected to continue to the specified resistance levels. Then there is a possibility of a trend change.
If the price breaks through the support area, a continuation of the downward trend to the specified support levels is possible.
EUR/USD Short and GBP/USD ShortEUR/USD Short
Minimum entry requirements:
- If tight non-structured 15 min continuation forms, 5 min risk entry within it if the continuation is structured on the 5 min chart or reduced risk entry on the break of it.
- If tight structured 15 min continuation forms, reduced risk entry on the break of it or 15 min risk entry within it.
- If tight non-structured 1H continuation forms, 15 min risk entry within it if the continuation is structured on the 15 min chart or reduced risk entry on the break of it.
- If tight structured 1H continuation forms, 1H risk entry within it or reduced risk entry on the break of it.
GBP/USD Short
Minimum entry requirements:
- If tight non-structured 1H continuation forms, 15 min risk entry within it if the continuation is structured on the 15 min chart.
- If tight structured 1H continuation forms, 1H risk entry within it.

GU-Fri-13/06/25 TDA-Difficult zone, prioritize risk management!Analysis done directly on the chart
Follow for more, possible live trades update!
June definitely showing slower price action,
tighter range movement (average daily movement).
This is how markets work! Some months it gives
good push, wide average daily movement. Some others,
it gives less average daily movement and slower pushes.
Active in London session!
Not financial advice, DYOR.
Market Flow Strategy
Mister Y

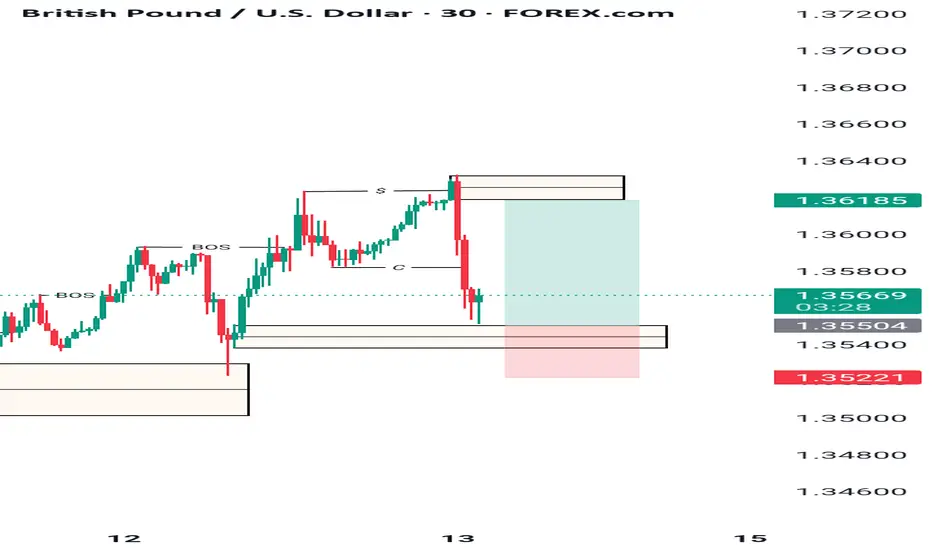
GBPUSD | MAJOR SUPPLY ZONE JUST HIT! | Bearish Setup Brewing?Price has just tapped a key 15-min supply zone (1.3600–1.3610), showing signs of hesitation. This area has acted as a liquidity magnet — and it looks ripe for a reaction. Could this be the top before the drop? 📉
---
🔍 Here's What I'm Seeing:
🔵 Supply Zone: 1.3600–1.3610 (Blue zone) — Heavy resistance overhead
🔁 Price rejected this level once already — double top or bull trap?
🟠 Demand Zone Below: 1.3465–1.3480 (orange zone)
📉 Mid-level support: 1.3539 — Watch for break and retest
---
🔽 SELL PLAN:
Entry: If price breaks below 1.3590 with momentum
SL: Above 1.3615
TP1: 1.3539
TP2: 1.3465 (Major demand zone + imbalance)
---
⚠️ BONUS INSIGHT:
The visible range POC lines up near 1.3539 — expect high-volume reaction here. Smart money may run stops above 1.3610 before pushing lower. Look out for fake breakouts.
---
💬 Do you think GBPUSD will reject hard or break above for a new high?
Comment below! 👇
✅ Follow @FrankFx14 for more sniper setups!
#GBPUSD #ForexSignals #SmartMoney #PriceAction #SupplyAndDemand #ForexTrading #Scalping #IntradaySetups #LiquidityGrab #FrankFx

GBPUSD - Confluence📊 Multi-Timeframe Confluence – GBPUSD 1H & 15min
This chart perfectly illustrates how traders can use the ELFIEDT RSI + 3SD Reversion Strategy for top-down confluence trading, combining signals from multiple timeframes to increase the confidence and quality of trade entries.
🟢 What Happened at the Yellow Line:
✅ 1H Chart — Buy Signal Triggered
The strategy printed a clear “UP” signal as price pushed below the lower volatility band with RSI deeply oversold. This marked a significant exhaustion point on the higher timeframe, signaling that the downtrend might be overextended.
✅ 15min Chart — Cluster of Buy Signals
At the exact same point in time, the 15-minute chart also showed multiple “UP” signals, confirming short-term exhaustion with RSI recovery already starting to form. The RSI indicator also dipped into oversold territory and began turning upward — a strong confirmation that momentum was shifting.
✅ Powerful Bounce Followed
After this dual-timeframe signal alignment, price reversed strongly and rallied for several candles, offering a clean move with both trend and momentum shifting in your favor.
📈 How You Could Have Traded It:
Start with the 1H timeframe and wait for an “UP” or “DOWN” signal — this gives your macro bias.
Drop to the 15min timeframe and look for the same signal type (e.g., “UP” + “UP”).
Confirm RSI turning or divergence for added conviction.
Place stop-loss just below the signal wick and use a reward target based on previous structure or a 1:2+ risk-reward ratio.
🎯 Why Confluence Matters:
When a lower timeframe entry aligns with a higher timeframe signal, you're no longer guessing — you’re trading with multi-layer confirmation. This not only increases your confidence, but also helps filter out weaker setups.
This example shows the true strength of the ELFIEDT Reversion Strategy — combining statistical exhaustion, RSI momentum shifts, and multi-timeframe alignment to give you some of the most reliable reversal opportunities in any market.


13.06.25 Morning ForecastPairs on Watch -
FX:GBPUSD
FX:EURUSD
A short overview of the instruments I am looking at for today, multi-timeframe analysis down to what I will be looking at for an entry. Enjoy!

GBPUSD remains within a bullish channelGBP/USD is currently trading within an ascending channel, showing bullish structure overall. The price is testing support near 1.3529, with potential for a rebound toward 1.3568 and 1.3632 if the structure holds. However, a decisive break below 1.34616 would be a strong bearish signal and could mark a shift in trend direction from bullish to bearish, opening the door for deeper declines. Traders should monitor price action closely around this level for potential trend reversal confirmation.

GBPUSD SHORT FORECAST Q2 W24 D13 Y25GBPUSD SHORT FORECAST Q2 W24 D13 Y25
Professional Risk Managers👋
Welcome back to another FRGNT chart update📈
Diving into some Forex setups using predominantly higher time frame order blocks alongside confirmation breaks of structure.
Let’s see what price action is telling us today!
💡Here are some trade confluences📝
✅Weekly order block
✅15' order block
✅Intraday 15' break of structure
✅Tokyo ranges to be filled
🔑 Remember, to participate in trading comes always with a degree of risk, therefore as professional risk managers it remains vital that we stick to our risk management plan as well as our trading strategies.
📈The rest, we leave to the balance of probabilities.
💡Fail to plan. Plan to fail.
🏆It has always been that simple.
❤️Good luck with your trading journey, I shall see you at the very top.
🎯Trade consistent, FRGNT X

BUY Positioncurrently looking at a BUY position to zone Bullish trend my judgement should push to the upside

Bearish outlook for GBPUSD with 1.34557 as target.Price action has entered the sellside of the curve in a market maker sell model. This has warranted bearish price action till 1.34557.

GBPUSD H4 I Bullish Bounce OffBased on the H4 chart analysis, we can see that the price is falling toward our buy entry at 1.3519, which is a pullback support that aligns closely with the 61.8% Fibo retracement.
Our take profit will be at 1.3588, which is a pullback resistance level.
The stop loss will be placed at 1.3455, a swing low support.
High Risk Investment Warning
Trading Forex/CFDs on margin carries a high level of risk and may not be suitable for all investors. Leverage can work against you.
Stratos Markets Limited (tradu.com ):
CFDs are complex instruments and come with a high risk of losing money rapidly due to leverage. 63% of retail investor accounts lose money when trading CFDs with this provider. You should consider whether you understand how CFDs work and whether you can afford to take the high risk of losing your money.
Stratos Europe Ltd (tradu.com ):
CFDs are complex instruments and come with a high risk of losing money rapidly due to leverage. 63% of retail investor accounts lose money when trading CFDs with this provider. You should consider whether you understand how CFDs work and whether you can afford to take the high risk of losing your money.
Stratos Global LLC (tradu.com ):
Losses can exceed deposits.
Please be advised that the information presented on TradingView is provided to Tradu (‘Company’, ‘we’) by a third-party provider (‘TFA Global Pte Ltd’). Please be reminded that you are solely responsible for the trading decisions on your account. There is a very high degree of risk involved in trading. Any information and/or content is intended entirely for research, educational and informational purposes only and does not constitute investment or consultation advice or investment strategy. The information is not tailored to the investment needs of any specific person and therefore does not involve a consideration of any of the investment objectives, financial situation or needs of any viewer that may receive it. Kindly also note that past performance is not a reliable indicator of future results. Actual results may differ materially from those anticipated in forward-looking or past performance statements. We assume no liability as to the accuracy or completeness of any of the information and/or content provided herein and the Company cannot be held responsible for any omission, mistake nor for any loss or damage including without limitation to any loss of profit which may arise from reliance on any information supplied by TFA Global Pte Ltd.
The speaker(s) is neither an employee, agent nor representative of Tradu and is therefore acting independently. The opinions given are their own, constitute general market commentary, and do not constitute the opinion or advice of Tradu or any form of personal or investment advice. Tradu neither endorses nor guarantees offerings of third-party speakers, nor is Tradu responsible for the content, veracity or opinions of third-party speakers, presenters or participants.

SELL GBPUSD for bullish trend reversal STOP LOSS: 1.3720SELL GBPUSD for bullish trend reversal
STOP LOSS: 1.3720
Regular Bearish Divergence
In case of Regular Bearish Divergence:
* The Indicator shows Lower Highs
* Actual Market Price shows Higher Highs
We can see a strong divergence on the MACD already and There is a strong trend reversal on the daily time frame chart.....
The daily time frame is showing strength of trend reversal from this level resistance so we
are looking for the trend reversal and correction push from here .....
TAKE PROFIT : take profit will be when the trend comes to an end, feel from to send me a direct DM if you have any question about take profit or anything
Remember to risk only what you are comfortable with….....trading with the trend, patient and good risk management is the key to success here

Who else is ready for GU possible buys?GU has reached a supply zone after taking out liquidity and filled up imbalance. We're looking for a push upside into the order block formed.
NO TRADE IS GUARANTEED, USE PROPER RISK MANAGEMENT!!!
GBPUSD(20250613)Today's AnalysisMarket news:
The number of initial jobless claims in the United States for the week ending June 7 was 248,000, higher than the expected 240,000, the highest since the week of October 5, 2024. The monthly rate of the core PPI in the United States in May was 0.1%, lower than the expected 0.30%. Traders once again fully priced in the Fed's two interest rate cuts this year.
Technical analysis:
Today's buying and selling boundaries:
1.3585
Support and resistance levels
1.3685
1.3648
1.3624
1.3547
1.3522
1.3485
Trading strategy:
If the price breaks through 1.3624, consider buying in, the first target price is 1.3648
If the price breaks through 1.3585, consider selling in, the first target price is 1.3547

Possible bearish outlook Seeing how price reacted the previous liquidity, I would e looking for bearishness to the Downside
