GBPUSD | 26.06.2025SELL 1.37400 | STOP 1.38200 | TAKE 1.36400 | After consolidation around the medium-term highs, a corrective downward movement is likely and price consolidation under the level of 1.37000.
GBPUSD trade ideas

Gbpusd Daily_TF Analysis within the bearish flag GBP/USD Daily Timeframe Analysis
1. The price is still trading within a bearish flag pattern on the daily chart.
2.Currently, the price is in a significant high on the higher timeframe.
3. There has been a recent breakout of resistance on the Daily Timeframe.
4. The breakout occurred at the same spot as the trendline breakout.
Expectation: We can anticipate a potential move to the downside for a retest of the previous resistance breakout level and the broken trendline. After a successful retest, the overall bullish trend may continue.

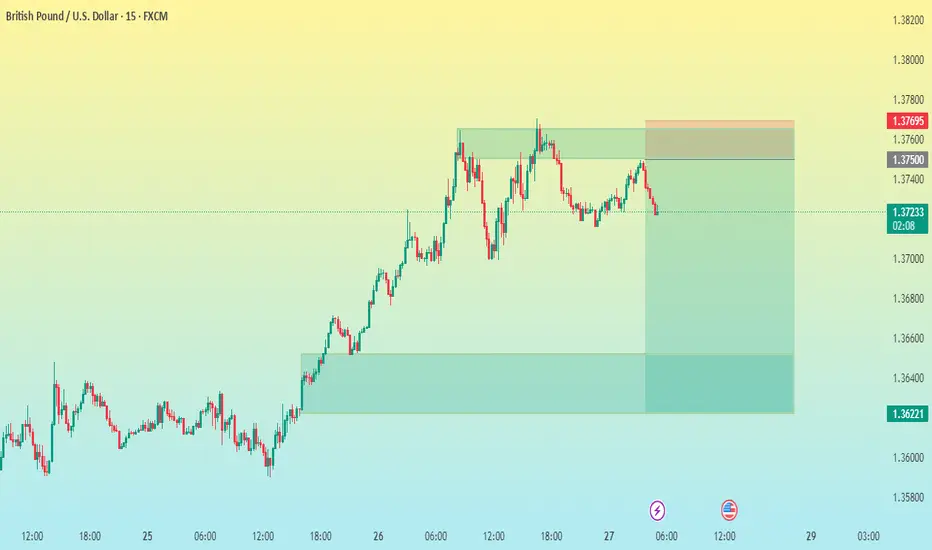
GBPUSD: Short Signal with Entry/SL/TP
GBPUSD
- Classic bearish pattern
- Our team expects retracement
SUGGESTED TRADE:
Swing Trade
Sell GBPUSD
Entry - 1.3710
Stop - 1.3765
Take - 1.3604
Our Risk - 1%
Start protection of your profits from lower levels
Disclosure: I am part of Trade Nation's Influencer program and receive a monthly fee for using their TradingView charts in my analysis.
❤️ Please, support our work with like & comment! ❤️

GU Bearish Friday ForecastHi everyone, hope we've all had a good week.
Here is my forecast for GBPUSD for today. After a fairly bullish week, I'm expecting some bearish price action to give us that top wick on the weekly candle close.
I'm looking at 2 price points, a pivot from 1.375 towards key level 1.37.
I'll post an update at the end of the day on how price ended up unfolding.
Regards,
Aman | SMC Wolf FX
1-1 student onboarding is currently open (website in my signature & profile)

Fundamental Market Analysis for June 27, 2025 GBPUSDThe GBP/USD pair held positive momentum near 1.3735 during Asian trading on Friday.
Concerns over the Fed's future independence continue to undermine the US Dollar and create a tailwind for the major pair. U.S. President Donald Trump's announcement that he is considering selecting the next Fed chairman ahead of schedule, which has spurred fresh controversy over U.S. rate cuts. Trump said the list of potential successors to Powell had shrunk to “three or four people”, without naming any finalists.
In addition, weaker-than-expected US gross domestic product (GDP) data also sent the dollar lower. The U.S. economy contracted faster than expected in the first three months of this year, falling 0.5%, the U.S. Bureau of Economic Analysis (BEA) reported on Thursday. The figure was below the previous estimate and the market consensus of -0.2%.
Bank of England Governor Andrew Bailey warned earlier this week that interest rates are likely to continue to fall. At its June meeting, the UK central bank left interest rates unchanged at 4.25%, although three of the nine members of the Monetary Policy Committee (MPC) voted to cut interest rates.
Trading recommendation: BUY 1.3750, SL 1.3690, TP 1.3865

GU-Fri-27/06/25 TDA-Good resistance area 1.37500, PCE news laterAnalysis done directly on the chart
Follow for more, possible live trades update!
I often share my live trades in Tradingview public chat in London session, stay tuned!
Have priorities in your life.
What are the things that you consider to be top
before anything else?
Do you consider trading as top priority?
When facing doubts and insecurities, if you have
set a list of priorities, you'll likely to be more
oriented and not get lost easily shifting your focus
with your own top priorities.
Active in London session!
Not financial advice, DYOR.
Market Flow Strategy
Mister Y

GBP/USD 15M CHART PATTERNHere's a structured breakdown of your GBP/USD sell trade setup:
---
🧾 Trade Type:
Sell (Short)
📍 Entry Point:
1.37260
🎯 Take Profit Targets:
TP1: 1.37000
TP2: 1.36600
TP3: 1.36221
🛑 Stop Loss:
1.37695
---
📊 Risk-to-Reward Ratio (approximate):
Target Reward (pips) Risk (pips) RR Ratio
TP1 26 43.5 ~0.60
TP2 66 43.5 ~1.52
TP3 103.9 43.5 ~2.39
> Note: The RR becomes more favorable at deeper targets.
---
⚠ Things to Consider:
SL is relatively wide, so size your position accordingly based on your risk percentage (e.g., 1-2% of account).
Watch major economic events (e.g., BOE or Fed speeches, CPI, NFP) that could spike volatility.
Use a trailing stop after TP1 if you want to secure profits and ride lower.
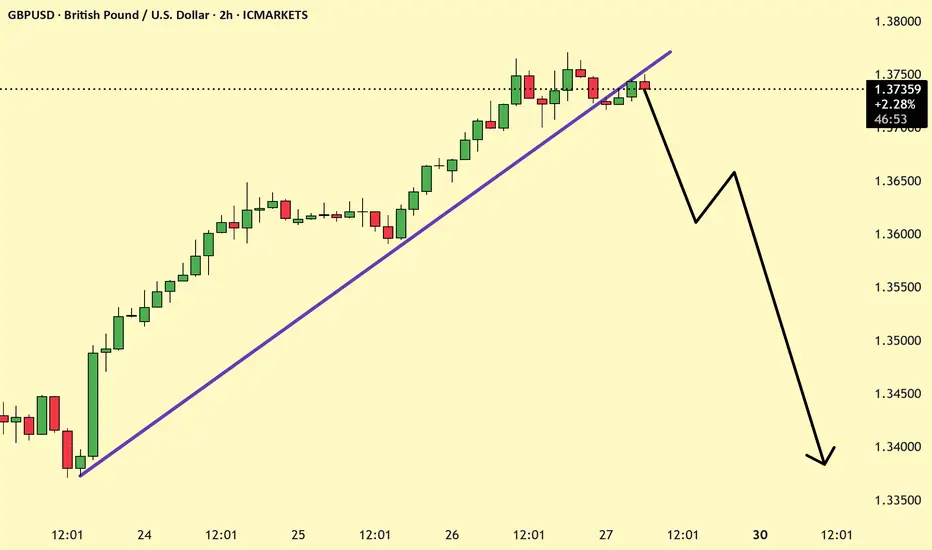
GBPUSD Boke trend line and retesting Recently GBPUSD is Trending upwards and now booke the trendline and is likely to go down now.
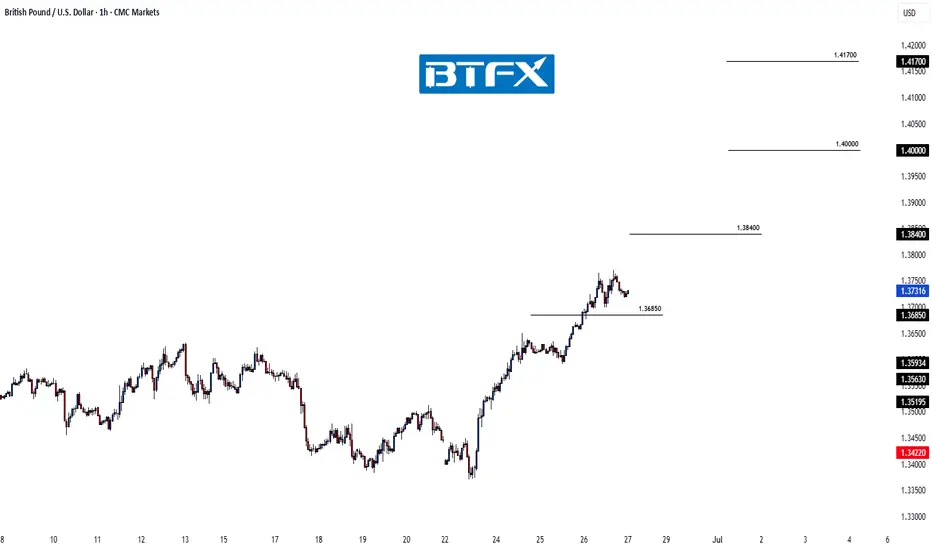
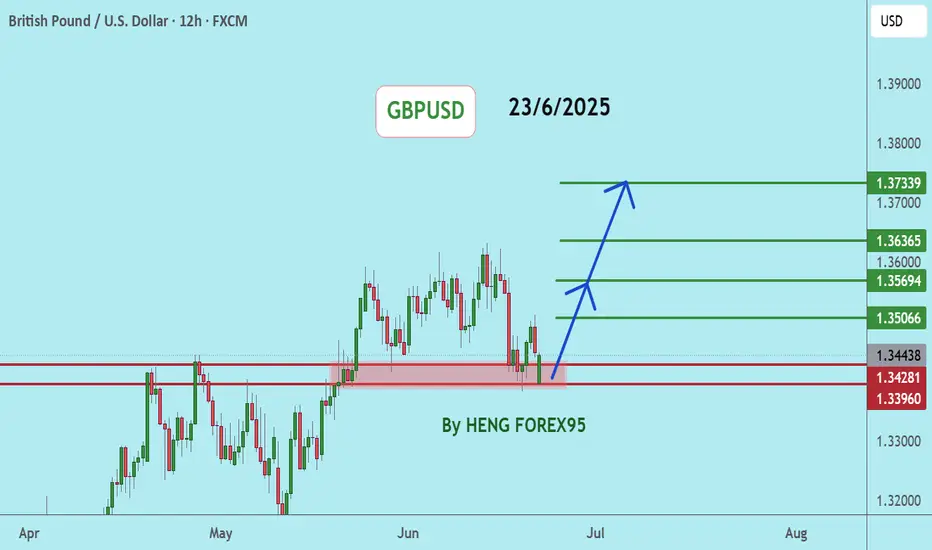
GBP/USD Rally in Full Swing – Bullish Targets AheadHi everyone,
Price achieved the 1.36850 having found support near the 1.33800 level.
As previously noted, the clearance of these levels strengthens our expectation for further upside, with the next key level of interest around 1.38400. We'll be watching to see how price action develops from here.
We’ll continue to provide updates on the projected path for GBP/USD as price approaches this target.
The longer-term outlook remains bullish, and we expect the rally to continue extending further from the 1.20991 January low towards 1.40000 and 1.417000.
We’ll be keeping you updated throughout the week with how we’re managing our active ideas. Thanks again for all the likes/boosts, comments and follows — we appreciate the support!
All the best for the week ahead. Trade safe.
BluetonaFX
Possible GBPUSD LONG TradeTargeting bullish imbalance Order block for a long trade.
Expecting a sweep of the 4H CRT, then a reaction from the bullish order block.

take profit smashedlast post highlighted the buy i was on and now target 🎯 has been smashed. Seeing more opportunities on both buy and sell

GBPUSD SCENARIo 26/06/2025English : According to our analysis, we anticipate a bearish scenario.
Morocan Darija : kanchofo d'apres l'analyse dyalna antsanaw hboot
ATENTION : I only share my ideas, not signals

GBPUSD Potential UpsidesHey Traders, in today's trading session we are monitoring GBPUSD for a buying opportunity around 1.37000 zone, GBPUSD is trading in an uptrend and currently is in a correction phase in which it is approaching the trend at 1.37000 support and resistance area.
Trade safe, Joe.

GBPUSD Bullish SetupGBPUSD is currently bullish and printing a HH so we can take an instant buy entry by making last HL as SL, TP is also mentioned

gbpusdThere is a high probability of a reversal within the specified range
The daily trend line at the ceiling has also caused the price to reverse
The sell order has a higher probability of success than the specified targets
The risk to reward is excellent

GBPUSD GBPUSD has completed its bullish leg, reaching our previously identified target zone.
Current price action indicates potential exhaustion, and we are now actively monitoring for a short setup, targeting the 1.37200 level, which aligns with a minor inefficiency and previous structural support turned resistance.
This move is supported by overextended intraday momentum on the 15-minute chart, along with bearish divergence forming against key price levels — suggesting a potential retracement phase.
Risk Management Strategy:
Entry: Upon confirmation of a bearish setup (e.g., rejection from a lower high or failure to break recent highs with strength).
Stop-Loss: Placed above the most recent swing high or invalidation level, ensuring protection against false breakouts.
Target: 1.37200, offering a favorable risk-to-reward ratio of at least 1:2.
We’ll continue to monitor price behavior closely and adjust if momentum shifts or invalidation levels are breached.

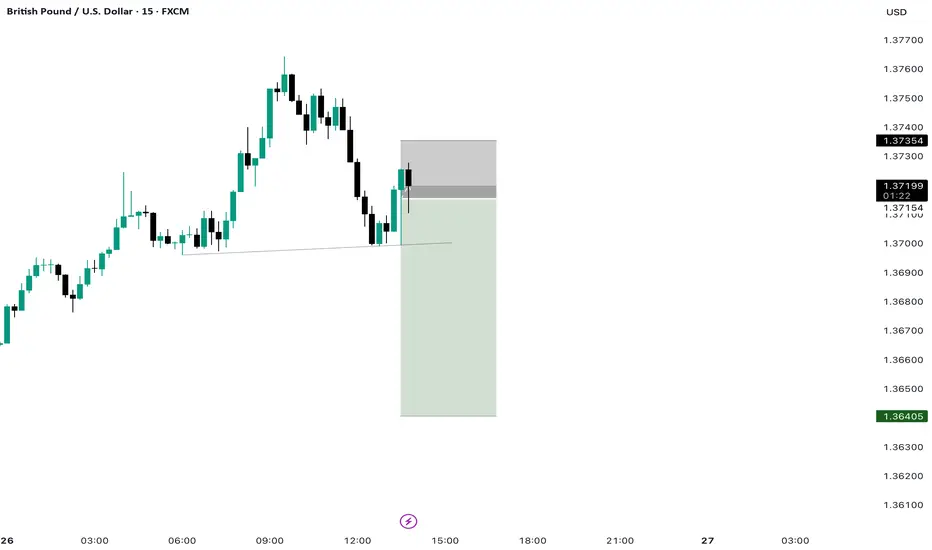
Market next target 🔁 Disruption of the Current Bullish Analysis
1. Resistance Rejection Likelihood
The chart suggests a breakout above resistance will turn the red box into support.
Disruption: The price is currently at a key resistance zone, and multiple rejections in this area previously suggest selling pressure.
We could see a double top formation or a false breakout trapping bulls.
Look for wicks or long upper shadows indicating weakness.
2. Volume Divergence
Recent bullish candles show declining or inconsistent volume.
Disruption: A strong bullish breakout requires rising volume. If volume doesn't confirm price action, this move may lack conviction and reverse sharply.
3. Overbought Conditions
After a strong uptrend, RSI or Stochastic indicators (not shown, but implied) could be entering overbought territory.
Disruption: This suggests limited upside and a potential for mean reversion or correction.
4. Bearish Candlestick Pattern Watch
Watch closely for a bearish engulfing, shooting star, or evening star at this resistance zone.
Disruption: Any bearish reversal pattern here would strongly contradict the bullish breakout thesis.

GBP/USD Surges to Three-Year Highs- PCE on tapSterling held slope resistance for more than three-weeks with a defense of support this week attempting to mark an outside-weekly reversal candle. The advance is testing resistance today at the 2022 swing high near 1.3749 and the focus is on the weekly close with respect to this pivot zone.
Initial weekly support now rests with the June opening-range highs near 1.3633 and is backed by the 78.6 % retracement of the 2021 decline at 1.3414. Broader bullish invalidation now raised to the April high-week close (HWC) at 1.3270- losses below this threshold would suggest a more significant high is in place / a larger reversal is underway towards the 2023 HWC at 1.3092.
A breach / weekly close above 1.3749 is needed to keep the immediate advance viable with subsequent resistance objectives eyed at the 61.8% extension of the 2022 advance at 1.4003 and the 2021 HWC at 1.4158- both levels of interest for possible topside exhaustion / price inflection IF reached.
Bottom line: A breakout of the monthly opening-range takes GBP/USD into initial resistance at the 2022 swing highs with weekly momentum pressing into overbought territory today. From at trading standpoint, a good zone to reduce portions of long-exposure / raise protective stops- losses would need to be limited to 1.3632 IF price is heading higher on this stretch with a close above 1.3749 needed to mark uptrend resumption.
-MB

Analysis of Trades and Trading Tips for the GBP/USDThe test of the 1.3614level occurred when the RSI indicator had already risen significantly above the zero line, which limited the pair's upside potential. For this reason, I did not buy the GBP/USD.
There has been progress in the trade negotiations between China and the United States: yesterday, both sides stated that consensus had been reached on the main issues. This breakthrough, the result of several months of intense discussions, gives hope for the stabilization of global financial markets. Though not disclosed in detail, the agreements likely included key issues such as the export of rare earth materials from China to the U.S. to China. Nevertheless, despite the optimistic statements, analysts advise against excessive enthusiasm. Previous negotiation rounds also ended with promises that were later unfulfilled. The key to success will be boss sides' ability to honor their commitments and show willingness for further concessions. The impact of this progress on the global economy is hard to overestimate. Reducing trade tensions could stimulate the growth of international trade, ease inflationary pressures, and bolster consumer confidence. However, risks remain, and the agreement's long-term outcome will depend on both countries' subsequent actions.
Today, we should pay attention to the speech by Philip Lane, a British Central Bank representative, as there are no macroeconomic releases from the the eurozone. Markets will closely monitor his rhetoric for hints regarding the central bank's plans on interest rates. Investors hope to hear more clarity from Lane about how the ECB intends to proceed with rates and whether the regulator plans further cuts this summer. Overall, Philip Lane's speech will be the key event of the day for financial markets. His comments may influence currency movements in the first half of the day. Investors are advised to watch his remarks closely and consider them in decision-making

GBPUSD SHORTAdded to the position as a clear head and shoulders has formed on the lower time frame. Expecting price to move lower from here.
GBPUSD → Pre-breakout consolidation. One step away from a rallyFX:GBPUSD is trading in consolidation. Against the backdrop of the falling dollar index, the currency pair is testing resistance at 1.3632 but is not yet ready to bounce down.
Against the backdrop of the dollar's decline due to fundamental reasons, the GBPUSD currency pair is strengthening. Technically, this could lead to the price breaking out of consolidation upwards. A pre-breakout base is forming relative to the upper boundary of consolidation. The price is compressing towards the level, volatility is decreasing, which in general could lead to a breakout of resistance - trigger 1.3632. The exit from consolidation may be accompanied by distribution. The liquidity zone with W1 can be considered as a target.
Resistance levels: 1.3632, 1.3743
Support levels: 1.3593, 1.3508
The global and local trends are bullish. After growth, consolidation is forming. Against the backdrop of the falling dollar, GBPUSD is testing resistance. The reaction to the false breakout of resistance is weak. The chances of a breakout are quite high.
Best regards, R. Linda!

GBPUSDGBPUSD price is near the support zone 1.33917. If the price cannot break through 1.33917, it is expected that the price will have a chance to bounce back. Consider buying in the red zone.
🔥Trading futures, forex, CFDs and stocks carries a risk of loss.
Please consider carefully whether such trading is suitable for you.
>>GooD Luck 😊
❤️ Like and subscribe to never miss a new idea!
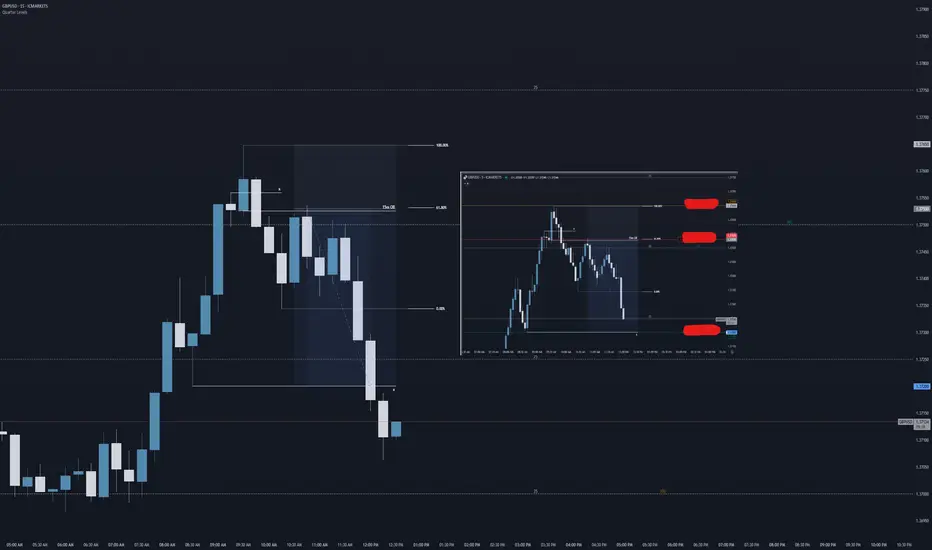
GU Sniper Trade ReviewTook this extremely precise trade this morning on GBP/USD off the 15 minute chart.
We're trading at price highs from 2022, due to all the current fundamentals (which needs to be a topic for another day).
But price showed some really good bearish confluences for a nice session based trade.
Entry was based on the below technical analysis logic:
- 15m order block
- 61.8% FIB retracement (golden ratio)
- 1.375 key price level ( the secret sauce ;) )
I set a conservative TP off a previous 5m structure low and SL was simply set at the current structure high.
This resulted in a 1:3RR trade setup.
Aman | SMC Wolf FX
p.s. i'm currently taking on students who are wanting to learn the way I trade with precision (check out my signature)