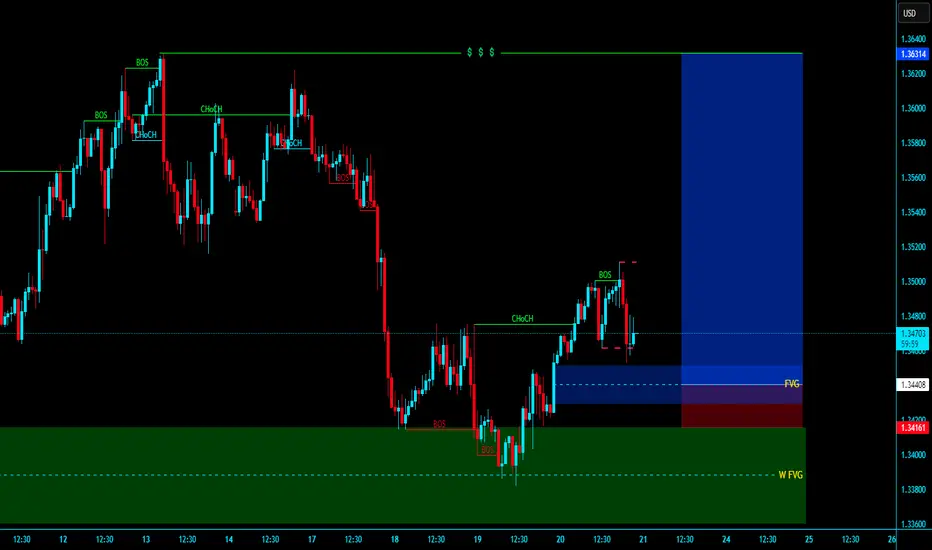
# GBPUSD WEEKLY FVG MITIGATED AND MSS ENTYR IN FVG # GBPUSD Weekly FVG Mitigated and mss our entry in fvg and target is our BSL
GBPUSD trade ideas
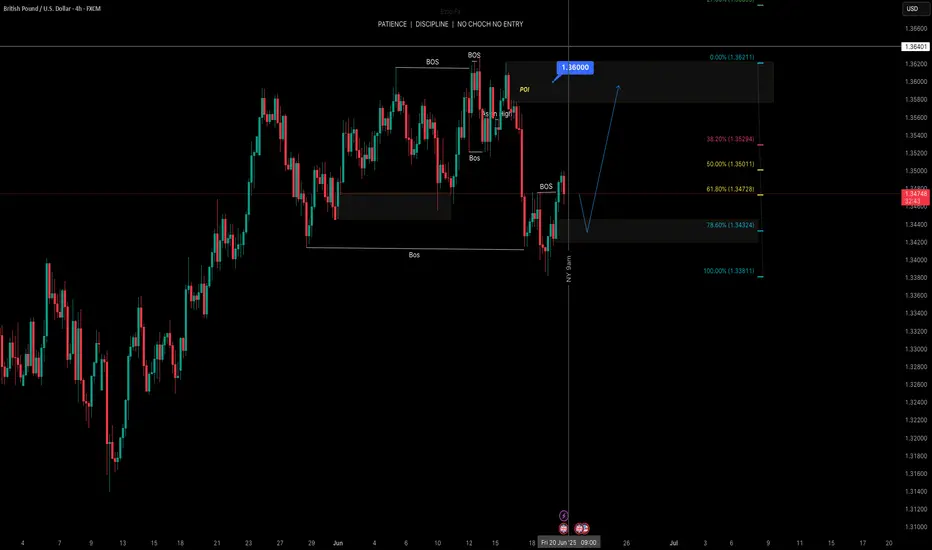
GU SHORTSo start from DXY >Bullish on Daily and was Daily FVG that Daily FVG after close of 4H candle in N-Y session that led me to think that Daily FVG will BE break way gap
So take a trade on GU after starting to see Luck of creating FVG to the upside in 4H
In 15 minutes, I just entered, and my SL was above 1H IFVG

GBPUSD MORE UPSIDEI'm expecting price to go up to 1.352-1.3535 before going down more. Right now, I see it as a buy, now it took the liquidity($$$).

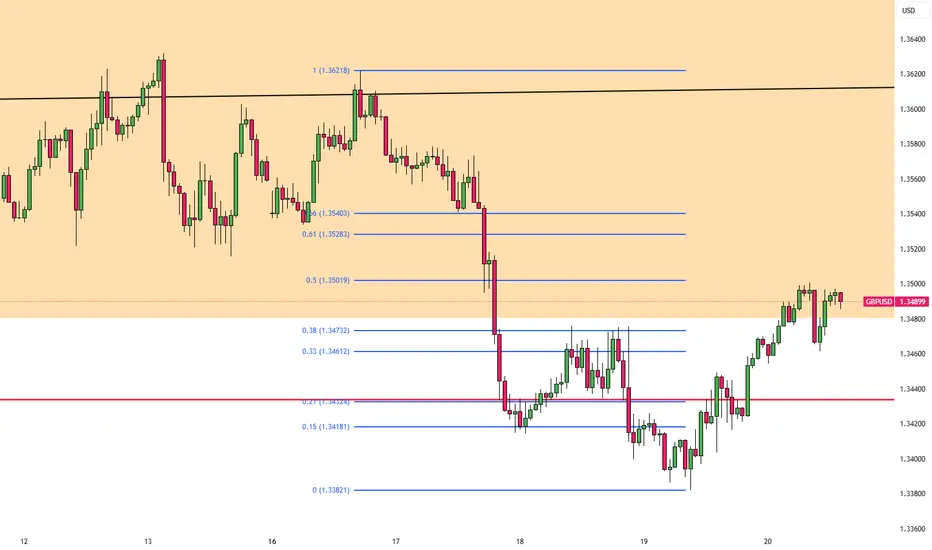
GBP/USD Daily Chart Analysis – June 20, 2025📉 GBP/USD Daily Chart Analysis – June 20, 2025 📊
📌 Chart Overview:
The GBP/USD pair is currently experiencing a critical technical phase. After a strong bullish rally from January 2025, price action has approached a key resistance level near the 1.3600 zone. Here's the detailed breakdown:
🟦 Key Highlights:
🔹 Resistance Zone 💥
Price is testing a major horizontal resistance between 1.3450 – 1.3600. This area has acted as a supply zone where sellers are currently active.
🔹 Trendline Support 🔺
A long-standing bullish trendline, active since early 2025, has been retested multiple times, confirming the trend’s strength.
🔹 Retest in Progress 🔄
Price recently pulled back after hitting the resistance and is now retesting the broken trendline, indicating a potential shift in trend if the trendline fails to hold.
🔹 Fake Breakout ⚠️
An earlier attempt to break below the trendline in April turned out to be a false breakout, which fueled bullish continuation. A similar scenario could be developing.
📊 Technical Outlook:
📈 If price breaks and closes above 1.3600, it would indicate strong bullish momentum and could open doors toward new highs.
📉 However, if the trendline breaks convincingly and retest fails, sellers may gain control with potential downside targets around 1.3200 and 1.3000.
📍 Conclusion:
GBP/USD is at a make-or-break zone 🧨. Traders should monitor the reaction at the trendline and resistance closely. Breakout or rejection here will shape the mid-term direction.
🔔 Watch for confirmation signals before entering positions.

UK retail sales slide, Pound edges higherThe British pound has gained ground for a second straight day. In the European session, GBP/USD is trading at 1.3496, up 0.22% on the day.
UK retail sales took a tumble in May, falling 2.7% m/m. This followed an upwardly revised 1.3% increase in April and was much worse than the market estimate of -0.5%. This marked the steepest decline since December 2023 and was driven by a sharp drop in food store sales.
Consumers are being squeezed by inflation and are pessimistic about economic conditions - Gfk consumer confidence for June rose slightly to -18 from -20. Annually, retail sales dropped 1.3%, following a 5.0% gain in April and missing the market estimate of 1.7%. This was the weakest reading since April 2024.
The dismal retail sales report reflects the volatile economic landscape and there may not be a light at the end of the tunnel for some time. The Israel-Iran war could lead to oil prices continuing to rise and the uncertainty over US tariffs will only add to the worries of the UK consumer.
The Bank of England held rates on Thursday but the weak retail sales report will add pressure on the central bank to lower rates in the summer. The markets expect one or two rate cuts in 2025, but the main impediment to a rate cut is stubbornly high inflation.
Inflation ticked lower to 3.4% y/y in May from 3.5% a month earlier. The core rate dropped to 3.5% from 3.8% but these numbers are still too high, well above the BoE's target of 2%. Without signs that inflation is easing, it will be difficult for the BoE to justify a rate cut.
GBP/USD is testing resistance at 1.3498. Above, there is resistance at 1.3527
1.3440 and 1.3411 are providing support

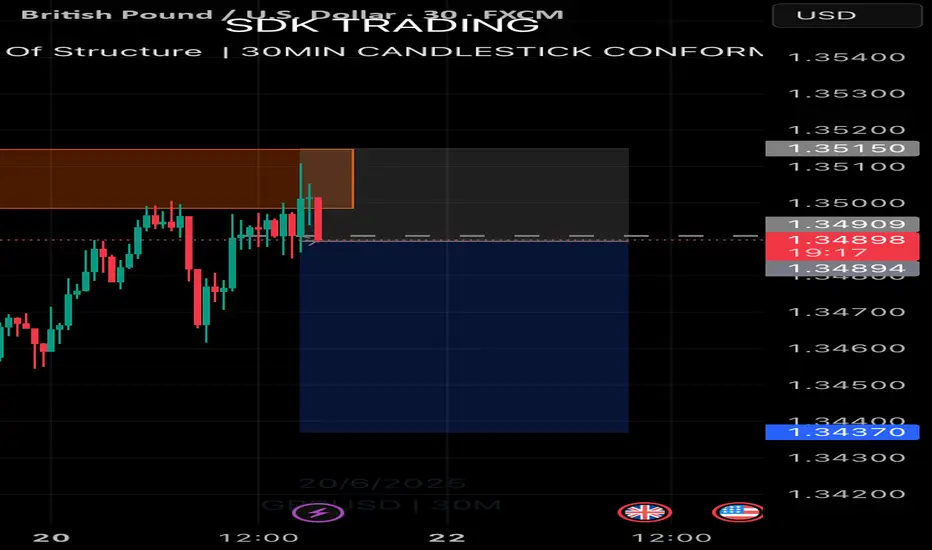
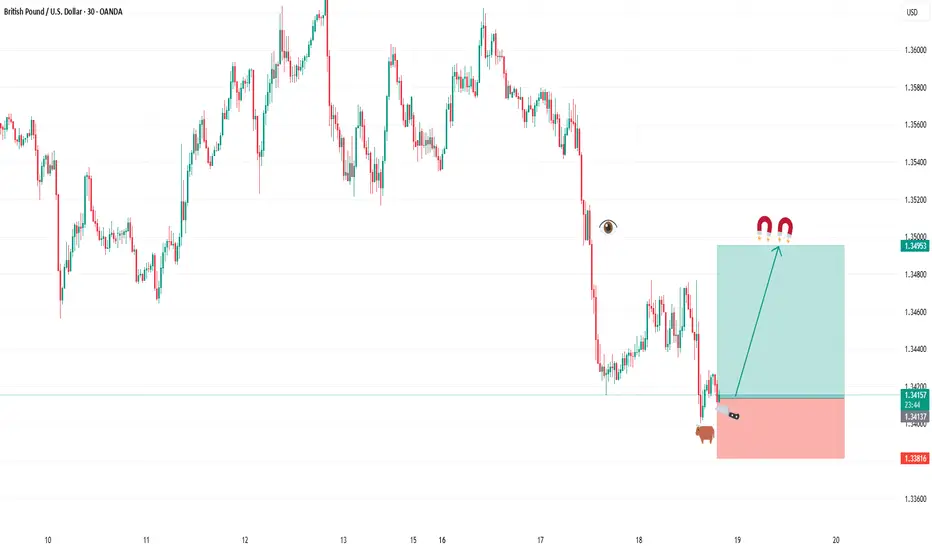
GBPUSD ShortDaily biased is to the downside. Price has retested and rejected a 30min orderblock. There is also a change of character on the 30min timeframe to the downside. Take profit is at 1.3459 and stop loss is at 1. 35150.
GBPUSD Wave Analysis – 20 June 2025
GBPUSD: ⬆️ Buy
- GBPUSD reversed from support zone
- Likely to rise to the resistance level at 1.3600
GBPUSD currency pair recently reversed up from the support zone located between the support level 1.3400 (former resistance from April), lower daily Bollinger Band and 50% Fibonacci correction of the upward impulse from May.he upward reversal from this support zone continues the active daily uptrend from the start of this year.
GBPUSD currency pair can be expected to rise to the next resistance level at 1.3600 (which stopped the previous impulse wave (5) earlier this month).

GBPUSD hit its 1D MA50. Perfect buy signal.The GBPUSD pair has been trading within a Channel Up pattern since the January 13 2025 market bottom. Yesterday it hit its 1D MA50 (blue trend-line) for the first time since April 08.
This is the most efficient buy entry as the 1D MA50 has been supporting since the February 13 break-out. Even the 1D CCI turned oversold and rebounded, which is consistent with all bottom buys inside the Channel Up.
The Bullish Leg can extend to as high as +5.05% but due to the presence of the Inner Higher Highs trend-line, we first target 1.3850 (+3.43% rise).
-------------------------------------------------------------------------------
** Please LIKE 👍, FOLLOW ✅, SHARE 🙌 and COMMENT ✍ if you enjoy this idea! Also share your ideas and charts in the comments section below! This is best way to keep it relevant, support us, keep the content here free and allow the idea to reach as many people as possible. **
-------------------------------------------------------------------------------
💸💸💸💸💸💸
👇 👇 👇 👇 👇 👇

GBP/USD Stable as BoE Vote SplitsThe pound steadied near 1.34 following the Bank of England’s decision to hold rates. The vote revealed deeper division than expected, with six members supporting a hold and three pushing for a 25 basis point cut, contrary to forecasts of a 7-2 split.
The BoE faces a tough balancing act as it weighs sticky inflation, geopolitical risks, and the economic drag of US tariffs.
Resistance is seen at 1.3500, while support holds at 1.3415.
GBPUSD Downward AnalysisThe GBP/USD pair continues to gain ground for the second successive session, trading around 1.3500 during the Asian hours on Friday. The bullish bias persists as the daily chart’s technical analysis indicates that the pair remains within the ascending channel pattern.

Sell trade GBP/USD Sell Trade Note:
The GBP/USD pair is currently under bearish pressure, reflecting stronger USD sentiment due to expectations of prolonged higher interest rates by the Fed and weaker UK economic outlook. Key support levels to watch are around 1.2600 and 1.2550. A break below these may confirm further downside. Resistance is around 1.2700–1.2750; any retracements toward these levels could present new selling opportunities.
Sentiment: Bearish below 1.2700
Risk Factors: UK economic data, US Fed commentary, geopolitical events.
---
Let me know if you want a more technical or fundamental analysis.

The Day AheadFriday, June 20 – Key Economic Data & Central Bank Events
United States
Philadelphia Fed Business Outlook (June) – Regional manufacturing sentiment indicator.
Leading Economic Index (May) – Composite of 10 leading indicators, used to forecast future economic activity.
China
1-Year & 5-Year Loan Prime Rates – Benchmark lending rates set by the PBoC; key for signaling monetary policy stance.
United Kingdom
GfK Consumer Confidence (June) – Measures households’ economic sentiment.
Retail Sales (May) – Key consumer spending metric.
Public Sector Net Borrowing (May) – Government fiscal position.
Japan
National CPI (May) – Headline and core inflation data, relevant for BoJ policy stance.
Germany
Producer Price Index (PPI, May) – Upstream inflation measure, potential signal for consumer price trends.
France
Business Confidence (June) – Insight into industrial sentiment.
Retail Sales (May) – Consumer activity and domestic demand tracker.
Eurozone
Consumer Confidence (June, flash) – Early indication of household sentiment across the bloc.
M3 Money Supply (May) – Broad monetary aggregate, important for ECB’s inflation monitoring.
Canada
Retail Sales (April) – Key consumer spending indicator.
Industrial Product Price Index (May) – Measures price changes for goods sold by manufacturers.
Central Banks
ECB – Publishes its Economic Bulletin, offering insights into economic conditions and policy outlook.
Bank of Japan (BoJ) – Governor Kazuo Ueda speaks; markets will watch for commentary on yield curve control, inflation expectations, and timing of policy normalization.
This communication is for informational purposes only and should not be viewed as any form of recommendation as to a particular course of action or as investment advice. It is not intended as an offer or solicitation for the purchase or sale of any financial instrument or as an official confirmation of any transaction. Opinions, estimates and assumptions expressed herein are made as of the date of this communication and are subject to change without notice. This communication has been prepared based upon information, including market prices, data and other information, believed to be reliable; however, Trade Nation does not warrant its completeness or accuracy. All market prices and market data contained in or attached to this communication are indicative and subject to change without notice.

Upondo qatha neDolaThe FX:GBPUSD pair is projected to reach a high of 1.403 in the near future, driven by a combination of factors including improving UK economic data, hawkish signals from the Bank of England, and a weakening U.S. dollar amid expectations of Federal Reserve rate cuts. Market sentiment has turned increasingly bullish on the pound, supported by stronger-than-expected inflation figures and resilient growth indicators. If current trends continue, the pair could test the 1.403 resistance level, marking a significant move in favor of sterling.

AUDUSD and GBPUSD Analysis todayHello traders, this is a complete multiple timeframe analysis of this pair. We see could find significant trading opportunities as per analysis upon price action confirmation we may take this trade. Smash the like button if you find value in this analysis and drop a comment if you have any questions or let me know which pair to cover in my next analysis.

Uptrend on the market The market broke the zone before and it retraced back in the zone now it's gaining momentum going up...the is possibility it will reach 1.35300

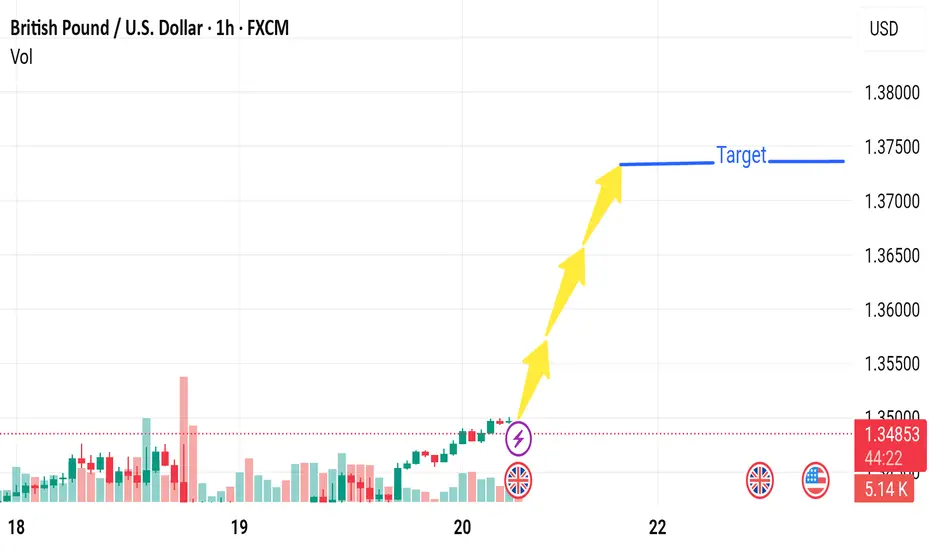
GBPUSD 1-hour chartGBPUSD Long Idea 🚀
Looks like a clear break of structure on the 1H chart! Price has pushed through resistance and is now potentially retesting the previous supply zone as new demand. Looking for a bounce here to continue the upward momentum.
Targets: 1.3600🎯
Stop Loss: 1.34118⛔

GBPUSD SHORT/SELL 1:3.5Reason for selling:
* Break of structure
* B wave of corrective structure forming
* Expanding flat forming
* MACD divergence
* Liquidity under 1.33860
Strategy to use: FIB retracement on 50/61.8
Engulfing candle to the downside
Entry: 1.35616
Stop Loss: 1.36155
Take Profit: 1.33875

Idea on a ChartGBP/USD found a slight rebound to muscle back above 1.3450 on Thursday.
Despite near-term Greenback strength on geopolitical concerns, markets took a break during the midweek US holiday session.
Israel-Iran tensions continue to rise, and the Trump administration is drawing out a decision on getting involved directly.
GBP/USD found some room on the high side on Thursday, climbing back above the 1.3450 level after catching an early technical bounce from the 1.3400 handle. Broad-market flows have favored the US Dollar recently as Middle East tensions continue to rise, but US markets were dark for a national holiday on Thursday, giving Cable some room to breathe and easing off of USD bidding.
BUY CABLEIn todays session we are monitoring GBPUSD for bullish opportunities. Our buy entry is at 1.34120 and stops are below 1.3380 our target is 1.3500. Use proper risk management and best of luck. Cheers
GU-Fri-20/06/25 TDA-DR 1.34921 hit, potential bearish continue!Analysis done directly on the chart
Follow for more, possible live trades update!
I trade from level to level and see how price
reacts to interest zone. I adapt my sl and tp
based on market conditions and as well the
risk per trade but generally 1% max risk or
lower.
Active in London session!
Not financial advice, DYOR.
Market Flow Strategy
Mister Y

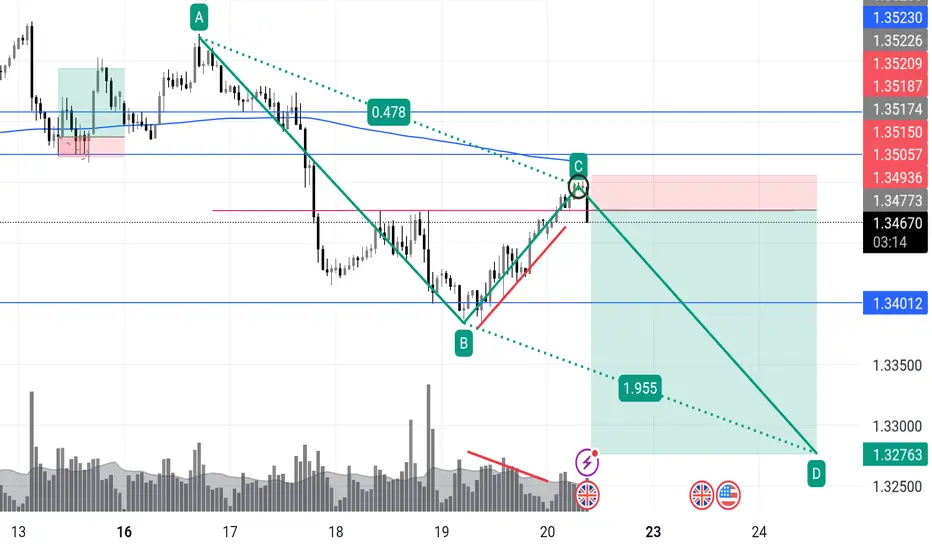
GBPUSD short!Classic Wyckoff upthrust, this is A+
We’ve got a clear AB=CD completion at C, tagging previous support-turned-resistance, while the volume on the climb is drying up (classic clue of passive buyers getting trapped). The channel top + Fibonacci confluence + previous swing zone adds weight.
🔻 Trade Idea:
Entry: 1.3477
Stop: 1.3521 (above wick highs and structure)
Target 1: 1.3401 (break structure)
Target 2: 1.3276 (full measured move / spring's origin)
Risk-Reward: ~3.5R
Volume divergence confirms exhaustion.
Ideal reaction would break through mid-line and sustain under 1.3401.
🔍 Watch For:
Bearish engulfing confirmation on 1h
Volume spike during breakdown = smart money selling
If price lingers above 1.3515, trap invalid
Market next target
🔻 Bearish Disruption Analysis
1. Overbought Conditions / RSI Exhaustion
The recent bullish momentum appears strong, but it could be entering overbought territory, especially on the 1-hour chart.
A correction may follow if technical indicators like RSI or MACD start diverging.
2. Resistance Zone at 1.35000 - 1.35500
The price is nearing a historical resistance area around 1.3500–1.3550, where sellers have previously stepped in.
Without strong volume or a news catalyst, this zone may reject further upside movement.
3. Low Volume Breakout
The breakout visible before the arrows is accompanied by relatively moderate volume, which can indicate a false breakout or bull trap.
4. Fundamental Uncertainty
Upcoming U.S. or UK economic data (indicated by the flags on the chart) could disrupt the expected bullish move.
Example: A strong USD labor report or hawkish Fed comment could reverse the GBP/USD rally.
GBPUSD(20250620)Today's AnalysisMarket news:
The Bank of England kept interest rates unchanged at 4.25%, and the voting ratio showed that internal differences were increasing. Traders expect the bank to cut interest rates by another 50 basis points this year.
Technical analysis:
Today's buying and selling boundaries:
1.3439
Support and resistance levels:
1.3526
1.3494
1.3473
1.3406
1.3385
1.3353
Trading strategy:
If it breaks through 1.3473, consider buying, and the first target price is 1.3494
If it breaks through 1.3439, consider selling, and the first target price is 1.3406
