How to trade GAPS in the market, SELL GBPUSD!!!!All the information you need to find a high probability trade are in front of you on the charts so build your trading decisions on 'the facts' of the chart NOT what you think or what you want to happen or even what you heard will happen. If you have enough facts telling you to trade in a certain direction and therefore enough confluence to take a trade, then this is how you will gain consistency in you trading and build confidence. Check out my trade idea!!
www.tradingview.com
GBPUSD trade ideas

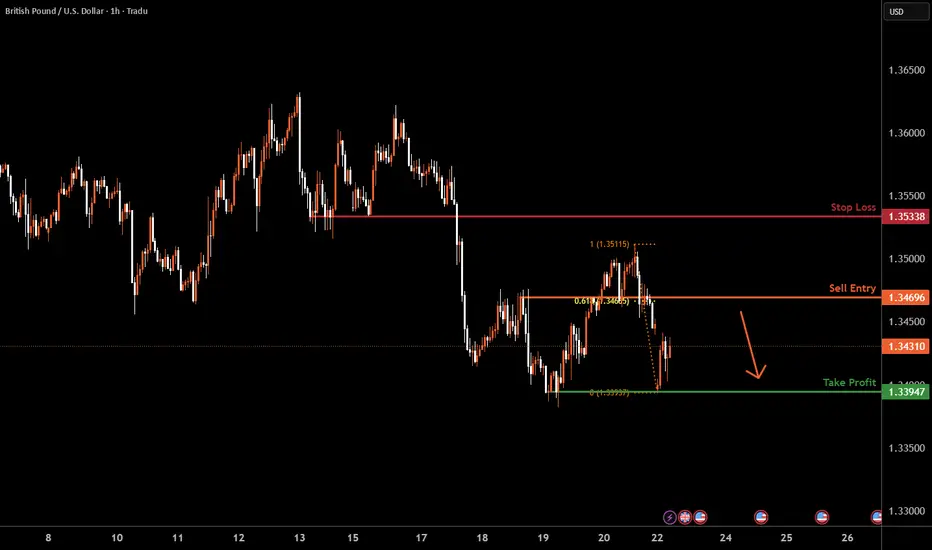
GBPUSD H1 I Bearish Reversal Based on the H4 chart, the price is rising our sell entry level at 1.3469, a pullback resistance that aligns with the 61.8% Fib retracement.
Our take profit is set at 1.3394, a swing low support.
The stop loss is set at 1.3533, a pullback resistance.
High Risk Investment Warning
Trading Forex/CFDs on margin carries a high level of risk and may not be suitable for all investors. Leverage can work against you.
Stratos Markets Limited (tradu.com ):
CFDs are complex instruments and come with a high risk of losing money rapidly due to leverage. 63% of retail investor accounts lose money when trading CFDs with this provider. You should consider whether you understand how CFDs work and whether you can afford to take the high risk of losing your money.
Stratos Europe Ltd (tradu.com ):
CFDs are complex instruments and come with a high risk of losing money rapidly due to leverage. 63% of retail investor accounts lose money when trading CFDs with this provider. You should consider whether you understand how CFDs work and whether you can afford to take the high risk of losing your money.
Stratos Global LLC (tradu.com ):
Losses can exceed deposits.
Please be advised that the information presented on TradingView is provided to Tradu (‘Company’, ‘we’) by a third-party provider (‘TFA Global Pte Ltd’). Please be reminded that you are solely responsible for the trading decisions on your account. There is a very high degree of risk involved in trading. Any information and/or content is intended entirely for research, educational and informational purposes only and does not constitute investment or consultation advice or investment strategy. The information is not tailored to the investment needs of any specific person and therefore does not involve a consideration of any of the investment objectives, financial situation or needs of any viewer that may receive it. Kindly also note that past performance is not a reliable indicator of future results. Actual results may differ materially from those anticipated in forward-looking or past performance statements. We assume no liability as to the accuracy or completeness of any of the information and/or content provided herein and the Company cannot be held responsible for any omission, mistake nor for any loss or damage including without limitation to any loss of profit which may arise from reliance on any information supplied by TFA Global Pte Ltd.
The speaker(s) is neither an employee, agent nor representative of Tradu and is therefore acting independently. The opinions given are their own, constitute general market commentary, and do not constitute the opinion or advice of Tradu or any form of personal or investment advice. Tradu neither endorses nor guarantees offerings of third-party speakers, nor is Tradu responsible for the content, veracity or opinions of third-party speakers, presenters or participants.

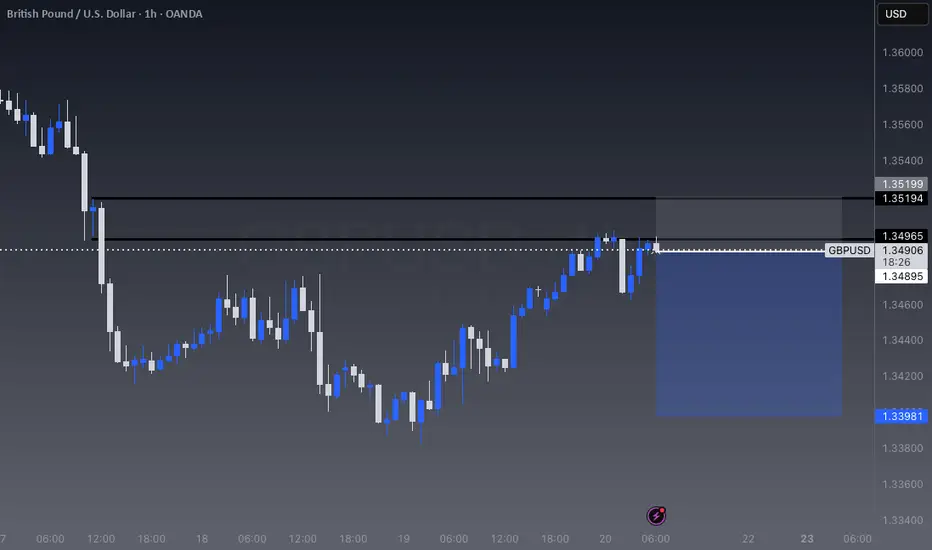
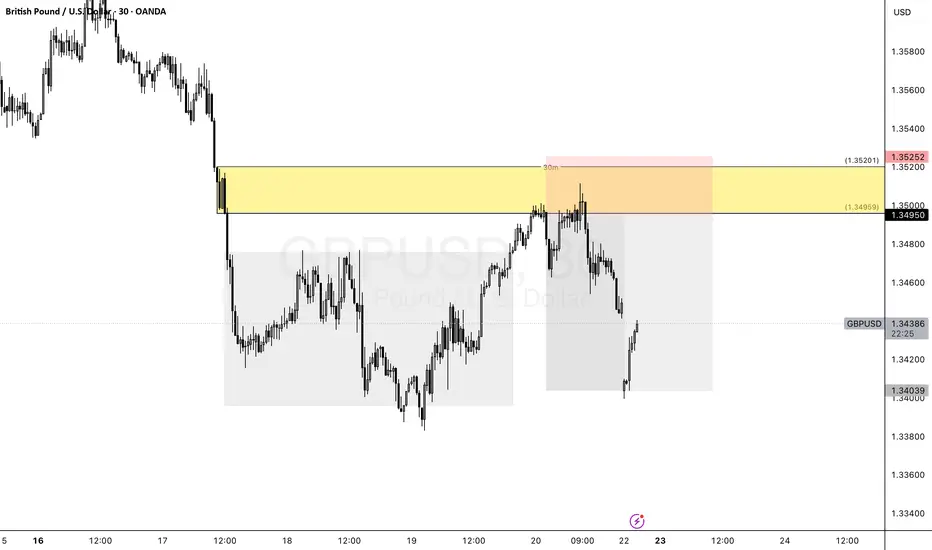
gbpusd 30 supply great example on the 30 min timeframe.
drop base drop , fair value. supply identified for a one to three risk to reward.
GBPUSDDID YOU KNOW THAT YOUR COUNTRY CENTRAL BANKS HAVE ANOTHER
CENTRAL BANK AND IS CALLED BIS(BANK OF INTERNATIONAL SETTLEMENTS )???
The Bank for International Settlements (BIS) was established in 1930 at the Hague Conference, making it the world's oldest international financial institution. Its initial purpose was to facilitate the settlement of World War I reparations and to promote cooperation among central banks.
The BIS trading market refers to the role of the Bank for International Settlements (BIS) as a key intermediary and facilitator in global financial markets, particularly in foreign exchange (FX) and central bank transactions
BIS is a secretive institution with sovereign immunity that can move trillions without oversight. aka central bank of central banks in Basel Swissland with over 63 members in the world which are centrals banks of countries that make up 95% of world GDP.
Key Points about BIS and Its Trading Market Role:
Central Bank’s Central Bank: BIS acts as a bank for central banks and international organizations, providing banking services such as accounts, gold and currency transactions, asset management, and short-term collateralized loans.
Market Intermediary: BIS frequently conducts large-scale transactions on behalf of central banks in the foreign exchange and gold markets. These trades are often substantial, reflecting central banks’ reserve management or monetary policy operations.
Avoiding Market Misinterpretation: When BIS buys or sells currencies or assets, it is usually acting for a central bank, not itself, helping avoid markets mistaking these large trades for speculative or official government interventions.
Forum for Cooperation: BIS provides a platform for central banks to exchange information, coordinate policies, and cooperate on monetary and financial stability, which indirectly influences market dynamics.
Research and Statistics: BIS publishes data and analysis on global banking, FX, derivatives markets, and financial stability, supporting informed decision-making in the trading community.
Summary
The BIS trading market is not a public exchange but a specialized, high-level market where BIS facilitates and conducts financial transactions for central banks, particularly in foreign exchange and gold. Its activities help central banks manage reserves and implement monetary policy while fostering international financial cooperation.
if you know you know because BOE (BANK OF ENGLAND ) and FED (FEDERAL RESERVE ) are members .
GBPUSD 10 YEAR BOND YIELD ,INTEREST RATE ,INTEREST RATE DIFFERENTIAL AND CARRY TRADE ADVANTAGE .
1. Current Rates and Yields
Metric United Kingdom (GBP) United States (USD) Differential (UK - US)
10-Year Bond Yield 4.54% 4.38% +0.16% (16 bps)
Policy Interest Rate 4.25% 4.25%–4.50% -0.25% to -0.01%
UK Context: The Bank of England (BoE) held rates at 4.25% amid sticky inflation (3.4% YoY in May ) but signaled potential cuts in August.
US Context: The Federal Reserve held rates at 4.25%–4.50%, prioritizing inflation control despite slowing growth .
2. Interest Rate Differential and Carry Trade Advantage
Yield Spread: The UK 10-year gilt yields 0.16% more than the US 10-year Treasury, creating a modest yield pickup for GBP-denominated bonds .
Policy Rate Spread: The USD offers a 0.25% higher short-term rate (using the Fed’s 4.50% upper bound vs. BoE’s 4.25%) .
Carry Trade Mechanics:
GBP-USD Strategy: Borrow USD at 4.50% and invest in GBP assets at 4.54% (10-year gilt) for a net carry of +0.04%.
USD-GBP Strategy: Borrow GBP at 4.25% and invest in USD assets at 4.38% (10-year Treasury) for a net carry of +0.13%.
Key Risks:
Currency Volatility: GBP/USD at 1.34–1.35 could erase gains if the dollar strengthens.
Policy Shifts: BoE rate cuts (expected August 2025) may narrow the yield spread , while Fed cuts could reduce USD rate advantages .
3. Market Outlook
UK Focus: Inflation persistence may delay BoE cuts, supporting GBP yields near-term .
US Focus: Fed’s "higher for longer" stance and tariff-related inflation risks could sustain USD yield appeal .
Carry Viability: The USD-GBP strategy offers a slight edge (0.13% carry) but requires hedging against GBP appreciation risks.
Summary
Yield Advantage: UK 10-year gilts yield 0.16% more than US Treasuries, but USD short-term rates are 0.25% higher.
Optimal Carry: Borrowing GBP to invest in USD assets (0.13% carry) is marginally favorable, though policy uncertainty warrants caution.
Critical Factors: Monitor BoE/Fed rate decisions and GBP/USD trends for carry trade adjustments.

Bullish bounce?The Cable (GBP/USD) is falling towards the pivot and could bounce to the 1st resistance.
Pivot: 1.3328
1st Support: 1.3133
1st Resistance: 1.3636
Risk Warning:
Trading Forex and CFDs carries a high level of risk to your capital and you should only trade with money you can afford to lose. Trading Forex and CFDs may not be suitable for all investors, so please ensure that you fully understand the risks involved and seek independent advice if necessary.
Disclaimer:
The above opinions given constitute general market commentary, and do not constitute the opinion or advice of IC Markets or any form of personal or investment advice.
Any opinions, news, research, analyses, prices, other information, or links to third-party sites contained on this website are provided on an "as-is" basis, are intended only to be informative, is not an advice nor a recommendation, nor research, or a record of our trading prices, or an offer of, or solicitation for a transaction in any financial instrument and thus should not be treated as such. The information provided does not involve any specific investment objectives, financial situation and needs of any specific person who may receive it. Please be aware, that past performance is not a reliable indicator of future performance and/or results. Past Performance or Forward-looking scenarios based upon the reasonable beliefs of the third-party provider are not a guarantee of future performance. Actual results may differ materially from those anticipated in forward-looking or past performance statements. IC Markets makes no representation or warranty and assumes no liability as to the accuracy or completeness of the information provided, nor any loss arising from any investment based on a recommendation, forecast or any information supplied by any third-party.

GBPUSDBULLISH GU top down observation anticipating a break of the highs you can find the lower time frame idea below.


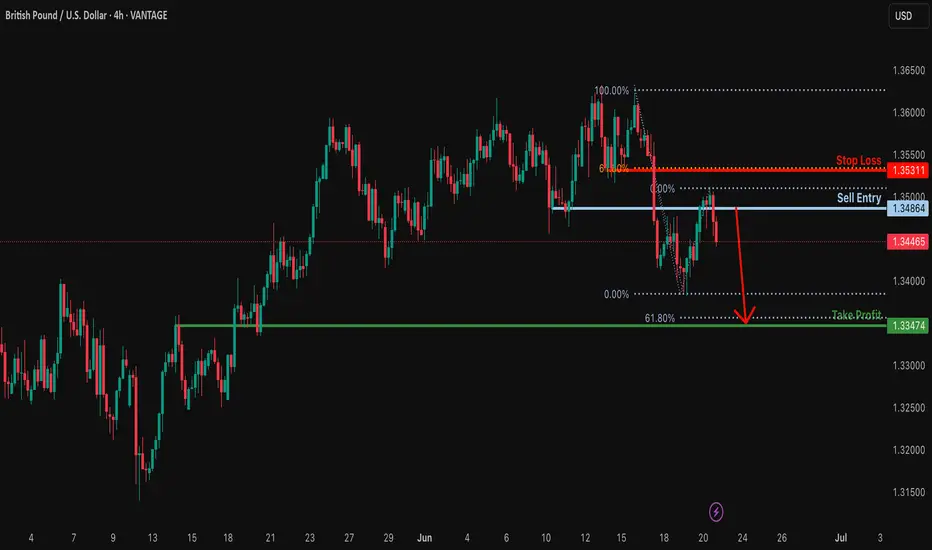
Bearish drop off pullback resistance?GBP/USD has rejected off the resistance level which is a pullback resistance and could drop from this level to our take profit.
Entry: 1.3486
Why we like it:
There is a pullback resistance level.
Stop loss: 1.3531
Why we like it:
There is a pullback resistance level that aligns with the 61.8% Fibonacci retracement.
Take profit: 1.3347
Why we like it:
There is a pullback support level that lines up with the 61.8% Fibonacci projection.
Enjoying your TradingView experience? Review us!
Please be advised that the information presented on TradingView is provided to Vantage (‘Vantage Global Limited’, ‘we’) by a third-party provider (‘Everest Fortune Group’). Please be reminded that you are solely responsible for the trading decisions on your account. There is a very high degree of risk involved in trading. Any information and/or content is intended entirely for research, educational and informational purposes only and does not constitute investment or consultation advice or investment strategy. The information is not tailored to the investment needs of any specific person and therefore does not involve a consideration of any of the investment objectives, financial situation or needs of any viewer that may receive it. Kindly also note that past performance is not a reliable indicator of future results. Actual results may differ materially from those anticipated in forward-looking or past performance statements. We assume no liability as to the accuracy or completeness of any of the information and/or content provided herein and the Company cannot be held responsible for any omission, mistake nor for any loss or damage including without limitation to any loss of profit which may arise from reliance on any information supplied by Everest Fortune Group.
Bearish GBP/USD Outlook: Shorting the Pound Against the DollarI can write a lot of text here but let make it short, liek and sub from you for that:
3 options:
pump till PDH then dump to weekly FVG 1.34 area
dump from here till weekly FVG 1.34 area
if it breaks above PWH with good volume and closing at least on 4h then only longs

GBPUSD TRADE SETUPWait for retest the entry level then take a trade for Sell othewise skip this setup

GBPUSD: Bullish Continuation & Long Signal
GBPUSD
- Classic bullish setup
- Our team expects bullish continuation
SUGGESTED TRADE:
Swing Trade
Long GBPUSD
Entry Point - 1.3449
Stop Loss - 1.3413
Take Profit - 1.3520
Our Risk - 1%
Start protection of your profits from lower levels
Disclosure: I am part of Trade Nation's Influencer program and receive a monthly fee for using their TradingView charts in my analysis.
❤️ Please, support our work with like & comment! ❤️

GBP/USD H4 AnalysisPrice has broken below the daily trendline, where it found support on four separate occasions.
When retesting the trendline last week, price appeared to reject with 2 consecutive 4 hour bearish candles.
If you agree with this analysis then look for a sell setup that meets your strategy rules.

GBPUSDGBPUSD still needs some more correction before it goes to 1.365.
Disclosure: We are part of Trade Nation's Influencer program and receive a monthly fee for using their TradingView charts in our analysis.

GBPUSDDID YOU KNOW THAT YOUR COUNTRY CENTRAL BANKS HAVE ANOTHER
CENTRAL BANK AND IS CALLED BIS(BANK OF INTERNATIONAL SETTLEMENTS )???
The Bank for International Settlements (BIS) was established in 1930 at the Hague Conference, making it the world's oldest international financial institution. Its initial purpose was to facilitate the settlement of World War I reparations and to promote cooperation among central banks.
The BIS trading market refers to the role of the Bank for International Settlements (BIS) as a key intermediary and facilitator in global financial markets, particularly in foreign exchange (FX) and central bank transactions
BIS is a secretive institution with sovereign immunity that can move trillions without oversight. aka central bank of central banks in Basel Swissland with over 63 members in the world which are centrals banks of countries that make up 95% of world GDP.
Key Points about BIS and Its Trading Market Role:
Central Bank’s Central Bank: BIS acts as a bank for central banks and international organizations, providing banking services such as accounts, gold and currency transactions, asset management, and short-term collateralized loans.
Market Intermediary: BIS frequently conducts large-scale transactions on behalf of central banks in the foreign exchange and gold markets. These trades are often substantial, reflecting central banks’ reserve management or monetary policy operations.
Avoiding Market Misinterpretation: When BIS buys or sells currencies or assets, it is usually acting for a central bank, not itself, helping avoid markets mistaking these large trades for speculative or official government interventions.
Forum for Cooperation: BIS provides a platform for central banks to exchange information, coordinate policies, and cooperate on monetary and financial stability, which indirectly influences market dynamics.
Research and Statistics: BIS publishes data and analysis on global banking, FX, derivatives markets, and financial stability, supporting informed decision-making in the trading community.
Summary
The BIS trading market is not a public exchange but a specialized, high-level market where BIS facilitates and conducts financial transactions for central banks, particularly in foreign exchange and gold. Its activities help central banks manage reserves and implement monetary policy while fostering international financial cooperation.
if you know you know because BOE (BANK OF ENGLAND ) and FED (FEDERAL RESERVE ) are members .
GBPUSD 10 YEAR BOND YIELD ,INTEREST RATE ,INTEREST RATE DIFFERENTIAL AND CARRY TRADE ADVANTAGE .
1. Current Rates and Yields
Metric United Kingdom (GBP) United States (USD) Differential (UK - US)
10-Year Bond Yield 4.54% 4.38% +0.16% (16 bps)
Policy Interest Rate 4.25% 4.25%–4.50% -0.25% to -0.01%
UK Context: The Bank of England (BoE) held rates at 4.25% amid sticky inflation (3.4% YoY in May ) but signaled potential cuts in August.
US Context: The Federal Reserve held rates at 4.25%–4.50%, prioritizing inflation control despite slowing growth .
2. Interest Rate Differential and Carry Trade Advantage
Yield Spread: The UK 10-year gilt yields 0.16% more than the US 10-year Treasury, creating a modest yield pickup for GBP-denominated bonds .
Policy Rate Spread: The USD offers a 0.25% higher short-term rate (using the Fed’s 4.50% upper bound vs. BoE’s 4.25%) .
Carry Trade Mechanics:
GBP-USD Strategy: Borrow USD at 4.50% and invest in GBP assets at 4.54% (10-year gilt) for a net carry of +0.04%.
USD-GBP Strategy: Borrow GBP at 4.25% and invest in USD assets at 4.38% (10-year Treasury) for a net carry of +0.13%.
Key Risks:
Currency Volatility: GBP/USD at 1.34–1.35 could erase gains if the dollar strengthens.
Policy Shifts: BoE rate cuts (expected August 2025) may narrow the yield spread , while Fed cuts could reduce USD rate advantages .
3. Market Outlook
UK Focus: Inflation persistence may delay BoE cuts, supporting GBP yields near-term .
US Focus: Fed’s "higher for longer" stance and tariff-related inflation risks could sustain USD yield appeal .
Carry Viability: The USD-GBP strategy offers a slight edge (0.13% carry) but requires hedging against GBP appreciation risks.
Summary
Yield Advantage: UK 10-year gilts yield 0.16% more than US Treasuries, but USD short-term rates are 0.25% higher.
Optimal Carry: Borrowing GBP to invest in USD assets (0.13% carry) is marginally favorable, though policy uncertainty warrants caution.
Critical Factors: Monitor BoE/Fed rate decisions and GBP/USD trends for carry trade adjustments.

Trade Idea: Buy GBP/USD (Short-Term Opportunity)### **📈 Trade Idea: Buy GBP/USD (Short-Term Opportunity)**
**Bias:** 🔼 Bullish
**Timeframe:** 🕒 Short-Term (few days to a couple of weeks)
---
### **💡 Why Buy GBP/USD?**
**🇺🇸 USD – U.S. Dollar:**
* **Real yields dropping, Fed turning cautious**
→ *📉 Less return = less demand for USD. Dovish Fed tone opens the door for weakness.*
* **Fund managers are heavily short USD**
→ *📊 Big bearish positioning = market already leaning against the dollar.*
* **Inflation sticky, but no urgency to hike**
→ *🔥 Keeps Fed cautious, not aggressive — supports slow USD drift lower.*
* **Limited safe-haven demand despite global tensions**
→ *🕊️ Markets are no longer rushing to the dollar during global stress — a shift in behavior.*
* **Sentiment: Bearish**
→ *📉 USD remains under pressure unless inflation re-surges or Fed surprises hawkishly.*
---
**🇬🇧 GBP – British Pound:**
* **Yes, UK data is soft — but so is the USD**
→ *⚖️ It’s a relative game. GBP has room to bounce if risk sentiment holds.*
* **BoE expected to cut in August — but no panic**
→ *🏦 The easing path is gradual. GBP isn’t collapsing — markets had time to price this in.*
* **GBP oversold and holding 1.2660 support**
→ *🛑 Price structure suggests buyers are defending key levels.*
* **Weak USD = GBP breathing room**
→ *💨 Even a soft pound can float when the dollar is sinking.*
* **Sentiment: Mildly bearish, but stabilizing**
→ *📈 GBP might not be strong — but it’s showing signs of bottoming.*
---
### **🔍 Outlook:**
**This is a dollar-weakness play more than a pound-strength one.**
If GBP/USD holds above 1.2660, there’s room to ride a slow grind toward 1.2800+. Risk is limited unless July CPI surprises hawkishly or BoE turns dramatically dovish.
---

GBPUSD Changing from bullish to bearish market We had a clear break of structure on the support and currently had a retest on our 0.5 and 0.6 zone, market is ready to go bearish.

GBPUSD Trend UpdateWeekly time frame showed a bearish engulfing candle, creating double top formation, and at the daily timeframe, it broke the trend line of the ascending wedge, creating long big engulfing bearish candlestick, showing a strong bearish momentum.
We can see a Doji candle as a rejection for the AOI @1.3460, so there is a big probability that the trend will continue its downward momentum toward the next support area @ 1.3260 AOI.
Let's keep an eye on the chart at the opening of the market and look for a sell.
Good Luck!

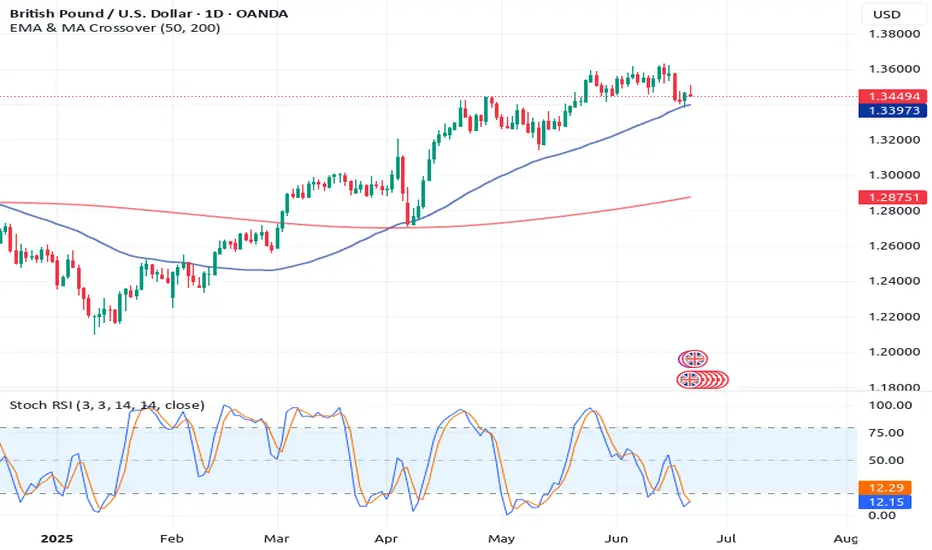
GBP/USD Potential Bullish ReversalGBP/USD Potential Bullish Reversal 📈🦾
📊 Technical Analysis Overview:
The chart showcases a well-defined horizontal range between the support (~1.31900) and resistance (~1.36200) zones. The price action has respected these levels multiple times, forming a clear accumulation zone at the bottom and rejection at the top.
🔄 Pattern Formation:
A Rounded Bottom (Cup) structure is visible forming from the June low.
The price made a bullish bounce near the key support level at 1.33930, marked by an orange circle, suggesting a potential higher low formation.
The blue downtrend line from the recent high (red arrow) has been broken, indicating a trend reversal attempt.
📍 Current Price: 1.34494
🎯 Target Zone: 1.35734
🛑 Support to Watch: 1.33930
📈 Bullish Confirmation:
A break above the minor neckline (around current price) would confirm a cup & handle breakout with a projected target of 1.35734.
Strong buying pressure and higher lows are reinforcing bullish strength.
⚠️ Risk Management Tip:
A breakdown below 1.33930 would invalidate the bullish setup and could retest the major support zone (~1.31900).
✅ Bias: Bullish, unless price closes below 1.33930
🕒 Outlook: Short- to Mid-term Upside Potential

The Top 3 Indicators to Use In Forex TradingAnother bull market is on the way,so this had to lead
to some war, and crazy stuff on going.
The forex market is a very important metric to watch.
-
To be honest with you i dont trade forex pairs anymore
but its important to watch this market to understand global
economics and the banking systems.
-
So if you ever trade forex dont use more than 2x Margin.
the average return on forex pairs is about
20% per year.
-
Will i ever go back to trading forex?
-
probably not.Right now am in Bitcoin. Eventhough
i will keep giving updates on forex pairs.
Because Forex trading is what inspired me to
learn how to trade in the beginning.
Its the same chart pattern but this time
we are focussed on the weekly time frame.
Because i dont have a paid membership
to tradingview i am only able to share with you
weekly trades and not day trade.
These posts are not day trading strategies.
Instead they are weekly trading strategies
thats the reason why you should not
use margin.Because weekly trades are more
volatile.
This forex pair is the best in the forex market
in terms of performance.So unless you trading this
forex pair OANDA:GBPUSD
Your returns wont be huge without margin.
But from a long term mindset, you should
expect 20% annual return.
On this chart we used:
-Stochastic RSI
-The 50 EMA
-The 200 EMA
Interpreting these indicators does take time to understand
them.Its very important that you understand them
very well.
Rocket boost This content to learn more.
Disclaimer:Trading is risky please use a simulation trading account
before you trade with real money.Also learn risk
management and profit taking
strategies first.Do not use margin.
GBPUSD MULTI TIME FRAME ANALYSIS Hello traders , here is the full multi time frame analysis for this pair, let me know in the comment section below if you have any questions , the entry will be taken only if all rules of the strategies will be satisfied. wait for more price action to develop before taking any position. I suggest you keep this pair on your watchlist and see if the rules of your strategy are satisfied.
🧠💡 Share your unique analysis, thoughts, and ideas in the comments section below. I'm excited to hear your perspective on this pair .
💭🔍 Don't hesitate to comment if you have any questions or queries regarding this analysis.

GBP/USD Trade idea for the week. Price seems bullish, but it has to retest the previous low and then continue above. To continue the trend. if it breaks below and does not show a bullish engulfing candle, then this trade idea is null.

GU Sell IdeasWe're still down trending on GU we created a LL & we're no creating a LH. We also double engulfing candles printing on the 1 hr. All we need is a break of the counter trend line to confirm this idea.