GBPUSD-4H BUYUptrend in the weekly , break resistant with strong momentum Candle. Divergency is showing and It test the Support and now ready to go up with the main trend.
GBPUSD trade ideas

SHORT GBPUSDshorting gbpusd after the short term long into the higher tf poi and waiting for confirmation to short

GBP/USD 4-hour timeframe with a clear bearish trend currently in📍 Key Levels Noted
Resistance Zone: Around 1.35895 – 1.36053
Fair Value Gap Fill Zone: 1.35304 – 1.35575
Demand Area: 1.34928 – 1.35003
Major trendline break would invalidate the bearish structure.

09.07.25 Morning ForecastPairs on Watch -
FX:GBPUSD
FX:EURAUD
OANDA:JP225USD
FX:USDCAD
A short overview of the instruments I am looking at for today, multi-timeframe analysis down to what I will be looking at for an entry. Enjoy!

Potential Long Setting Up on GBP 4HLong term uptrend. Strong chart.
Need to see short term trend turn around. Close needs to hold.
Entry with 1:1.75 profit and 120 point stop.
Let's see how it plays out.

GBPUSD - Is it Ready? Looking at GBPUSD
We have had a Market shift to the upside from a HTF Point of Interest. I am now waiting for price to come back into a 15min demand area and hopefully price will take off to the upside from here.
We have also swept liquidity before a drastic move to the upside.
Lets see how this one plays out
GBPUSD BUY TRADEBuy Opportunity on GBPUSD
ENTRY: 1.35900
STOPLOSS: 1.35600
TAKEPROFIT: 1.37000
OUR FUND MANAGEMENT SYSTEM
We only manage (trade) clients fund. It's the responsibility of clients to deposit into their trading account with their preferred broker.
Your Minimum capital must be $100
COMMENT YOUR OPINION
Contact me on X @shajudeakinoba1

GBPUSD BUY IDEAI am anticiting for a stronger bullish move after a break in the trendline+c change in market structure.
On the financial standpoint,Dxy might start dipping as a result of the fed decision to cut rate plus Trump rift with Fed chair,Jerome Powell.
This is not a financial advise

DeGRAM | GBPUSD broke down the channel📊 Technical Analysis
● Cable’s bounce stalled at the channel base (≈1.3500); price is now carving a bear flag beneath that rail and the prior wedge-break line, signalling failure to regain trend support.
● A 4 h close under 1.3415 confirms channel loss, opening the mid-May pivot 1.3271; flag top at 1.3470 caps risk while lower-high sequence stays intact.
💡 Fundamental Analysis
● Friday’s firm US consumer-sentiment and Fed Gov. Waller’s “no urgency to cut” comments nudged 2-yr yields back toward 4.80 %, reviving dollar demand.
● UK June payrolls contracted for a third month and wage growth cooled, boosting August BoE-cut odds and weighing on sterling.
✨ Summary
Sell 1.3460-1.3490; sustained trade below 1.3415 targets 1.3271. Short view void on a 4 h close above 1.3470.
-------------------
Share your opinion in the comments and support the idea with a like. Thanks for your support!

GBP/USD Bears Charge Yearly Trend Support- US / UK CPI on TapSterling broke below confluent support last week at the 61.8% retracement at of the June rally at 1.3530. The decline is now within striking distance of yearly trend support at 1.3388-1.3415- a region define by the 61.8% retracement of the May rally, the June close lows, and the 2024 high-day close. A good zone to reduce portions of short-exposure / lower protective stops IF reached. A break / close below would be needed to suggest a more significant high was registered this month / a larger reversal is underway.
Initial resistance now back at 1.3530 with a close above the 25% parallel needed to threaten resumption of the broader uptrend. Keep in mind we get the release of US / UK inflation data this week- stay nimble into the releases and watch the weekly close for guidance here.
-MB

GBPUSDGBPUSD is close to giving us a good upward reaction, wait for an impulse for upside soon before you look for buys.
Disclosure: We are part of Trade Nation's Influencer program and receive a monthly fee for using their TradingView charts in our analysis.

Sell gbpusdStrongly respecting our 1st selling area daily Strong buy trend breaks
Still monthly overbought pair
More selling expected till our weekly target

GBP USD shortIf the trend is bearish, who am I to go against it?
Fun fact: the moment I'm sure about something is usually the moment I make a mistake.
By the way, I’m finding this setup interesting. These analyses aren’t based on a well-defined strategy — they’re experimental. Years of failing and testing have only taught me 87 ways that don’t work, not one that definitely does.
Lately, I’m trying something I call the "bombard strategy." If you feel strongly about a trade, you just go for it. Sometimes you might even have both short and long positions open on the same pair at the same time. The only real trick is to make sure your take-profit (TP) is at least twice as big as your stop-loss (SL).
News events are so unpredictable. Most of the time, you won’t even reach your TP — you’ll have to manually close the trade early, or you risk losing your gains. It’s like a mathematical game.
In this chaotic market, to master it, you have to master chaos.
How? I don’t know yet. I’m just going with my gut feeling… backed by five years of experience watching the charts.
Please note: This is for educational purposes only and not a trading signal. These ideas are shared purely for back testing and to exchange views. The goal is to inspire ideas and encourage discussion. If you notice anything wrong, feel free to share your thoughts. In the end, to learn is to share !

GBP/USD CONFIRM ANALYSISGBP/USD picks up pace and advances to daily peaks in the 1.3470 zone on the back of the increasing downward pressure on the US Dollar after President Trump asked politicians if he can fire Fed Chief Powell.

GBPUSD(20250714)Today's AnalysisMarket news:
① Fed's Goolsbee: The latest tariff threat may delay rate cuts. ② The Fed responded to the White House's "accusations": The increase in building renovation costs partly reflects unforeseen construction conditions. ③ "Fed's megaphone": The dispute over building renovations has challenged the Fed's independence again, and it is expected that no rate cuts will be made this month. ④ Hassett: Whether Trump fires Powell or not, the Fed's answer to the headquarters renovation is the key.
Technical analysis:
Today's buying and selling boundaries:
1.3518
Support and resistance levels:
1.3621
1.3583
1.3558
1.3479
1.3454
1.3415
Trading strategy:
If the price breaks through 1.3518, consider buying in, with the first target price at 1.3558
If the price breaks through 1.3479, consider selling in, with the first target price at 1.3454

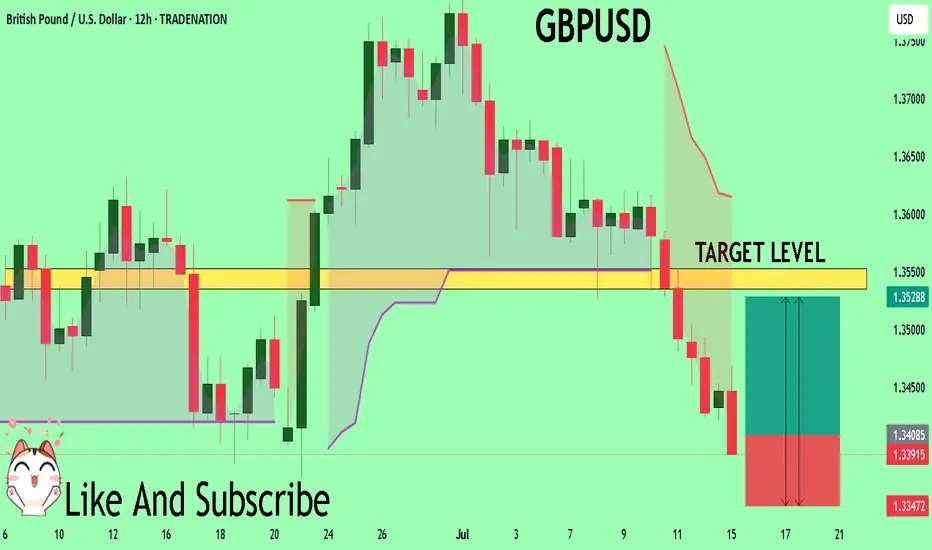
GBP/USD - Bearish Channel (07.07.2025)The GBP/USD Pair on the M30 timeframe presents a Potential Selling Opportunity due to a recent Formation of a Bearish Channel Pattern. This suggests a shift in momentum towards the downside in the coming hours.
Possible Short Trade:
Entry: Consider Entering A Short Position around Trendline Of The Pattern.
Target Levels:
1st Support – 1.3545
2nd Support – 1.3485
🎁 Please hit the like button and
🎁 Leave a comment to support for My Post !
Your likes and comments are incredibly motivating and will encourage me to share more analysis with you.
Best Regards, KABHI_TA_TRADING
Thank you.
Disclosure: I am part of Trade Nation's Influencer program and receive a monthly fee for using their TradingView charts in my analysis.

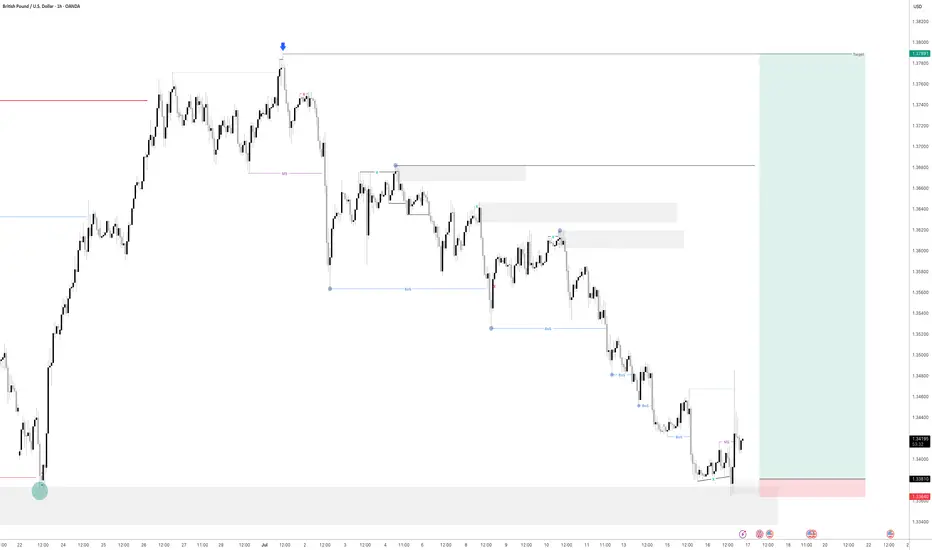
GBP/USD Outlook: Can Buyers Step Back In?Hi everyone,
GBP/USD continues to consolidate below the 1.36200 level, with multiple failed attempts to break higher confirming this area as firm resistance for now. Following the rejection, price moved lower into the 1.35300–1.34600 demand zone, where we’re watching closely for signs of renewed buying interest.
This area has previously acted as a support base, and a reaction here could set the stage for another push higher. However, if buyers fail to step in, there is scope for a deeper retracement before the next attempt to reclaim resistance. We’ll be monitoring the price action closely to see which scenario plays out.
A drop into this area was highlighted as the more probable short‑term path, and we’re now looking for GBP/USD to find support in this region; and more importantly, to hold above the 1.33800 level to form the base for another push higher.
As previously noted, a decisive break above 1.37500 would renew our expectation for further upside, with the next key target around 1.38400. We'll be monitoring price action closely to see how it unfolds.
We’ll continue to provide updates on the projected path for GBP/USD as price approaches this target.
The longer-term outlook remains bullish, and we expect the rally to continue extending further from the 1.20991 January low towards 1.40000 and 1.417000.
We’ll be keeping you updated throughout the week with how we’re managing our active ideas. Thanks again for all the likes/boosts, comments and follows — we appreciate the support!
All the best for the week ahead. Trade safe.
BluetonaFX

Cable H4 | Pullback at 61.8% Fibonacci retracementCable (GBP/USD) is falling towards a pullback support and could potentially bounce off this level to climb higher.
Buy entry is at 1.3533 which is a pullback support that aligns with the 61.8% Fibonacci retracement.
Stop loss is at 1.3490 which is a level that lies underneath a pullback support.
Take profit is at 1.3612 which is a swing-high resistance that aligns closely with the 38.2% Fibonacci retracement.
High Risk Investment Warning
Trading Forex/CFDs on margin carries a high level of risk and may not be suitable for all investors. Leverage can work against you.
Stratos Markets Limited (tradu.com ):
CFDs are complex instruments and come with a high risk of losing money rapidly due to leverage. 63% of retail investor accounts lose money when trading CFDs with this provider. You should consider whether you understand how CFDs work and whether you can afford to take the high risk of losing your money.
Stratos Europe Ltd (tradu.com ):
CFDs are complex instruments and come with a high risk of losing money rapidly due to leverage. 63% of retail investor accounts lose money when trading CFDs with this provider. You should consider whether you understand how CFDs work and whether you can afford to take the high risk of losing your money.
Stratos Global LLC (tradu.com ):
Losses can exceed deposits.
Please be advised that the information presented on TradingView is provided to Tradu (‘Company’, ‘we’) by a third-party provider (‘TFA Global Pte Ltd’). Please be reminded that you are solely responsible for the trading decisions on your account. There is a very high degree of risk involved in trading. Any information and/or content is intended entirely for research, educational and informational purposes only and does not constitute investment or consultation advice or investment strategy. The information is not tailored to the investment needs of any specific person and therefore does not involve a consideration of any of the investment objectives, financial situation or needs of any viewer that may receive it. Kindly also note that past performance is not a reliable indicator of future results. Actual results may differ materially from those anticipated in forward-looking or past performance statements. We assume no liability as to the accuracy or completeness of any of the information and/or content provided herein and the Company cannot be held responsible for any omission, mistake nor for any loss or damage including without limitation to any loss of profit which may arise from reliance on any information supplied by TFA Global Pte Ltd.
The speaker(s) is neither an employee, agent nor representative of Tradu and is therefore acting independently. The opinions given are their own, constitute general market commentary, and do not constitute the opinion or advice of Tradu or any form of personal or investment advice. Tradu neither endorses nor guarantees offerings of third-party speakers, nor is Tradu responsible for the content, veracity or opinions of third-party speakers, presenters or participants.

GBPUSD Possible buy moveWeekly break of structure, signifying a possible bullish trend. Price formed a demand zone on the weekly, also signifying a strong bullish trend. Price retracing to the 4hr demand zone for possible entry for a buy.
Note: Risk Management Very Important.
#GBPUSD: A strong bullish move incoming, comment your views The price has shown a possible price divergence, which could lead to a long-term move to 1.37. We expect the US dollar to weaken, which will likely push the price of GBPUSD to our target. Key economic data will be released later today and tomorrow, which could shape the price pattern.
Good luck and trade safely!
Team Setupsfx_

GBPUSD - Also continued downside continuationLooking at GU. This is a little bit ahead of its time in comparison to EU.
And what i mean by that is EU is a lot further away from its 4H demand zone compared to GBP so it will be super interesting to see how we react at the level we are fast approaching on GU.
I am in a short position as of Friday. I will be posting a video tomorrow showing exactly how and why i got short on GU so stay tuned for that one.
As always if there is anything else i can be of assistance with give me a message and i will be happy to answer any questions you may have

GBPUSD Will Explode! BUY!
My dear friends,
My technical analysis for GBPUSD is below:
The market is trading on 1.3409 pivot level.
Bias - Bullish
Technical Indicators: Both Super Trend & Pivot HL indicate a highly probable Bullish continuation.
Target - 1.3535
Recommended Stop Loss - 1.3347
About Used Indicators:
A pivot point is a technical analysis indicator, or calculations, used to determine the overall trend of the market over different time frames.
Disclosure: I am part of Trade Nation's Influencer program and receive a monthly fee for using their TradingView charts in my analysis.
———————————
WISH YOU ALL LUCK
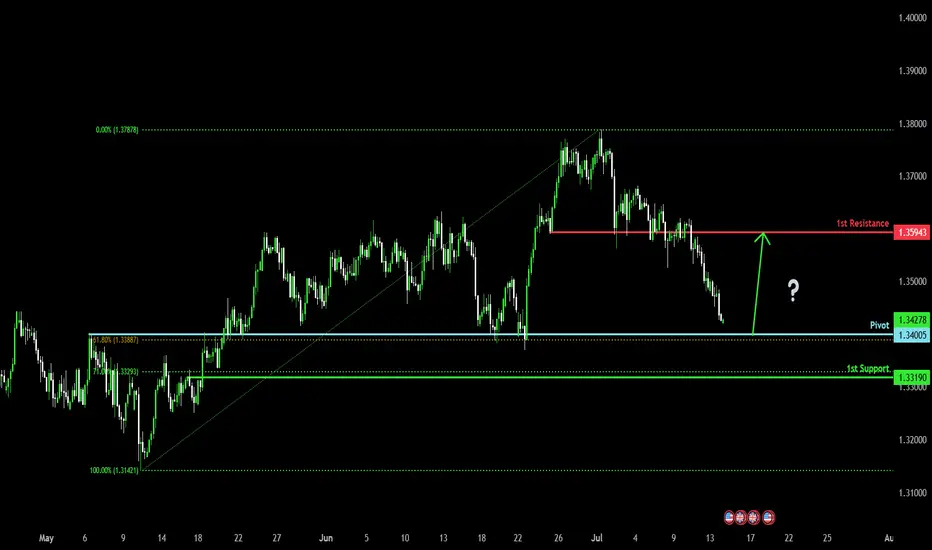
Falling towards major support?The Cable (GBP/USD) is falling towards the pivot which has been identified as an overlap support that lines up with the 61.8% Fibonacci retracement and could reverse to the 1st resistance.
Pivot: 1.3400
1st Support: 1.3319
1st Resistance: 1.3594
Risk Warning:
Trading Forex and CFDs carries a high level of risk to your capital and you should only trade with money you can afford to lose. Trading Forex and CFDs may not be suitable for all investors, so please ensure that you fully understand the risks involved and seek independent advice if necessary.
Disclaimer:
The above opinions given constitute general market commentary, and do not constitute the opinion or advice of IC Markets or any form of personal or investment advice.
Any opinions, news, research, analyses, prices, other information, or links to third-party sites contained on this website are provided on an "as-is" basis, are intended only to be informative, is not an advice nor a recommendation, nor research, or a record of our trading prices, or an offer of, or solicitation for a transaction in any financial instrument and thus should not be treated as such. The information provided does not involve any specific investment objectives, financial situation and needs of any specific person who may receive it. Please be aware, that past performance is not a reliable indicator of future performance and/or results. Past Performance or Forward-looking scenarios based upon the reasonable beliefs of the third-party provider are not a guarantee of future performance. Actual results may differ materially from those anticipated in forward-looking or past performance statements. IC Markets makes no representation or warranty and assumes no liability as to the accuracy or completeness of the information provided, nor any loss arising from any investment based on a recommendation, forecast or any information supplied by any third-party.