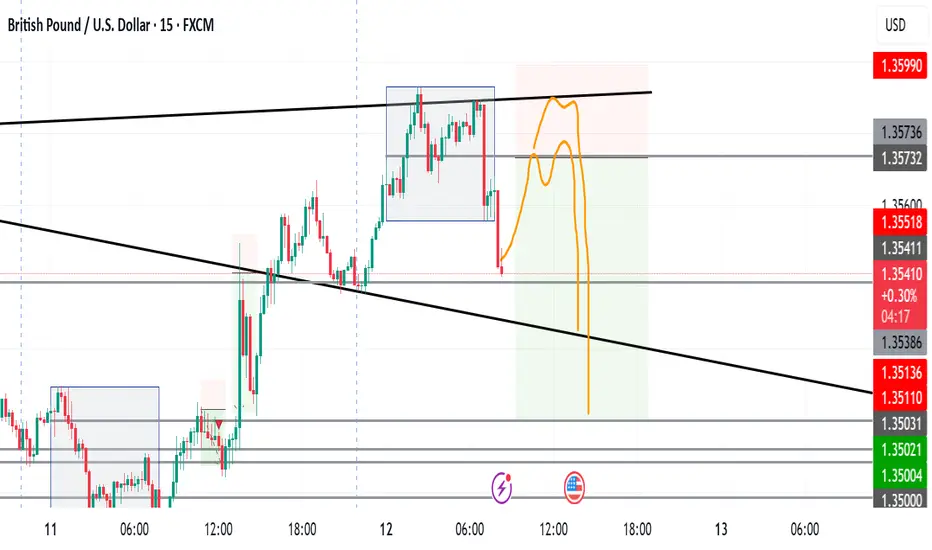
London Take 1 - GBPUSD - 12/6/2025SO this is what I see and anticipating ...more updates will follow.
PINK ZONE initially is ENTRY/KILL ZONE not entry and stoploss, screenshots after I am in the trade will update to atual short position with EP, SL & TP and my notes will elaborate.
News later at NY ...will be staying safe but looking to catch some pips
GBPUSD trade ideas
GBP/USD Sell OpportunityHi Traders.
We see we reached the Top of the HTF Structure and formed a Duuble Top and M Style Pattern
The Right Part of the Double Top
is also a LTF HnS Pattern.
We breakout from this structure and now forming some Bearish correction.

CHECK GBPUSD SIGNAL READ CAPTAINgbpusd sell now ✅
entry point (1.35900) (1.35850)
TAKE PROFIT 1: (1.35700)
TAKE PROFIT 2: (1.35450)
LAST TARGET (1.35200)
STOP LOSS (1.36150)

GBPUSD TECH.Hello everyone.
First of all, in this week, I feel so bearish :D
The market may seem very soon so bearish, if after we will have some downfall very soon...
I hope we will get in some profit situation, if the price will enter this "white break lined colored" channel... Because after that, the price may move many times there in that channel...
So, what we can wait in this situation is when the price will go down and starts making some sideways trend and will get horizontal trend...
Thank you!
Have a Profitable Day! ^^

GBPUSDfsten your setbelt for weken gbp nd stronger usd the mrket got mnipulted for tking buy stop for mking more selling


GBPUSD is rising towards the resistance zone of 1.35600GBPUSD is heading towards 1.35600. If the gold price closes around this area, it confirms that the buyers have entered the market. You can set up a BUY signal now with SL placed below the candle wick. After touching 1.356, we can wait for the price reaction and set up a SELL signal again following the sideways border.
Do you agree with our view of buying 1.34900 and SL 1.34600?
Leave a comment

GBPUSD Bullish Flag breakout supported at 1.3500The GBP/USD currency pair maintains a bullish sentiment, supported by a rising trendline and sustained higher lows. The recent intraday price action suggests a corrective pullback within an overall uptrend, indicative of a consolidation phase rather than a reversal.
Key Support Level: 1.3500
This level aligns with a previous consolidation zone and is acting as a pivotal support. A pullback toward this level could offer a potential buying opportunity, especially if bullish momentum returns.
Upside Targets (on bullish continuation from 1.3500):
1.3610 – Initial resistance from prior swing high
1.3650 – Intermediate resistance level
1.3700 – Long-term target and potential top of the current bullish channel
Bearish Scenario (if 1.3500 fails):
A daily close below 1.3500 would invalidate the current bullish setup, signaling a potential shift in trend. In that case:
Immediate support at 1.3480
Deeper retracement could extend to 1.3450
Conclusion
The broader trend in GBP/USD remains bullish, with the current consolidation viewed as a potential pullback rather than a reversal. The 1.3500 level is critical — a bounce from here could resume the uptrend toward 1.3610 over time. However, a break and close below 1.3500 would weaken the bullish case and open the door to further downside. Traders should monitor price action closely around this key level for confirmation.
This communication is for informational purposes only and should not be viewed as any form of recommendation as to a particular course of action or as investment advice. It is not intended as an offer or solicitation for the purchase or sale of any financial instrument or as an official confirmation of any transaction. Opinions, estimates and assumptions expressed herein are made as of the date of this communication and are subject to change without notice. This communication has been prepared based upon information, including market prices, data and other information, believed to be reliable; however, Trade Nation does not warrant its completeness or accuracy. All market prices and market data contained in or attached to this communication are indicative and subject to change without notice.

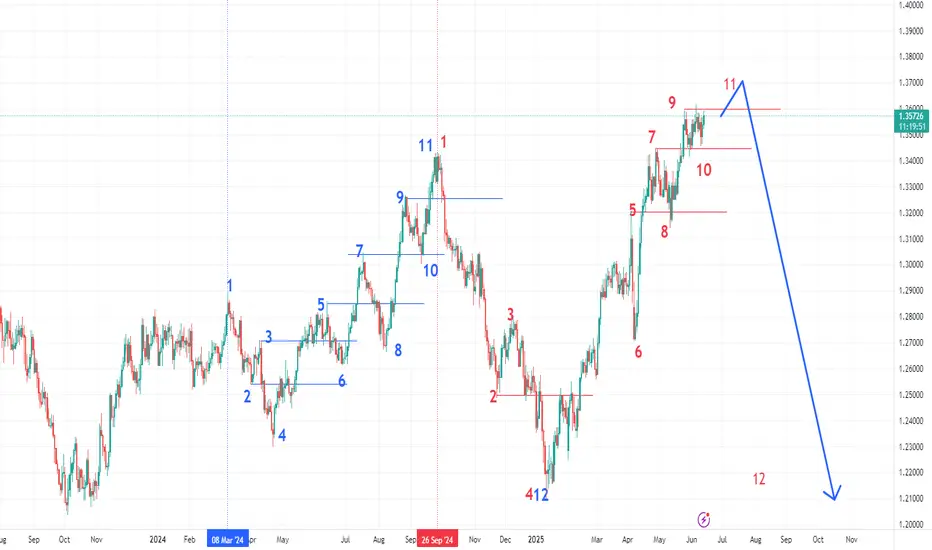
GBPUSD Daily Sequence Start march 2024 prince movement repeat in Sep 2024 on similar way
highs and lows are the same so we expect up to 11 point then drop to near point 4 (last TP) as what happened before.
IF crossed level of point 7 this conformation for dropdown start
what do you think ?
The Day AheadU.S. Events
May PPI (Inflation):
Big market mover. If it’s hot, expect higher yields and stronger USD.
If it cools, stocks and bonds may rally.
Jobless Claims:
Signals labor market strength.
A jump could raise recession fears.
Q1 Household Net Worth:
Minor impact, but relevant for consumer spending outlook.
UK Data
April GDP:
Big for GBP. A weak print could hurt the currency.
RICS House Prices:
Moderate impact; shows housing trends.
Europe
Germany Current Account + Italy Unemployment:
Lower market impact. May affect eurozone sentiment slightly.
Central Banks
Multiple ECB Speakers:
Watch for hints on rate cuts or QT.
Could move the euro and EU bonds if guidance shifts.
Earnings
Adobe (after market close):
Important for tech stocks and Nasdaq.
Watch AI commentary and guidance.
US 30-Year Bond Auction
Big for bond yields.
Weak demand = yields rise → pressure on stocks
Strong demand = yields fall → support for risk assets
This communication is for informational purposes only and should not be viewed as any form of recommendation as to a particular course of action or as investment advice. It is not intended as an offer or solicitation for the purchase or sale of any financial instrument or as an official confirmation of any transaction. Opinions, estimates and assumptions expressed herein are made as of the date of this communication and are subject to change without notice. This communication has been prepared based upon information, including market prices, data and other information, believed to be reliable; however, Trade Nation does not warrant its completeness or accuracy. All market prices and market data contained in or attached to this communication are indicative and subject to change without notice.

GBPUSDSell. Market Execution. trade 1:2. risk 0.50%
We entered Sell because the market is respecting the sellers' zone.

GBPUSDFVG trde of GBPUSD ccording to ICT concept sell side its probbly reversl fter some discount but isell high recomend

GBPUSD - Long after a structural shiftBased off of yesterdays analysis.
We can see we are fast approaching a very nice POI.
Will post below my mark up chart from yesterday so you can see below. Will now be sending most of my day on the 15min TF waiting for our structural shift to the upside.
Let's see how price plays out today.
Don't just dive into the trade. Wait for your structural shift first.
If I can offer any help please do let me know

GU STILL BULLISH OVERALLGU still bullish still bullish overall but i will wait for bullish close above the Fib to look for new bullish entry

LONDON BREAKOUTGBP/USD London Breakout Strategy
Entry (Breakout Hit Price): 1.35646
Take Profit: 1.35262
Stop Loss: 1.35900
This trade was taken based on my London Session Breakout Strategy.
The setup follows a structured approach:
– Identified the Asian session range
– Price consolidated during the pre-London hours
– Breakout occurred at 1.35646, confirming momentum on the downside
Risk-Reward Ratio is favorable, and the stop is placed just above the upper boundary of the Asian range to protect against false breakouts.

GBP/USD Technical Analysis – Bearish Setup Developing!GBP/USD Technical Analysis – Bearish Setup Developing! 🔻
Chart Breakdown (H4):
📌 Resistance Zone (🔴 1.35800 – 1.36000):
The pair has been rejected multiple times from this strong resistance area, marked by multiple upper wicks and bearish pressure. Most recent price action shows another rejection, forming a lower high.
📌 Support Level (🟣 1.34732):
This key horizontal level has acted as a strong support multiple times (highlighted with 🟠 circles), suggesting bulls are attempting to defend this zone.
📉 Bearish Structure Formation:
Price recently tested resistance again and was rejected sharply.
A potential double-top or lower high structure is forming.
A break and close below the 1.34732 support will likely confirm bearish momentum.
📍 Next Target (🔻):
If support breaks, price may fall towards the support demand zone around 1.34150 – 1.34300, aligning with the marked red support box.
📈 Invalidation Point:
A clean breakout and hold above 1.36000 would invalidate this bearish bias and potentially signal continuation higher.
⚠️ Summary:
🔼 Resistance Rejection at 1.36000
🔽 Watching for break below 1.34732
🎯 Bearish target: 1.34300 zone
🔄 Invalidation: Break above 1.36000
Bias: 📉 Bearish Below 1.34732

POST NEWS (GBP)GBP/USD Post-News Trade
Entry: 1.35605
Take Profit: 1.35343
Stop Loss: 1.35736
Trading a post-news setup following a surprise deviation in the GBP-related high-impact news release.
Price action showed a strong to medium reaction, and after the initial volatility settled, I entered short based on my post-news strategy.
The setup aligns with my rules:
– Waited for 15 min candle stabilization
Risk-reward ratio is favorable, and the stop is placed just above the reaction high to minimize exposure.

GU-Thu-12/06/25 TDA-Higher US CPI, why GU pumped? explained!Analysis done directly on the chart
Follow for more, possible live trades update!
Here's the tricky part of CPI, this year 2.4% higher
than last year 2.3% but GU still pumped, why?
Because consensus was 2.5% and since it released
2.4% which is lower than consensus, bad for dollar
thus GU pumping.
Active in London session!
Not financial advice, DYOR.
Market Flow Strategy
Mister Y

GBPUSD looks ready for its next up-legGBPUSD broke above key levels, triggering a double top pattern with targets near 1.4778. In this video, we discuss risk-reward adjustments, why reducing your stop makes sense, and how to deal with sideways markets and small triangle setups. Learn why taking smaller profits can sometimes lead to better long-term results. Leave your thoughts in the comments.
This content is not directed to residents of the EU or UK. Any opinions, news, research, analyses, prices or other information contained on this website is provided as general market commentary and does not constitute investment advice. ThinkMarkets will not accept liability for any loss or damage including, without limitation, to any loss of profit which may arise directly or indirectly from use of or reliance on such information.


GBPUSD SHORT FORECAST Q2 W24 D12 Y25GBPUSD SHORT FORECAST Q2 W24 D12 Y25
Professional Risk Managers👋
Welcome back to another FRGNT chart update📈
Diving into some Forex setups using predominantly higher time frame order blocks alongside confirmation breaks of structure.
Let’s see what price action is telling us today!
💡Here are some trade confluences📝
✅Weekly order block
✅15' order block
✅Intraday 15' break of structure
✅Tokyo ranges to be filled
🔑 Remember, to participate in trading comes always with a degree of risk, therefore as professional risk managers it remains vital that we stick to our risk management plan as well as our trading strategies.
📈The rest, we leave to the balance of probabilities.
💡Fail to plan. Plan to fail.
🏆It has always been that simple.
❤️Good luck with your trading journey, I shall see you at the very top.
🎯Trade consistent, FRGNT X

GBPUSD InsightHello to all our subscribers,
We’re glad to have you here. Please feel free to share your personal opinions in the comments. Don’t forget to hit the booster and subscribe!
Key Points
- The U.S. and China have reportedly reached a principled agreement on a framework to implement the Geneva Accord. President Trump announced that "all necessary rare earth elements will be supplied by China in a 'prepaid' format," effectively lifting export controls.
- The U.S. Consumer Price Index (CPI) for May rose by 2.4% year-over-year, falling short of the market forecast of 2.5%. The core CPI also increased by 2.8%, below the expected 2.9%.
- The U.K. announced results of its spending review, indicating a 2.3% increase in total government budget. Fiscal concerns triggered a spike in the 10-year gilt yield, which briefly rose to 4.6190%.
Major Economic Events This Week
+ June 12: U.K. April GDP, U.S. May Producer Price Index (PPI)
+ June 13: Germany May Consumer Price Index (CPI)
GBPUSD Chart Analysis
The pair has continued its upward momentum supported by a trendline, but it's currently pausing near the 1.36000 level. There’s still potential for a breakout above this resistance, so further observation is needed to determine the direction. If it breaks above the recent high, a mid- to long-term rise toward the 1.40000 level is possible. Conversely, failure to break resistance could lead to a decline toward the 1.32000 level.
