GBPUSD - LONG Looking at GBPUSD
We have a great set up occurring on the 5min timeframe for a potential long.
We will see how it plays out and will do an update video on this later.
GBPUSD trade ideas

Here’s detailed breakdown for GBPUSD (1H chart)🏦 GBPUSD Analysis – June 17, 2025 | 1H Chart
🔻 Market Structure Overview
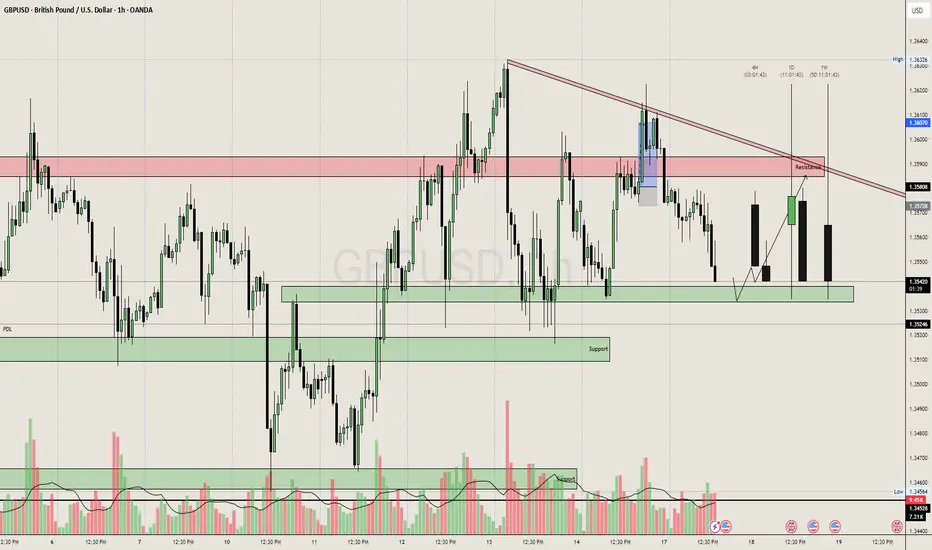
Currently ranging between 1.3524 support and 1.3607 resistance.
Price is inside a descending triangle – bearish structure.
Clean rejections from descending trendline; each retest brings in lower highs.
🔍 Key Zones
🔴 Resistance (1.3580–1.3610)
Multiple rejections + prior breaker block.
Last rally into this zone (highlighted in blue) was immediately sold off → liquidity grab.
Trendline confluence above it adds extra weight.
🟢 Support (1.3524–1.3544)
Price has bounced here 3 times → forming short-term demand.
However, each bounce is losing momentum – classic absorption sign.
🧠 Institutional Clues
Volume Spikes on down moves = sellers active at highs.
Up candles = low volume, weak buyer intent.
That wick fake-out at 1.3580 → clear stop hunt.
📉 Sell-Side Setup (Bias: Bearish)
Entry Concepts:
Sell on retest of broken structure near 1.3578–1.3590.
OR Breakdown play below 1.3524, wait for candle close & retest.
🎯 Targets:
TP1: 1.3500 psychological + low volume node
TP2: 1.3465 (marked previous low)
TP3: 1.3420–1.3400 (daily imbalance fill area)
🛑 Invalidation:
Break & hold above 1.3610, invalidates the triangle and flips to bullish breakout.
💡 Trade Idea Example:
Sell Limit @ 1.3580
SL: 1.3615
TP1: 1.3500
TP2: 1.3465
RR: ~1:3+
🔮 Final Thoughts:
GBPUSD is coiling inside a tightening structure; a breakdown is more likely due to bearish pressure, trendline resistance, and repeated absorption of buyers.
Watch DXY strength too — any bullish push on USD can trigger a clean flush.
GBP/USD Bearish Rejection at Resistance Zone – Downside Targets GBP/USD Bearish Rejection at Resistance Zone – Downside Targets Ahead 🚨
This chart analysis of GBP/USD reveals a clear bearish structure unfolding after the pair tested a strong resistance zone near the 1.36000 level. Here's the professional breakdown:
🔴 Key Resistance Zone: 1.36000 – 1.36200
Price has been rejected multiple times from this upper zone (marked in red).
Repeated upper wicks and lower closes signal selling pressure.
Recent candle formations suggest a potential reversal from this level.
🟢 Major Support Zones:
1.33090 (Mid-Level Support)
This level has acted as a reaction zone in the past.
Could provide temporary consolidation or bounce.
1.31500 – 1.32000
Strong historical support, price bounced here previously.
Bears might slow down in this area before continuation.
1.28000 – 1.29000
Deeper support zone; if broken, could indicate a major trend shift.
📉 Bearish Projection
Price is expected to descend toward 1.33090, and if momentum continues, potentially down to the 1.28 region.
The zigzag projection in the black box reflects a stair-step pattern typical of strong bearish legs.
🧠 Market Psychology & Price Action
Sellers are defending the resistance aggressively.
Lower highs and consistent rejection candles imply weakening bullish momentum.
This setup aligns with a distribution phase before a drop.
📌 Conclusion
🔻 As long as the price remains below the 1.36000 resistance, the bias remains bearish. Watch for confirmations at 1.33090 and 1.32000 – these are crucial zones where price decisions will unfold.
📆 Short to mid-term traders may look for sell setups on retracements with stop-losses above the resistance and targets near support zones.

GBPUSD consolidates resistance zone and declinesPlan GBPUSD day: 16 June 2025
Related Information: !!!
The Pound Sterling (GBP) ticks up to near 1.3590 against the US Dollar (USD) so far on Monday, remaining inside Friday’s trading range. The GBP/USD pair is expected to keep trading within a tight range as investors have sidelined ahead of monetary policy announcements by the Federal Reserve (Fed) and the Bank of England (BoE), due on Wednesday and Thursday, respectively.
At the start of the week, the US Dollar Index (DXY), which tracks the Greenback’s value against six major currencies, edges down to near 98.00.
Investors will closely monitor the interest rate guidance from both central banks, while they are expected to leave those unchanged at their current levels
personal opinion:!!!
At the beginning of the week, there was not much important news. GBPUSD price was sideways and reacted to resistance and support zones.
Important price zone to consider :
SELL point: zone 1.35950
Sustainable trading to beat the market

GBPUSD H1 compression BUY/HOLD TP1 +100 TP2 +200 pips low risk🏆 GBPUSD Market Update
📊 Technical Outlook
Short-term: BULLS active; resistance forming mid‑1.3600s, consolidation below 1.3600s
Mid-term: Neutral to slight bullish bias; bulls seek 1.3600–1.3700/1.3730 zone
Status: Narrow trading range (tight band) ahead of key UK CPI, Fed & BoE meetings
🔥 Latest Forex Updates
GBP/USD is consolidating in a narrow range around the mid‑1.3500s ahead of this week’s UK CPI and central bank meetings.
The pair holds defensive below 1.3600, with dovish BoE bets capping gains while the Fed is expected to stand pat.
GBP/USD sits near a 40‑month high (~1.3600), boosted by geopolitical risk tone, but lacking momentum to break much higher.
GBP/USD hit ~1.3600 after rebounding from 1.3515 amid renewed Middle East tensions and a weaker US dollar.
Live charts show a mild bullish tilt, awaiting central bank outcomes.
💡 Trade Recommendation
Buy GBPUSD at 1.3530 (recommended entry near 1.3530)
Take Profit at 1.3730 → +200 pips profit target
Stop Loss: 50 pips (around 1.3480)
This trade aligns with the current structure: shallow dip followed by rebound, positioning ahead of central bank catalysts. Momentum above resistance could propel GBP/USD toward 1.3730.
📌 Market Overview
Metric Details
Current Price ~1.3565–1.3600
24H Range 1.3515–1.3600
Central Event Risks UK CPI (Wed), US Retail Sales & Fed (Wed), BoE (Thu)
Geopolitical Middle East tension supports USD weakness, aiding GBP
📈 Forecast Highlights
Support Levels: ~1.3530 (100‑period SMA), ~1.3460, ~1.3425
Resistance Levels: 1.3600, 1.3630 static ceiling, followed by ~1.3700–1.3730 for bulls
🧭 Final Take
GBP/USD sits in a tight range, awaiting central bank clarity. The recommended long trade at 1.3530 aims to capitalize on upside momentum toward 1.3730, supported by technical confluence and a softer USD. Manage risk with a 50‑pip stop loss.

The Calm Before the Storm: All Eyes on UK CPI & Central BanksGBPUSD 17/06 – The Calm Before the Storm: All Eyes on UK CPI & Central Banks
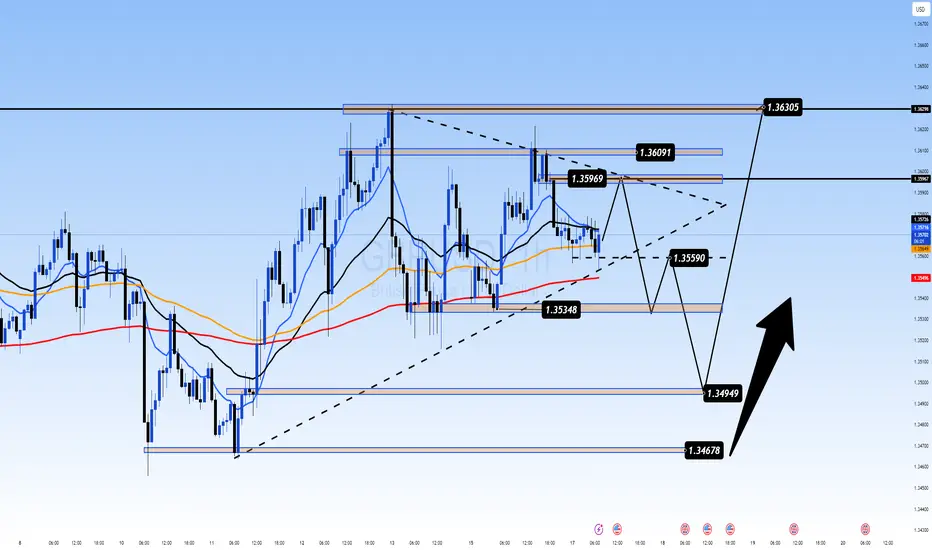
The GBPUSD pair is coiling in a tight range near the mid-1.3500s as traders brace for two high-impact events: UK CPI data on Wednesday and interest rate decisions from both the Fed and BoE this week. Price remains supported above the 200 EMA and is compressing within a symmetrical triangle – typically a precursor to a major breakout.
📊 Macro & Fundamental Outlook
🔹 Federal Reserve (FOMC): Expected to hold rates steady, but growing anticipation of a dovish tilt toward September is weighing slightly on the USD.
🔹 Bank of England (BoE): Markets are pricing in deeper rate cuts following recent UK GDP weakness, pressuring the GBP in the short term.
🔹 Geopolitical Risks: Rising Middle East tensions are fuelling demand for USD as a safe haven, reinforcing its strength ahead of data events.
📝 Bottom Line: The CPI release could be the first trigger to shift GBPUSD’s current consolidation. A hot inflation print might push GBP higher; a miss could fuel further downside.
🔧 Technical Analysis (H1 Chart)
Price is ranging between 1.3535 (support) and 1.3609 (resistance)
EMAs 13/34 crossing below EMA 89 → signal of potential bearish continuation
Uptrend line from 1.3467 is still intact and acting as dynamic support
Break below 1.3559 may lead to a move toward 1.3495 and 1.3467
A confirmed breakout above 1.3609 opens the door to 1.3630+
🎯 Trade Scenarios
Scenario 1 – Buy from Trendline Support
Buy Zone: 1.3495 – 1.3467
Stop Loss: 1.3440
Targets: 1.3535 → 1.3559 → 1.3596 → 1.3630
🟢 Best setup if price prints a bullish engulfing or hammer candle on key support + UK CPI surprise.
Scenario 2 – Sell on Resistance Rejection
Sell Zone: 1.3609 – 1.3630
Stop Loss: 1.3660
Targets: 1.3590 → 1.3559 → 1.3535 → 1.3495
🔴 Only valid with strong rejection signals + softer UK data or hawkish Fed tone.
💡 Market Sentiment
Retail traders are trapped in a waiting zone – expecting a breakout
Institutions may push price into one direction pre-data to collect liquidity
Risk appetite is fragile, and traders are cautious ahead of back-to-back central bank announcements
📌 Final Thoughts
GBPUSD is preparing for volatility. Instead of chasing moves, let the market come to your key zones and react with discipline. The 1.3467–1.3495 support area could be crucial for the next directional move.
Stay patient. Wait for confirmation. Respect your risk.

Bullish ContinuationI am expecting price to continue higher from this area of fresh unmitigated demand zone.

GBPUSD SHORT FORECAST Q2 W25 D17 Y25GBPUSD SHORT FORECAST Q2 W25 D17 Y25
Professional Risk Managers👋
Welcome back to another FRGNT chart update📈
Diving into some Forex setups using predominantly higher time frame order blocks alongside confirmation breaks of structure.
Let’s see what price action is telling us today!
💡Here are some trade confluences📝
✅Weekly order block
✅15' order block
✅Intraday 15' break of structure
✅Tokyo ranges to be filled
🔑 Remember, to participate in trading comes always with a degree of risk, therefore as professional risk managers it remains vital that we stick to our risk management plan as well as our trading strategies.
📈The rest, we leave to the balance of probabilities.
💡Fail to plan. Plan to fail.
🏆It has always been that simple.
❤️Good luck with your trading journey, I shall see you at the very top.
🎯Trade consistent, FRGNT X

GBPUSD SELL OPPORTUNITY Price increases in a sell probability as it rejects at the high of 1.36213 a sell opportunity is envisaged from the current market price. Target profit is 1.35175 while our stop loss is at 1.35930

GU-Tue-17/06/25 TDA-Daily resistance 1.36155 holding strong!Analysis done directly on the chart
Follow for more, possible live trades update!
No one is born with skills and knowledge.
Everyone see the success but not the struggle
behind everything (not all of course). If you want
to get out of a situation, you need to learn to be
uncomfortable and getting out of your comfort zone.
Active in London session!
Not financial advice, DYOR.
Market Flow Strategy
Mister Y

GBPUSD gbpusd is lredy in uptrend but there is time consuming becuse this week bnk rte nd fed rte come so probbly they re witing to mke buy

Bearish drop?The Cable (GBPUSD) is rising towards the pivot, which is a pullback resistance and could reverse to the 1st support.
Pivot: 1.3592
1st Support: 1.3536
1st Resistance: 1.3629
Risk Warning:
Trading Forex and CFDs carries a high level of risk to your capital and you should only trade with money you can afford to lose. Trading Forex and CFDs may not be suitable for all investors, so please ensure that you fully understand the risks involved and seek independent advice if necessary.
Disclaimer:
The above opinions given constitute general market commentary, and do not constitute the opinion or advice of IC Markets or any form of personal or investment advice.
Any opinions, news, research, analyses, prices, other information, or links to third-party sites contained on this website are provided on an "as-is" basis, are intended only to be informative, is not an advice nor a recommendation, nor research, or a record of our trading prices, or an offer of, or solicitation for a transaction in any financial instrument and thus should not be treated as such. The information provided does not involve any specific investment objectives, financial situation and needs of any specific person who may receive it. Please be aware, that past performance is not a reliable indicator of future performance and/or results. Past Performance or Forward-looking scenarios based upon the reasonable beliefs of the third-party provider are not a guarantee of future performance. Actual results may differ materially from those anticipated in forward-looking or past performance statements. IC Markets makes no representation or warranty and assumes no liability as to the accuracy or completeness of the information provided, nor any loss arising from any investment based on a recommendation, forecast or any information supplied by any third-party.

GBPUSD ScalpAs we see, here we have strong and beautiful resistance level.
The price will go down and test previous levels. TP: 1.35659 (30-33pips).

GBPUSD H1 I Bearish Reversal Off the 61.8% FibBased on the H1 chart analysis, we can see that the price is rising toward our sell entry at 1.3594, which is a pullback resistance aligning with a 61.8% Fib retracement.
Our take profit will be at 1.3555, an overlap support level aligning with the 78.6% Fib retracement.
The stop loss will be placed at 1.3631, a swing high resistance.
High Risk Investment Warning
Trading Forex/CFDs on margin carries a high level of risk and may not be suitable for all investors. Leverage can work against you.
Stratos Markets Limited (tradu.com ):
CFDs are complex instruments and come with a high risk of losing money rapidly due to leverage. 63% of retail investor accounts lose money when trading CFDs with this provider. You should consider whether you understand how CFDs work and whether you can afford to take the high risk of losing your money.
Stratos Europe Ltd (tradu.com ):
CFDs are complex instruments and come with a high risk of losing money rapidly due to leverage. 63% of retail investor accounts lose money when trading CFDs with this provider. You should consider whether you understand how CFDs work and whether you can afford to take the high risk of losing your money.
Stratos Global LLC (tradu.com ):
Losses can exceed deposits.
Please be advised that the information presented on TradingView is provided to Tradu (‘Company’, ‘we’) by a third-party provider (‘TFA Global Pte Ltd’). Please be reminded that you are solely responsible for the trading decisions on your account. There is a very high degree of risk involved in trading. Any information and/or content is intended entirely for research, educational and informational purposes only and does not constitute investment or consultation advice or investment strategy. The information is not tailored to the investment needs of any specific person and therefore does not involve a consideration of any of the investment objectives, financial situation or needs of any viewer that may receive it. Kindly also note that past performance is not a reliable indicator of future results. Actual results may differ materially from those anticipated in forward-looking or past performance statements. We assume no liability as to the accuracy or completeness of any of the information and/or content provided herein and the Company cannot be held responsible for any omission, mistake nor for any loss or damage including without limitation to any loss of profit which may arise from reliance on any information supplied by TFA Global Pte Ltd.
The speaker(s) is neither an employee, agent nor representative of Tradu and is therefore acting independently. The opinions given are their own, constitute general market commentary, and do not constitute the opinion or advice of Tradu or any form of personal or investment advice. Tradu neither endorses nor guarantees offerings of third-party speakers, nor is Tradu responsible for the content, veracity or opinions of third-party speakers, presenters or participants.

GBPUSD(20250617)Today's AnalysisMarket news:
Revised version of the Republican tax cut bill in the US Senate: It is proposed to raise the debt ceiling to 5 trillion, and the overall framework is consistent with the House version.
Technical analysis:
Today's buying and selling boundaries:
1.3577
Support and resistance levels:
1.3664
1.3632
1.3611
1.3544
1.3522
1.3490
Trading strategy:
If it rises and breaks through 1.3577, consider entering the market to buy, and the first target price is 1.3611
If it falls and breaks through 1.3544, consider entering the market to sell, and the first target price is 1.3522

Sell idea on GUAlong with you saw a set up this morning at 5 AM at the peak of London. We are now activated due to price breaking our counter trend line on the five minute time frame. Price originally came into 4hr HL and then tapped our double engulfing on the one hour.

GBPUSD ANALYSIS Based on technical analysis GU is in a bullish trend and we should only be looking for buys.
Expect a pullback near the fibs reversal zone for a buy entry.
Risk Reward- 1% : 3 or your TP can be the 4H HH zone.
Keep your trading plan simple and only take quality trades in the direction of the trend. The trend is your soulmate.

GBPUSD ANALYSIS After seeing how the previous daily candle close bullish and the 4hr structure make a retracement to a key level of 1.35626, we could be looking for another push leg up to make a new HH on the 4hr but waiting for confirmation on the daily timeframe.

GBP USD LONG RESULT Price has been moving inside a major symmetrical triangle and holding the major 4HTF support Trendline, imminent for Breakout to the upside and new Levels.
Qnd price in confluence with our direction 🔥
_THE_KLASSIC_TRADER_.

GBP USD LONG RESULT Price had broken out of the narrow falling channel and showed good signs of reversal to the upside with strength and also a demand level to fill above.

Bearish drop?GBP/USD has reacted off the resistance level which is a pullback resistance and could drop from this level to our take profit.
Entry: 1.3610
Why we like it:
There is a resistance level.
Stop loss: 1.3644
Why we like it:
There is a resistance level at the 161.8% Fibonacci extension.
Take profit: 1.3560
Why we like it:
There is a pullback support level that is slightly below the 61.8% Fibonacci retracement.
Enjoying your TradingView experience? Review us!
Please be advised that the information presented on TradingView is provided to Vantage (‘Vantage Global Limited’, ‘we’) by a third-party provider (‘Everest Fortune Group’). Please be reminded that you are solely responsible for the trading decisions on your account. There is a very high degree of risk involved in trading. Any information and/or content is intended entirely for research, educational and informational purposes only and does not constitute investment or consultation advice or investment strategy. The information is not tailored to the investment needs of any specific person and therefore does not involve a consideration of any of the investment objectives, financial situation or needs of any viewer that may receive it. Kindly also note that past performance is not a reliable indicator of future results. Actual results may differ materially from those anticipated in forward-looking or past performance statements. We assume no liability as to the accuracy or completeness of any of the information and/or content provided herein and the Company cannot be held responsible for any omission, mistake nor for any loss or damage including without limitation to any loss of profit which may arise from reliance on any information supplied by Everest Fortune Group.

GBPUSD Making Its Prices HighGBP/USD now faces some renewed selling orders and slips back to the 1.3600 zone on Monday. Cable's decent gains come on the heels of rising pessimism about the US Dollar and encouraging geopolitical news.
