Long trade
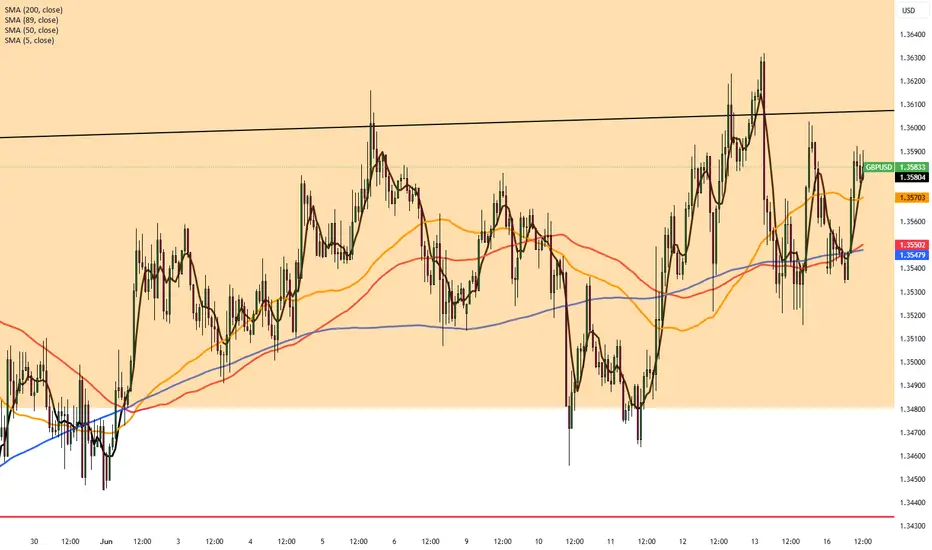
🟢 GBPUSD – Buyside Trade
Date: Monday, 16th June 2025
Session: London Session AM
Time: 5:00 AM
Entry Timeframe: 1Hr TF
Trade Parameters
Entry: 1.35864
Take Profit: 1.36168 (+0.22%)
Stop Loss: 1.35664 (−0.15%)
Risk-Reward Ratio (RR): 1.5
🧠 Trade Reasoning
This GBPUSD buyside trade was structured around an early London session setup, targeting a short-term liquidity gap above. Price had formed a bullish 1Hr structure, establishing a higher low.
GBPUSD trade ideas

GBPUSD BuyBuild up channel and also it is bearish. Price induced channel and should upward to take out liquidity.

GBPUSDAs you can see the pair above , it has reached premium levels , so now we are awaiting for liq to be taken and it starts to sell

GBPUSD Will Move Higher! Buy!
Take a look at our analysis for GBPUSD.
Time Frame: 1h
Current Trend: Bullish
Sentiment: Oversold (based on 7-period RSI)
Forecast: Bullish
The price is testing a key support 1.349.
Current market trend & oversold RSI makes me think that buyers will push the price. I will anticipate a bullish movement at least to 1.352 level.
P.S
The term oversold refers to a condition where an asset has traded lower in price and has the potential for a price bounce.
Overbought refers to market scenarios where the instrument is traded considerably higher than its fair value. Overvaluation is caused by market sentiments when there is positive news.
Disclosure: I am part of Trade Nation's Influencer program and receive a monthly fee for using their TradingView charts in my analysis.
Like and subscribe and comment my ideas if you enjoy them!

GBP/USD LONG FROM SUPPORT
Hello, Friends!
GBP/USD pair is trading in a local uptrend which know by looking at the previous 1W candle which is green. On the 4H timeframe the pair is going down. The pair is oversold because the price is close to the lower band of the BB indicator. So we are looking to buy the pair with the lower BB line acting as support. The next target is 1.358 area.
Disclosure: I am part of Trade Nation's Influencer program and receive a monthly fee for using their TradingView charts in my analysis.
✅LIKE AND COMMENT MY IDEAS✅

Sell GBPUSDthe GBPUSD is rejected form OB and BB indicator and wait to cross the SMA 21 then sell, SL is 1.3594 and the first TP is 1.35560 and the second TP is 1.35385

GBP/USD Long - Break & Retest with EMA Confluence (Trade Active)Price has broken above the descending trendline and retested a key S/R zone around 1.3566–1.3584, forming a clean break-and-retest setup.
✅ Entry: 1.3584
🎯 Target: 1.3628
🛡️ SL: Below 1.3566
📈 Confluences:
• Trendline breakout
• Retest of structure
• EMA 20/50 bounce
• Higher lows on the 1H timeframe
Trade is currently active — managing risk and letting it play out. Let’s see if we get the continuation move toward resistance.

Pound Stable as Markets Eye BoE, Fed MovesGBP/USD remains below Friday’s three-year high, trading around the mid-1.3500s in a narrow range during Monday’s Asian session. The pair shows limited downside as traders await a busy week of key data and central bank decisions.
Markets are watching the UK CPI on Wednesday and the Bank of England’s policy announcement on Thursday, both crucial for the Pound. The US Federal Reserve will also decide on rates Wednesday, likely guiding the dollar’s short-term path.
Friday’s UK GDP showed a 0.3% contraction in April, increasing bets on faster BoE rate cuts. The USD is supported by safe-haven flows due to Middle East tensions, though soft US inflation data has raised expectations for Fed cuts by September. A broadly positive global risk mood is offering some support to GBP/USD.
Resistance is at 1.3600, with support around 1.3425.
EURUSD, GBPUSD and AUDUSD Analysis todayHello traders, this is a complete multiple timeframe analysis of this pair. We see could find significant trading opportunities as per analysis upon price action confirmation we may take this trade. Smash the like button if you find value in this analysis and drop a comment if you have any questions or let me know which pair to cover in my next analysis.

GBPUSD INTRADAY Bullish flag developing supported at 1.3500The GBP/USD currency pair maintains a bullish sentiment, supported by a rising trendline and sustained higher lows. The recent intraday price action suggests a corrective pullback within an overall uptrend, indicative of a consolidation phase rather than a reversal.
Key Support Level: 1.3500
This level aligns with a previous consolidation zone and is acting as a pivotal support. A pullback toward this level could offer a potential buying opportunity, especially if bullish momentum returns.
Upside Targets (on bullish continuation from 1.3500):
1.3610 – Initial resistance from prior swing high
1.3650 – Intermediate resistance level
1.3700 – Long-term target and potential top of the current bullish channel
Bearish Scenario (if 1.3500 fails):
A daily close below 1.3500 would invalidate the current bullish setup, signaling a potential shift in trend. In that case:
Immediate support at 1.3480
Deeper retracement could extend to 1.3450
Conclusion
The broader trend in GBP/USD remains bullish, with the current consolidation viewed as a potential pullback rather than a reversal. The 1.3500 level is critical — a bounce from here could resume the uptrend toward 1.3610 over time. However, a break and close below 1.3500 would weaken the bullish case and open the door to further downside. Traders should monitor price action closely around this key level for confirmation.
This communication is for informational purposes only and should not be viewed as any form of recommendation as to a particular course of action or as investment advice. It is not intended as an offer or solicitation for the purchase or sale of any financial instrument or as an official confirmation of any transaction. Opinions, estimates and assumptions expressed herein are made as of the date of this communication and are subject to change without notice. This communication has been prepared based upon information, including market prices, data and other information, believed to be reliable; however, Trade Nation does not warrant its completeness or accuracy. All market prices and market data contained in or attached to this communication are indicative and subject to change without notice.

The Day AheadKey Data Releases:
US Empire Manufacturing Index (June): Snapshot of NY manufacturing. May impact USD and Treasuries.
China (May): Retail sales, industrial production, home prices, and property investment – critical for global growth sentiment. Impacts commodities, AUD, and risk appetite.
Eurozone Q1 Labour Costs: Monitored by ECB for wage inflation. Affects EUR and rate expectations.
Canada (May): Housing starts and home sales – may move CAD slightly.
Central Bank Speakers:
ECB's Nagel (hawkish) and Cipollone (dovish): May hint at future ECB rate moves. Watch EUR reaction.
Bond Market:
US 20-year Treasury auction: Tests investor demand for long-term US debt. Can influence yields and USD.
Trading Focus:
Watch early Asia session for China data impact.
ECB commentary and bond auction may shape Euro and US session direction.
Possible volatility in EUR, USD, bonds, commodities, and equity futures.
This communication is for informational purposes only and should not be viewed as any form of recommendation as to a particular course of action or as investment advice. It is not intended as an offer or solicitation for the purchase or sale of any financial instrument or as an official confirmation of any transaction. Opinions, estimates and assumptions expressed herein are made as of the date of this communication and are subject to change without notice. This communication has been prepared based upon information, including market prices, data and other information, believed to be reliable; however, Trade Nation does not warrant its completeness or accuracy. All market prices and market data contained in or attached to this communication are indicative and subject to change without notice.

GBPUSD ANALYSISAfter seeing the previous weekly candle close bullish, and the structure on the daily and 4hr timeframes all pointing to a bullish trend we could expect the market to make a new leg to the upside.

GU-Mon-16/06/25 TDA-All major banks rate decisions this week!Analysis done directly on the chart
Follow for more, possible live trades update!
To measure your consistency performance, you
need years of track record. Having good days or
weeks or months is not enough to say that you
are consistently profitable. This is the reality of
trading. You need to adapt to how market is
changing and with time that really proves how
good you are.
Active in London session!
Not financial advice, DYOR.
Market Flow Strategy
Mister Y

GBPUSD - Still Bullish - Dont trap your self ! Hi Guyz, welcome to other episode of analysis for GBPUSD.
From our 1H chat, it is seen that as per DOW Theory, the market has broken the HL and it seems like market has entered into the bearish trend However, the catch is there is no divergence followed by the break of HL. It implies that market is taking a corrective move, which is 50 percent of FIB level. Thus, there is a formation of AB=CD harmonic pattern.
we plan our entry on the break of "B" point and projected TP in our case is "D" point.
stop loss is placed beneath HL as marked.

Fundamental Market Analysis for June 16, 2025 GBPUSDEvent to pay attention to today:
15:30 EET. USD - Empire Manufacturing Manufacturing Index
GBPUSD:
The GBP/USD pair remains on the defensive below Friday's three-year high, although it lacks bearish conviction and is trading in a narrow range around 1.3500 during the Asian session.
The latest UK consumer inflation data will be released on Wednesday, ahead of Thursday's Bank of England (BoE) meeting, which will play a key role in influencing the British pound (GBP). In addition, the US Federal Reserve (Fed) plans to announce its monetary policy decision on Wednesday, which will affect the US dollar (USD) exchange rate and give a significant boost to the GBP/USD pair.
Meanwhile, weaker UK GDP data released on Friday, which showed that the economy contracted more than expected by 0.3% in April, reinforced expectations that the BoE will cut interest rates more aggressively than anticipated. On the other hand, the US dollar is receiving some support from the global flight to safe assets caused by rising geopolitical tensions in the Middle East, which is helping to limit the growth of the GBP/USD pair.
However, growing recognition that the US central bank will also resume its rate-cutting cycle in September amid signs of weakening inflation in the US is holding back dollar bulls from aggressive bets. Moreover, the generally positive risk sentiment acts as a barrier to the dollar as a safe haven and provides some support to the GBP/USD pair, which requires some caution before confirming that spot prices have peaked.
Trading recommendation: BUY 1.35500, SL 1.35300, TP 1.36400

GBPUSD SHORT FORECAST Q2 W25 D16 Y25GBPUSD SHORT FORECAST Q2 W25 D16 Y25
Professional Risk Managers👋
Welcome back to another FRGNT chart update📈
Diving into some Forex setups using predominantly higher time frame order blocks alongside confirmation breaks of structure.
Let’s see what price action is telling us today!
💡Here are some trade confluences📝
✅Weekly order block
✅15' order block
✅Intraday 15' break of structure
✅Tokyo ranges to be filled
🔑 Remember, to participate in trading comes always with a degree of risk, therefore as professional risk managers it remains vital that we stick to our risk management plan as well as our trading strategies.
📈The rest, we leave to the balance of probabilities.
💡Fail to plan. Plan to fail.
🏆It has always been that simple.
❤️Good luck with your trading journey, I shall see you at the very top.
🎯Trade consistent, FRGNT X

GBPUSD – Bullish SymmetryHello traders!
We’re tracking a clean bullish AB=CD symmetry pattern on the 2H chart of GBPUSD. After printing a mirror leg into the 1.3516 zone, price reacted off the 200 SMA and has reclaimed the short-term structure, triggering our setup.
🔹 Pattern: Bullish Symmetry (AB = CD)
🔹 Completion Zone: 1.35164
🔹 Entry Level: 1.35415
🔹 Stop: 1.35146 (tight invalidation)
🔹 Target 1: 1.36254
🔹 Target 2: 1.37407
🔹 Extended: 1.38017
If price holds above 1.354 and continues to build above the 200 SMA, we expect momentum to carry toward the 61.8% retracement and higher. This is a textbook structural reversal setup with clear symmetry, tight risk, and multi-level targets.
⚠️ As always, manage your risk. Invalidation below 1.3515 cancels the symmetry thesis.
Let’s monitor how this plays out — follow for live updates and more clean chart structures.

Bullish bounce for the Cable?The price is falling towards the pivot which is a pullback support and could bounce to the 1st resistance.
Pivot: 1.3409
1st Support: 1.3108
1st Resistance: 1.3768
Risk Warning:
Trading Forex and CFDs carries a high level of risk to your capital and you should only trade with money you can afford to lose. Trading Forex and CFDs may not be suitable for all investors, so please ensure that you fully understand the risks involved and seek independent advice if necessary.
Disclaimer:
The above opinions given constitute general market commentary, and do not constitute the opinion or advice of IC Markets or any form of personal or investment advice.
Any opinions, news, research, analyses, prices, other information, or links to third-party sites contained on this website are provided on an "as-is" basis, are intended only to be informative, is not an advice nor a recommendation, nor research, or a record of our trading prices, or an offer of, or solicitation for a transaction in any financial instrument and thus should not be treated as such. The information provided does not involve any specific investment objectives, financial situation and needs of any specific person who may receive it. Please be aware, that past performance is not a reliable indicator of future performance and/or results. Past Performance or Forward-looking scenarios based upon the reasonable beliefs of the third-party provider are not a guarantee of future performance. Actual results may differ materially from those anticipated in forward-looking or past performance statements. IC Markets makes no representation or warranty and assumes no liability as to the accuracy or completeness of the information provided, nor any loss arising from any investment based on a recommendation, forecast or any information supplied by any third-party.

lets have a great trading week!Hey guys its good to be back doing videos for yall i hope this video encourages yall

USDJPY recap + adding GBPUSD In watchlist Hello traders , here is the full multi time frame analysis for this pair, let me know in the comment section below if you have any questions , the entry will be taken only if all rules of the strategies will be satisfied. wait for more price action to develop before taking any position. I suggest you keep this pair on your watchlist and see if the rules of your strategy are satisfied.
🧠💡 Share your unique analysis, thoughts, and ideas in the comments section below. I'm excited to hear your perspective on this pair .
💭🔍 Don't hesitate to comment if you have any questions or queries regarding this analysis.

GBPUSDGBPUSD needs one more push up before a drop.
Disclosure: We are part of Trade Nation's Influencer program and receive a monthly fee for using their TradingView charts in our analysis.

TES swing buy projectionbullish structure
irl-erl liquidity target
point of interest: orderblock on LTF

Macro Analysis (GBP/USD)Likely aiming for 1.42491 and 1.43886 as potential targets.
There's also a possibility of a bounce near 1.17610 in the future.
The yearly timeframe failed at 1.05200 back in 2022, suggesting we're sitting at the bottom of the range.
Quick analysis — Despite all the social and political controversy in the UK, the macro chart clearly shows a long-term downtrend. Until price closes strongly above 1.43886, that's when this pair might have a chance vs the US dollar. (1.72062 for some stronger confidence lol)
That said, the past five monthly candles have all been green, showing some momentum and short to mid-term strength. Could easily just be a pullback before continuing lower, breaking below 1.05200, which honestly, wouldn’t surprise me.
But hey, let’s keep it to the charts. WOMEN lie, men lie, but numbers don’t. And this is all just numbers printed in a chart.
