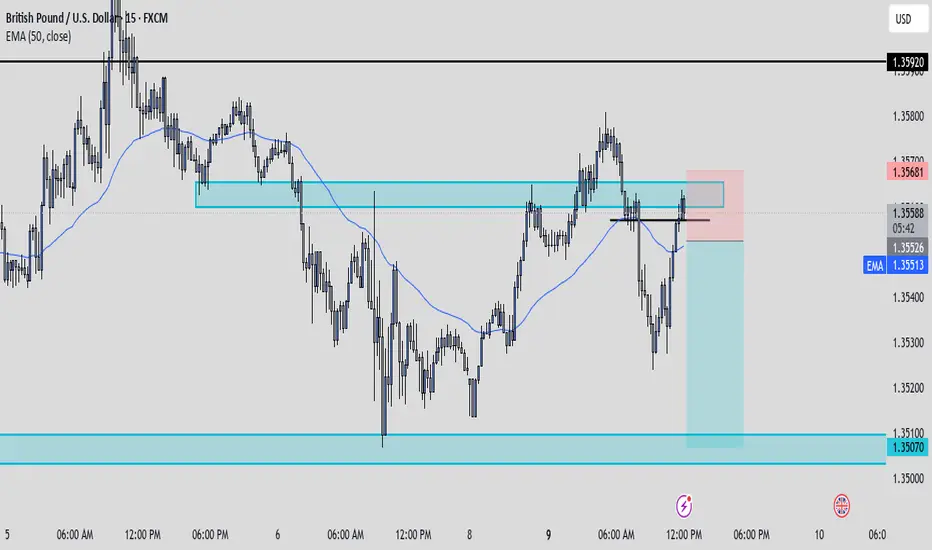
GBP USD LONG ANALYSIS
long cable
trend bias: bullish
entry: clear body close above 1.35800 to target thursday high of 1.36200
approx 35 pips
risk to reward 1:2
sl 15 pips
tp 30 pips
expected date: tuesday 10 june 2025 ldn/ny session
hh
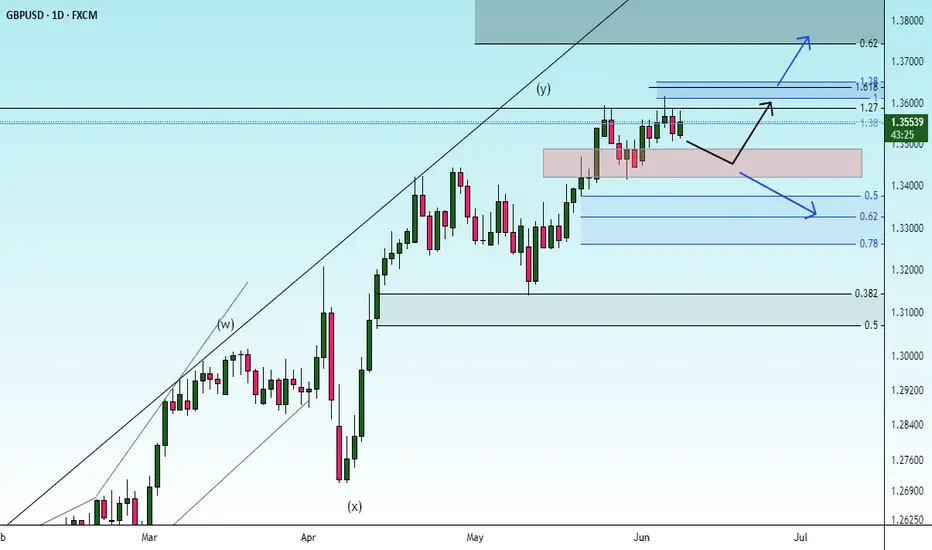
GBPUSD trade ideas

Correction and then uptrendIt is expected that after some fluctuations and corrections, the upward trend will continue.
If the price breaks through the support area, the downward trend will continue.
"GBP/USD is cooking inside a trianglePair: GBP/USD
Timeframe: 4H
Strategy: Elliott Wave + Triangle Pattern + Breakout
Formation: Contracting Triangle – Wave 1 to 5
Risk-Reward: High Probability Setup
Status: Pre-breakout phase
🔍 Technical Breakdown:
A clean contracting triangle is forming, completing all 5 internal waves within the structure.
Wave 5 looks exhausted and price is rejecting trendline resistance.
Expecting a bearish breakout from the triangle.
Target zone = 1.34759, aligning with previous liquidity + measured move.
Entry area refined with supply zone + minor structure break (as seen in inset schematic).
🎯 Target: 1.34759
🛑 Stop Loss: Above triangle resistance
🟢 Entry Trigger: After breakout + retest or SMC confirmation
This setup matches Elliott Wave’s triangle structure behavior – typically occurring before the final push in a larger correction or continuation.

GBPUSD Short Position Market swept liquidity of daily time frame resistance and made a logical sell structure. I am expecting short from position from that zone.

GBP/USD - confirmation with VWAP On GBP/USD , it's nice to see a strong buying reaction at the price of 1.33240 .
There's a significant accumulation of contracts in this area, indicating strong buyer interest. I believe that buyers who entered at this level will defend their long positions. If the price returns to this area, strong buyers will likely push the market up again.
VWAP + Uptrend and High volume cluster are the main reasons for my decision to go long on this trade.
Happy trading
Dale

#GBPUSD #IDEA #GBPUSD #IDEA Base on M15 i will waiting for this Bearish SMT Confirm first before looking for sell

Gbp/usd short 9/06Price has been seeing buying exhaustion. Currently testing weekly supply area. Dxy below 100.00 but the dollar being a safe haven will likely see strength due to geopolitical and domestic issues with the USA. Rates are also being held by the fed and until they are dropped there is a more hawkish tone.

GbpUsdWith GU currently ranging between 2 solid levels and being bearish on the higher time frame I'll personally be shorting the pair. Price on smaller time frames also gave us a clean market shift back below the resistance while being in sync with the higher time frame. If price can close with a bearish candle below the retest then I'll be executing shorts on this pair for a 1:3rr. If all goes well we could expect price to tap back into support below being 1.35100. We'll see what happens.
LONDON BREAKOUTLondon Breakout Strategy – GBP/USD
In this setup, I defined a price range based on the high and low between 04:00 to 06:00 UTC, just before the London session opens. This range forms a pre-London consolidation box.
Entry (Buy): 1.35686 – Entered as the London session opened and price showed bullish momentum.
Stop Loss (SL): 1.35490 – Set just below the low of the 4–6 UTC range.
Take Profit (TP): 1.35980 – Calculated using a 1.5x risk-to-reward ratio based on the SL distance.
This strategy aims to catch early London volatility by entering on a breakout with a clear predefined risk and reward setup.
Feel free to comment and share your ideas

How should GBP bulls prepare for battle?The GBP/USD came under pressure during the North American session, trading near 1.353. The market is digesting a series of upcoming UK domestic data and global macro risk events, with overall volatility likely to increase. The recent high of 1.3616 forms a short-term resistance, while the 1.3500 level below serves as a key support zone. Short-term bulls need to hold the 1.3500 support band. If the price rebounds without breaking this level and can break above the 1.3570–1.3616 resistance area with increased trading volume,
Humans need to breathe, and perfect trading is like breathing—maintaining flexibility without needing to trade every market swing. The secret to profitable trading lies in implementing simple rules: repeating simple tasks consistently and enforcing them strictly over the long term.

EURUSD - LongTried to upload this a while ago but for some reason TV was acting up
Im currently in a long position.
We had a 15min structure shift to the upside meaning I was looking at the most relevant place to get long.
Took the entry cased on the 1min timeframe
First target is set at 1.35810
Secondary targets I will be shooting for the HTF high
GBP/USD | Supply Zone Holding – Major Drop Incoming?Price is now inside a key institutional supply zone (1.35400 area)
🔵 This zone has previously led to strong rejections – and it’s holding again.
📉 Bearish bias remains valid as long as price trades below this zone.
---
🎯 Potential Targets:
🟦 TP1: 1.28451 – Previous support zone
🟧 TP2: 1.24701 – Demand imbalance
🟨 TP3: 1.21693 – Major unfilled demand + price memory
---
🔍 What Smart Money Sees:
✔️ Liquidity above previous highs has been swept
✔️ Price now compressing under resistance = Possible redistribution
✔️ No new higher high = Weakness confirmation
---
📅 What’s Coming:
🇬🇧 GBP news event marked on the chart could trigger volatility – watch closely for fakeouts or confirmations!
---
✅ Trade Plan:
❌ No buys inside the supply zone
🔻 Look for bearish structure break + pullback entry
🔐 SL above 1.3560 wick trap
---
💬 What’s your take on this setup?
🟢 Breakout or 🔴 Breakdown?
👇 Drop your bias in the comments.
❤️ Like & 🔁 Share if you caught the last drop from this zone!
#GBPUSD #SmartMoney #LuxAlgo #SupplyAndDemand #ForexSignals #PriceAction #LiquiditySweep #InstitutionalTrading #ForexTradingView #GBPSetup

GBPUSD Sell analysis/ideaThis trade/analysis is based on the Daily and 4-hour timeframes and executed using reversal trading and trend formation. Complete explanation in the video!

Market Insights with Gary Thomson: 9 - 13 JuneMarket Insights with Gary Thomson: UK Unemployment & GDP, US Inflation & PPI, Earnings Reports
In this video, we’ll explore the key economic events, market trends, and corporate news shaping the financial landscape. Get ready for expert insights into forex, commodities, and stocks to help you navigate the week ahead. Let’s dive in!
In this episode, we discuss:
— UK Unemployment Rate
— US Inflation Rate
— UK GDP Growth Rate
— US Producer Price Index
— Corporate Earnings Statements
Don’t miss out—gain insights to stay ahead in your trading journey.
This video represents the opinion of the Companies operating under the FXOpen brand only. It is not to be construed as an offer, solicitation, or recommendation with respect to products and services provided by the Companies operating under the FXOpen brand, nor is it to be considered financial advice.

BULLISH A market break of structure occurred on the H1 indicating a buy. It jus got to a strong support to push the price up. The trend is still bullish.

Analysis of Trades and Trading Tips for the British PoundThe price test at 1.3535 in the second half of the day occurred just as the RSI indicator was beginning to move downward from the zero line. This confirmed the correct entry point for selling the pound, resulting in a decline of more than 30 pips.
U.S economic indicators published on Friday sparked a wave of optimism across financial markets. Non-farm employment showed confident growth, surpassing economists' forecasts and reaching 139,000 new jobs, while market expectations hovered around 127,000. This factor immediately impacted currency rates. prompting the U.S. dollar to strengthen against major world currencies, particularly the British pound. The unemployment rate, remaining stable at 4.2%, also added to the positive sentiment. A low unemployment rate indicates the U.S. economy's healthy state and stable labor demand. This provides a favorable backdrop for continued economic growth and strengthens the dollar's position. The British pound's reaction to this news was expected - a decline against the U.S dollar. investors, assessing U.S. economic prospects as more favorable, redirected their capital, increasing demand for the dollar and decreasing demand for the pound sterling.
Today, there is no economic data from the UK, so it possible that after Friday's pullback, pound buyers may continue to act within the bullish market framework, betting on further growth in the GBP/USD pair. The absence of fresh economic data leaves room for speculation and allows traders to rely on already-established trends. However, existing risks should not be forgotten, Global economic uncertainty due to U.S. tariffs could exert pressure on the British currency at any moment.

GBPUSD [Possible longsHere' how I'm watching GBPUSD for a potential buy trade. I reckon the buy would hold, although I'd be risking 0.5% of my equity because we didn't see the market take out previous high with deliberate candle closes, and that could mean that there are sellers lurking somewhere around.
However, until the sell is confirmed, the trend is our friend.
DYOR

09/06/2025: WILL WE SEE A BREAKOUT ABOVE 1.3550?GBP/USD PLAN – 09/06/2025: WILL WE SEE A BREAKOUT ABOVE 1.3550?
🌍 Macroeconomic & Fundamental Context:
UK Economic Outlook (BoE): The Bank of England (BoE) is under pressure due to inflation and has to make decisions regarding interest rate policy. Diverging opinions on whether to raise or lower rates are creating uncertainty in the market.
US Economic Outlook (Fed): The Federal Reserve's monetary policy continues to be a major influence on the USD, especially as the Fed maintains its rate hikes to control inflation.
US-UK Trade Relations: Trade negotiations between the US and the UK will remain an important factor this week, and any new developments could impact GBP/USD.
📉 Technical Analysis – GBP/USD:
On the H4 and H1 timeframes, GBP/USD is consolidating within a corrective structure, and price has broken several key Fibonacci levels. The EMA indicators (13, 34, 89) are showing strong momentum.
Key Resistance Levels:
1.3550 – This is a major resistance level. If broken, GBP/USD could continue its rally towards 1.3612.
Key Support Levels:
1.3520 – A short-term support level. If this breaks, price may retrace back to 1.3470.
🎯 Trading Scenarios for Today:
🟢 BUY ZONE:
Buy Zone: 1.3520 – 1.3500
SL: 1.3480
TP: 1.3550 → 1.3570 → 1.3600 → 1.3620 → 1.3650
If price retraces to 1.3520 – 1.3500, this would be an ideal buying opportunity with a target at 1.3550. Look for confirmation from technical indicators and the current trend.
🔴 SELL ZONE:
Sell Zone: 1.3550 – 1.3570
SL: 1.3590
TP: 1.3520 → 1.3500 → 1.3470 → 1.3450 → 1.3420
If price reaches the resistance zone of 1.3550 – 1.3570, consider selling with targets at the support levels below.
🟡 Scalping:
Buy Scalping: 1.3520 → 1.3500
Sell Scalping: 1.3570 → 1.3600
Look for short-term opportunities when price moves within the range.
⚠️ Important Notes:
Pay close attention to short-term fluctuations and any major economic data releases from the BoE and Fed.
Risk management is key during volatile periods.
📌 Conclusion:
GBP/USD is in a short-term corrective phase, but a breakout above 1.3550 could trigger a strong rally. Traders should monitor support and resistance levels carefully and ensure risk management is in place.

GBPUSDGBP/USD 10-Year Bond Yield, Interest Rate Differential, Carry Trade, and Uncovered Interest Rate Parity
1.the current 10-Year Bond Yields or UK 10-Year Gilt Yield: 4.63% (as of June 9, 2025), down slightly from recent highs but elevated due to persistent inflation concerns,while the US 10-Year Treasury Yield stands at 4.50% (as of June 9, 2025), reflecting fiscal uncertainties and moderated Fed rate cut expectations.
2.the Interest Rate Differential will be The 10-year yield spread (UK minus US) ,which is +0.13% (4.63% – 4.50%), favoring UK gilts.
The policy rate differential (BoE: 4.25%, Fed: 4.25–4.50%) is neutral to slightly negative for GBP, as the Fed holds rates steady while the BoE recently cut.
3. Carry Trade Implications
The modest yield spread provides a limited carry trade advantage for GBP over USD. Investors borrowing in USD to buy GBP assets gain a small yield pickup (~0.13%), but this is offset by:
Currency risk: GBP/USD volatility.
Economic uncertainty: UK inflation (3.5% y/y) remains sticky, while US growth and fiscal risks dominate.
4. Uncovered Interest Rate Parity (UIP)
UIP predicts the GBP should depreciate against USD by ~0.13% annually to offset the higher UK yield. However, deviations are common due to:
Risk premiums: Safe-haven USD demand during global uncertainty.
Diverging central bank policies: BoE’s recent rate cut vs. Fed’s cautious stance.
Inflation dynamics: UK CPI (3.5%) exceeds US forecasts (2.5%), pressuring BoE to maintain tighter policy despite cuts.
Key Data: UK services PMI (June 13) and US CPI (June 11) will dictate near-term momentum. A stronger US CPI print could widen the rate differential in favor of USD, pressuring GBP.
stay cautious .
#gbpusd

SHORT ON GBP/USDGBP/USD has just broken a uptrend line and has given us a nice break and retest to that same trendline.
The bearish have shown up and the dollar is currently looking bullish
I will be selling GBP/USD to the next level of demand for 50-80 pips

GBPUSD Sell- Go for sell if setup given then manage your trade
- potentially go lower
- Refine entry with smaller SL for better RR, if your strategy allow
A Message To Traders:
I’ll be sharing high-quality trade setups for a period time. No bullshit, no fluff, no complicated nonsense — just real, actionable forecast the algorithm is executing. If you’re struggling with trading and desperate for better results, follow my posts closely.
Check out my previously posted setups and forecasts — you’ll be amazed by the high accuracy of the results.
"I Found the Code. I Trust the Algo. Believe Me, That’s It."

CHECK GBPUSD SIGNALS READ CAPTAIN GBPUSD Sell zone
TRADE
Entry point 1.35795
Take profit Target 1.34816
Stop loss 1.35949
Follow money Menagment

GBPUSD Edges HigherGBPUSD Edges Higher
GBP/USD is attempting a fresh increase above the 1.3500 resistance.
Important Takeaways for GBP/USD Analysis Today
- The British Pound is attempting a fresh increase above 1.3515.
- There was a break above a key bearish trend line with resistance at 1.3535 on the hourly chart of GBP/USD at FXOpen.
GBP/USD Technical Analysis
On the hourly chart of GBP/USD at FXOpen, the pair declined after it failed to clear the 1.3615 resistance. The British Pound even traded below the 1.3575 support against the US Dollar.
Finally, the pair tested the 1.3500 zone and is currently attempting a fresh increase. The bulls were able to push the pair above the 50-hour simple moving average and 1.3540. There was a break above a key bearish trend line with resistance at 1.3535.
The pair tested the 50% Fib retracement level of the downward move from the 1.3616 swing high to the 1.3507 low. It is now showing positive signs above 1.3540.
On the upside, the GBP/USD chart indicates that the pair is facing resistance near 1.3575 and the 61.8% Fib retracement level of the downward move from the 1.3616 swing high to the 1.3507 low.
The next major resistance is near 1.3590. A close above the 1.3590 resistance zone could open the doors for a move toward 1.3615. Any more gains might send GBP/USD toward 1.3650.
On the downside, immediate support is near the 1.3515. If there is a downside break below 1.3515, the pair could accelerate lower. The first major support is near the 1.3500 level. The next key support is seen near 1.3450, below which the pair could test 1.3420. Any more losses could lead the pair toward the 1.3350 support.
This article represents the opinion of the Companies operating under the FXOpen brand only. It is not to be construed as an offer, solicitation, or recommendation with respect to products and services provided by the Companies operating under the FXOpen brand, nor is it to be considered financial advice.
