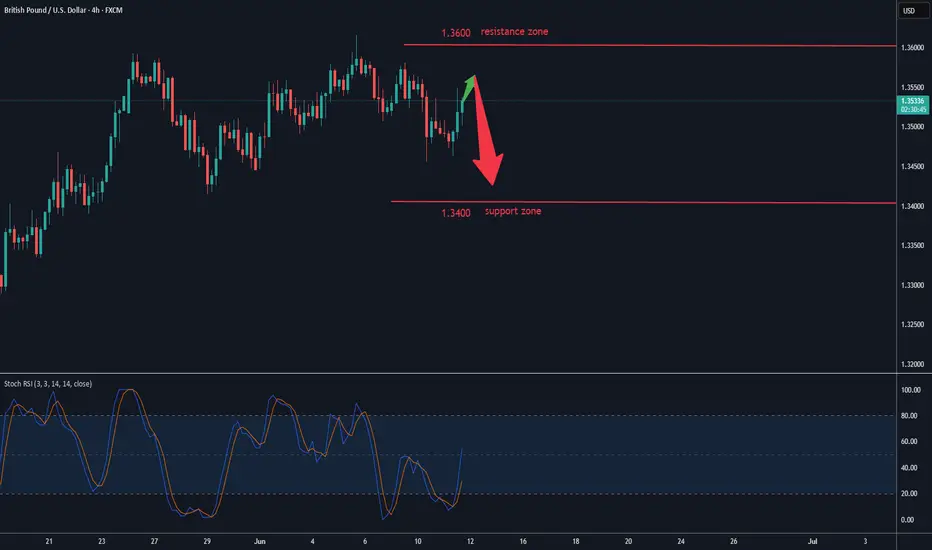
GBPUSD(20250612)Today's AnalysisMarket news:
① The EU hopes that the trade negotiations will be extended beyond the suspension period set by Trump. ② Bessant: As long as "sincerity" is shown in the negotiations, the Trump administration is willing to extend the current 90-day tariff suspension period beyond July 9. ③ Trump will hold multiple bilateral talks during the G7 summit. ④ The total customs revenue of the United States reached a record high of US$23 billion in May, an increase of nearly four times year-on-year. ⑤ Lutnick: One deal after another will be reached.
Technical analysis:
Today's buying and selling boundaries:
1.3525
Support and resistance levels:
1.3627
1.3589
1.3564
1.3486
1.3461
1.3423
Trading strategy:
If the price breaks through 1.3564, consider buying in, the first target price is 1.3589
If the price breaks through 1.3525, consider selling in, the first target price is 1.3486
GBPUSD trade ideas


GBPUSD - ShortWe are looking for short positions on this trade as we are still trading within the downtrend.
We could see the market break a bit to the downside if the markets break the 1.20500 area and start to head towards the 1.19000 area and possibly the 1.18500 area.
Note: please do your own analysis before entering the position.
If you are looking to enter the market, drop down to a lower TF and wait for your confirmations to be met before entering, using the correct risk management.
Risk:Reward - 1:10
Trading For All | All For Trading
Kevin Capital

GBPUSD - ShortsFirst published idea of the year!
I am looking for the markets to pull back into the 1.28 area before looking for a potential bullish continuation.
Note(s): My entry got missed by 2.4 pips lol & the 1.26 area is a bit ambitious haha..
Lets see how markets move in the Asian session going into the London open.

GBPUSD - Long at some pointVery similar with what we are looking for in relation to EURUSD
Will wait for a mitigation of the demand at lower price. Will wait for an internal structure break before looking to get long.
Will have a nice sleep now and will re-evaluate in the morning.
Caught 2 lovely trades on this today and hopefully I may be able to catch 1 or 2 more before the week is out.
Again, if you have any questions don't be shy to get in touch

GBPUSD SELL after sweeping the daily swing high, we are shifting structure on the 4 hour. We have returned to 4 hour order block. 1 hour has created an order block, looking to enter off that block and target the lows. Take partials on the way down

Bullish bounce off overlap support?GBP/USD is falling towards the support level which is an overlap support that aligns with the 38.2% Fibonacci retracement and could bounce from this level to our take profit.
Entry: 1.3543
Why we like it:
There is an overlap support level that aligns with the 38.2% Fibonacci re4tracement.
Stop loss: 1.3493
Why we like it:
There is a pullback support level that is slightly below the 61.8% Fibonacci retracement.
Take profit: 1.3601
Why we like it:
There is a pullback resistance level.
Enjoying your TradingView experience? Review us!
Please be advised that the information presented on TradingView is provided to Vantage (‘Vantage Global Limited’, ‘we’) by a third-party provider (‘Everest Fortune Group’). Please be reminded that you are solely responsible for the trading decisions on your account. There is a very high degree of risk involved in trading. Any information and/or content is intended entirely for research, educational and informational purposes only and does not constitute investment or consultation advice or investment strategy. The information is not tailored to the investment needs of any specific person and therefore does not involve a consideration of any of the investment objectives, financial situation or needs of any viewer that may receive it. Kindly also note that past performance is not a reliable indicator of future results. Actual results may differ materially from those anticipated in forward-looking or past performance statements. We assume no liability as to the accuracy or completeness of any of the information and/or content provided herein and the Company cannot be held responsible for any omission, mistake nor for any loss or damage including without limitation to any loss of profit which may arise from reliance on any information supplied by Everest Fortune Group.

News Trading - After release📉 News Spike Reversal – GBPUSD & USTEC, 15min
This example highlights how the ELFIEDT RSI + 3SD Reversion Strategy can be used to catch sharp pullbacks after a news-driven price spike, using statistically overextended conditions and volume-confirmed exhaustion.
🔻 What Happened Here:
📍 1. Sudden Spike on News Release
Both GBPUSD and USTEC experienced a sharp rally — likely due to a high-impact economic release or scheduled news event. This kind of impulsive movement often creates price extensions beyond normal volatility ranges.
📍 2. “DOWN” Signal Triggered on Both Assets
As price surged higher, the indicator detected that:
Price exceeded the upper statistical band (3SD above the moving average)
RSI entered extreme territory
Volume activity was significantly elevated
This triggered a “DOWN” label on both charts, flagging the area as a potential short-term top.
📍 3. High-Probability Reversal Back Toward the News Origin Zone
After the initial spike, both instruments retraced sharply, pulling back into the prior consolidation range — a classic “retest of the news move” often seen when markets overreact and correct shortly after.
✅ How You Could Have Traded It:
Watch for news-driven price surges — the strategy is built to detect extreme moves.
When the “DOWN” label appears on both instruments around the same time, it adds confluence — this increases conviction in the reversal potential.
Look for candle confirmation (e.g., bearish engulfing or long upper wick) to time the entry.
Target the origin of the news spike or the prior resistance zone as your first take-profit level.
🔁 Bonus: Multi-Asset Confluence
When two different markets react similarly to news and print simultaneous reversal signals, this serves as a strong confidence boost — especially when both RSI readings also begin to reverse from extremes.
This dual example shows how the ELFIEDT strategy can help traders avoid emotional trades during news volatility and instead catch logical pullbacks after the dust settles.

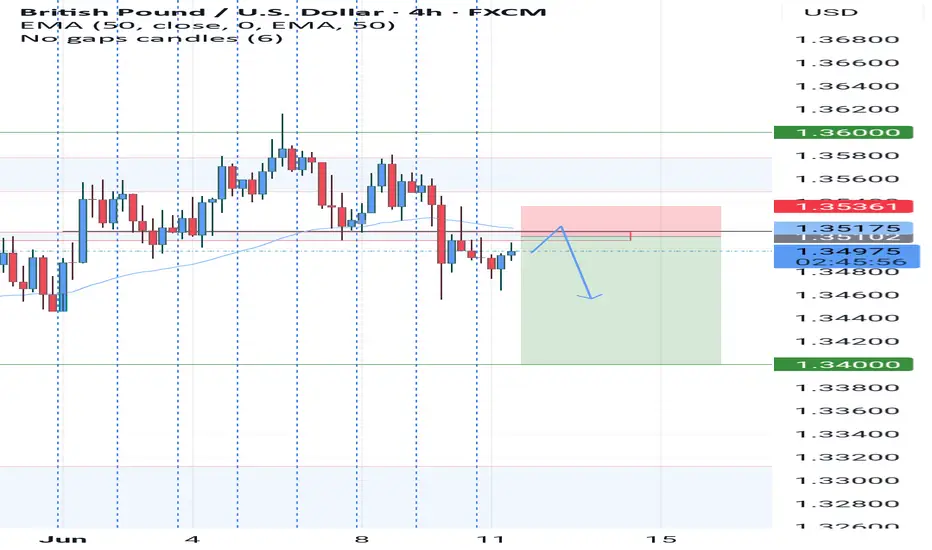
The British pound's rebound was blockedThe British pound staged a technical rebound after a sharp decline on Tuesday, trading near 1.35 during the North American session. A day earlier, the exchange rate had retreated amid expectations that the Bank of England (BoE) would continue to cut rates twice within the year, triggered by weak UK labor market data. However, on Wednesday, against the backdrop of the US CPI data falling short of expectations, the US Dollar Index weakened, allowing the pound to rebound. Although the exchange rate has regained the 1.35 threshold currently, if UK economic data continues to be weak, the pound may test support levels at 1.34 or lower again.
Humans need to breathe, and perfect trading is like breathing—maintaining flexibility without needing to trade every market swing. The secret to profitable trading lies in implementing simple rules: repeating simple tasks consistently and enforcing them strictly over the long term.
GBPUSD Downward pressure, an usual setup in line with trend
GBPUSD Downward pressure, an usual setup in line with trend
GBPUSD trade ideaFX:GBPUSD
Reason sell:
1) overall bearish
2) candle on trendline rejection
3) spinning top candle signals nearby reversal
4) target previous low

GBPUSD SELL OPPORTUNITYA Sell opportunity is envisaged from the current market price a we're beginning to see a weakness around recent high. a sell is expected.

gbpusd buy tradeThe Relative Strength Index (RSI) is showing an upward trend, indicating increasing momentum. Additionally, the Moving Average Convergence Divergence (MACD) is showing a bullish crossover, further supporting the potential for an upward move.

CHECK GBPUSD SIGNAL READ CAPTAINEntry: around 1.34950/1.34930✅
Take Profit 1 1.35000✅
Take Profit 2: 1,35100✅
Last Target: 1.35200✅
Stop Loss: 1.34850❌

GbpusdGbpusd as we can see is on a down trend so we are expecting price to move bearish and we have a clean head and shoulder pattern and a break and retest we are waiting for the market to retest well on the zone then we sell
GBPUSD - Longs📈 Catching the Reversal – GBPUSD, 15min
This chart shows a strong intraday reversal captured cleanly by the ELFIEDT RSI + 3SD Reversion Strategy, combining exhaustion signals, volume confirmation, and RSI momentum.
🟢 What Happened in This Setup:
Multiple “UP” Signals Fired
The indicator generated a cluster of bullish signals as price aggressively spiked downward. These signals were triggered by a statistically extreme drop below the lower volatility band, with RSI in oversold territory and volume elevated — a clear setup for a potential bounce.
Visual RSI Confirmation
RSI reached a deep low and began curling upward from the oversold zone shortly after the signals. This shift in momentum reinforced the idea that price was bottoming out.
Strong Recovery Move
Following the signal cluster, price reversed quickly and rallied for several candles in a row, making this a great low-risk, high-reward intraday buy opportunity.
✅ How You Could Have Traded It:
Wait for "UP" signals to print — these suggest price is overstretched and may soon revert.
Watch RSI for a momentum turn upward — it adds confidence to the setup.
Look for a bullish engulfing or strong close after the signal for entry confirmation.
Consider placing stops just below the low of the signal candle and targeting the next logical resistance or structure level for exits.
🔁 Confluence Boost Tip:
If similar “UP” signals were forming on the 1H timeframe at the same price zone, this would act as a powerful multi-timeframe confluence — increasing the reliability of the reversal.
This example highlights how combining exhaustion, volume, and RSI conditions — even without divergence — can produce clear and actionable trades using the ELFIEDT strategy.

GBPUSD - LongI missed the opportunity yesterday.
However, I've been lucky enough to get involved again as of this morning.
4H orderflow is still bullish so we will still look for the longs until the market tells us otherwise.
If I can help with anything do let me know

GBPUSD ready to jump?GBPUSD after retest of the daily support has got a bounce back to the upside with a momentum as the price already has got rejected back, we may see potential trend continuation. We can spot the double bottom on the lower timeframe from this support and may continue to rise to the resistance. A bullish trade is high probable after confirmation of potential inverted head and shoulder

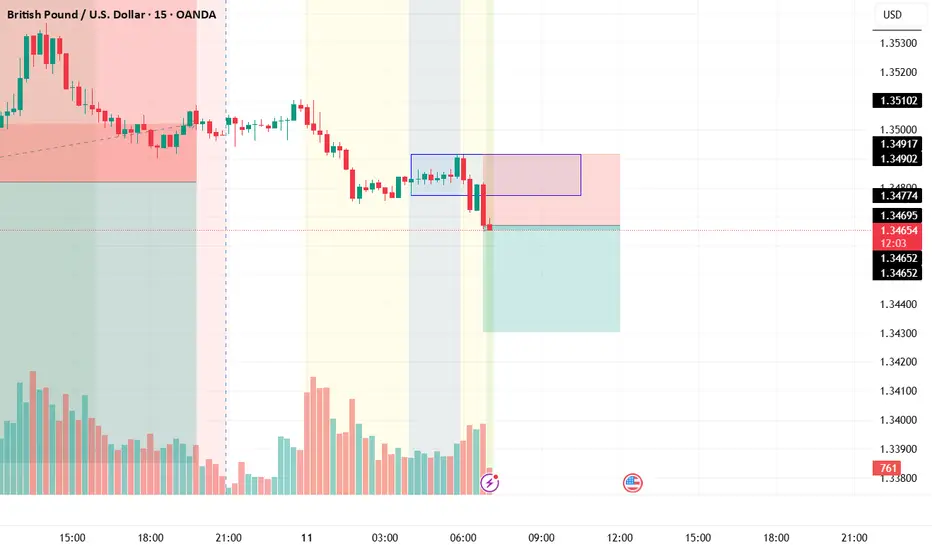
LONDON BREAKOUTLondon Breakout Strategy – GBP/USD (June 11)
In this trade, I used my usual approach by identifying the price range between 04:00 and 06:00 UTC to mark the consolidation zone before the London session.
As the London session opened, price showed bearish movement, breaking below the range. I entered a sell trade based on the breakout.
Entry (Sell): 1.34672 – Triggered as price moved below the consolidation zone.
Stop Loss (SL): 1.34917 – Set just above the early range high for controlled risk.
Take Profit (TP): 1.34305 – Targeting 1.5x the SL distance to maintain a solid risk-to-reward ratio.
This setup aims to take advantage of early London volatility with tight risk management and directional momentum.
Feel free to comment and share your ideas
GBPUSD – Sell Into Strength at Key ResistanceTrade Idea
Type: Sell Limit
Entry: 1.3557
Target: 1.3415
Stop Loss: 1.3593
Duration: Intraday
Expires: 12/06/2025 06:00
Technical Overview
GBPUSD has retraced a majority of its daily losses, with recent gains facing selling pressure in the Asian session.
The medium-term bias remains bearish, and the rally toward bespoke resistance at 1.3557 presents an opportunity to fade strength.
Volatility is expected to remain elevated, but price action continues to respect the broader downtrend structure.
The preferred approach is to sell into rallies, anticipating renewed downside momentum toward support at 1.3415.
Risks
Caution is warranted ahead of key U.S. CPI data releases at 13:30 UTC, which may amplify volatility and influence short-term dollar flows.
There is also a spending review in the UK, which may cause volatility.
Key Technical Levels
Resistance: 1.3557 / 1.3582 / 1.3617
Support: 1.3457 / 1.3415 / 1.3224
Disclosure: I am part of Trade Nation's Influencer program and receive a monthly fee for using their TradingView charts in my analysis.

GBPUSD LONGPrice an currently on a support level we expecting a bounce from here to the M30 resistance

GU-Wed-11/06/25 TDA-All eyes on US CPI release in NY session!Analysis done directly on the chart
Follow for more, possible live trades update!
Here's a brief definition of CPI copied directly from Fxstreet.com:
Link: www.fxstreet.com
Inflationary or deflationary tendencies are measured by periodically
summing the prices of a basket of representative goods and services
and presenting the data as The Consumer Price Index (CPI).
CPI data is compiled on a monthly basis and released by the
US Department of Labor Statistics. The YoY reading compares
the prices of goods in the reference month to the same month a year earlier.
The CPI is a key indicator to measure inflation and changes in purchasing trends.
Generally speaking, a high reading is seen as bullish for the US Dollar (USD),
while a low reading is seen as bearish.
Active in London session!
Not financial advice, DYOR.
Market Flow Strategy
Mister Y
