Bullish reversal off overlap support?The Cable (GBP/USD) is falling towards the pivot and could bounce to the 1st resistance, which is a pullback resistance that is slightly below the 38.2% Fibonacci retracement.
Pivot: 1.3159
1st Support: 1.3049
1st Resistance: 1.3321
Risk Warning:
Trading Forex and CFDs carries a high level of risk to your capital and you should only trade with money you can afford to lose. Trading Forex and CFDs may not be suitable for all investors, so please ensure that you fully understand the risks involved and seek independent advice if necessary.
Disclaimer:
The above opinions given constitute general market commentary, and do not constitute the opinion or advice of IC Markets or any form of personal or investment advice.
Any opinions, news, research, analyses, prices, other information, or links to third-party sites contained on this website are provided on an "as-is" basis, are intended only to be informative, is not an advice nor a recommendation, nor research, or a record of our trading prices, or an offer of, or solicitation for a transaction in any financial instrument and thus should not be treated as such. The information provided does not involve any specific investment objectives, financial situation and needs of any specific person who may receive it. Please be aware, that past performance is not a reliable indicator of future performance and/or results. Past Performance or Forward-looking scenarios based upon the reasonable beliefs of the third-party provider are not a guarantee of future performance. Actual results may differ materially from those anticipated in forward-looking or past performance statements. IC Markets makes no representation or warranty and assumes no liability as to the accuracy or completeness of the information provided, nor any loss arising from any investment based on a recommendation, forecast or any information supplied by any third-party.
GBPUSD trade ideas

GBPUSD – DAILY FORECAST Q3 | W31 | D30 | Y25📊 GBPUSD – DAILY FORECAST
Q3 | W31 | D30 | Y25
Daily Forecast 🔍📅
Here’s a short diagnosis of the current chart setup 🧠📈
Higher time frame order blocks have been identified — these are our patient points of interest 🎯🧭.
It’s crucial to wait for a confirmed break of structure 🧱✅ before forming a directional bias.
This keeps us disciplined and aligned with what price action is truly telling us.
📈 Risk Management Protocols
🔑 Core principles:
Max 1% risk per trade
Only execute at pre-identified levels
Use alerts, not emotion
Stick to your RR plan — minimum 1:2
🧠 You’re not paid for how many trades you take, you’re paid for how well you manage risk.
🧠 Weekly FRGNT Insight
"Trade what the market gives, not what your ego wants."
Stay mechanical. Stay focused. Let the probabilities work.
FX:GBPUSD

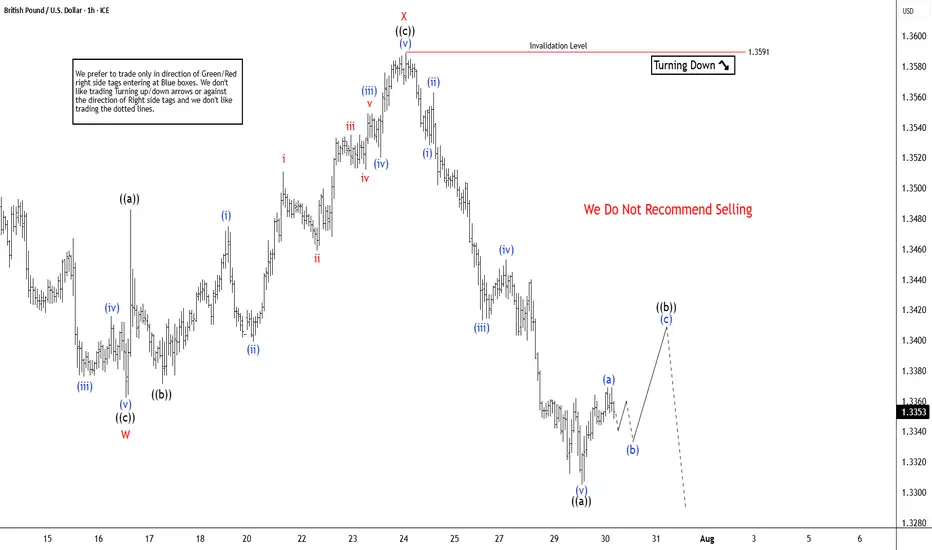
GBPUSD Elliott Wave Insight Bounce Should Fail Into Support ZoneThe GBPUSD is trading in higher high sequence from 9.22.2022 low in weekly. The bounce is corrective Elliott Wave sequence & expect further upside. It favors pullback in proposed 7 swings from 7.01.2025 high & extend into 1.3162 – 1.2898 area, while below 7.23.2025 high. It should find buyers into extreme area for next leg higher in daily or at least 3 swings bounce. In 4-hour, it started correcting lower from 7.01.2025 high. It ended W at 1.3362 low of 7.16.2025 & X at 1.3589 high of 7.23.2025 each in 3 swings. Below X high, it favors downside in Y in 3 swings as it broke below 7.16.2025 low, expecting into extreme area. Within W, it ended ((a)) at 1.3523 low, ((b)) at 1.3620 high & ((c)) at 1.3362 low. Above there, it placed ((a)) at 1.3486 high, ((b)) at 1.3371 low & ((c)) as X connector at 1.3589 high. The double correction unfolds in 3-3-3 structure, which will complete, when current bounce fails below 7.23.2025 high to new low into extreme area. It ended ((a)) of Y into 0.618 – 0.764 Fibonacci extension area of W & expect 3 or 7 swings bounce in ((b)).
Below X high, it placed ((a)) of Y at 1.3305 low & favors bounce in ((b)) in 3 or 7 swings against 7.23.2025 high. Within ((a)), it ended (i) at 1.3528 low, (ii) at 1.3563 high, (iii) at 1.3413 low, (iv) at 1.3543 high & (v) at 1.3305 low. Above there, it favors bounce in (a) of ((b)) and expect small upside before it should pullback in (b). The next pullback in (b) should stay above 1.3305 low choppy price action before continue upside in (c). Ideally, ((b)) can bounce between 1.3413 – 1.3481 area as 0.382 – 0.618 Fibonacci retracement of ((a)) before continuing lower. Wave ((b)) bounce expect to fail below 1.3591 high before extending lower in ((c)) into 1.3162 – 1.2898 to finish double correction. Because of higher high in daily since September-2022 low, it should find buyers in extreme area to resume higher. It expects sideways to higher until FOMC event followed by selloff, while bounce fail below 7.23.2025 high. We like to buy the pullback into extreme area for next leg higher or at least 3 swings reaction.
GBPUSD - 31/7/25 - Bullish reversalThe setup is not great, but im expecting a pull back on the dollar which should result in a bullish move on the GBP and EUR.
There is an extreme zone that i would like price to reach to with the possibility of not taking out the previous HL. But lets see.
+ve:
1. Extreme zone that resulted in the bullish move.
2. slight imbalance above the extreme zone
3. Dollar setting up for a pull back that will result in a bullish move on GBP
4. TP is just above the equal high liquidity zone
-ve:
1. close to the higher low and that may be swept

Sells for the week
***Confluences-(Waiting for the restest)***
Head and Shoulders Broken at Higher Time Frame
Weekly, Daily, 4Hr all bearish
Broke a Key Weekly Level at 1.43000

Market Trap Alert! GBP/USD Bearish Robbery Plan🔥💸 "The Cable Heist" – GBP/USD Robbery Plan Using Thief Trading Style 💸🔥
— Unfiltered Forex Forecast with Risky Intentions —
🌍 Hey Money-Makers, Market Hustlers & Chart Bandits! 🤑✈️
Hola! Bonjour! Marhaba! Hallo! Ciao! Welcome to the Forex streets where the smart rob the charts, not banks.
Ready for the GBP/USD Heist? Let’s break it down with our infamous Thief Trading Style – raw, unapologetic, and built for profits.
💼 Operation Name: “The Cable Forex Bank Robbery”
🎯 Pair: GBP/USD – aka “The Cable”
⚔️ Style: Scalp / Day Trade / Swing Heist
📊 Bias: Short (Bearish Setup)
🛠 STRATEGY SETUP: "Follow the Shadows"
🔍 Analysis Basis:
Smart-Money Traps at Key Levels
Oversold ≠ Reversal (Read between the candles)
Liquidity Hunting Zones
Retail Stop Clusters Exposed
Thief-style DCA Entries (Staggered Entry Levels)
Multi-timeframe Confirmation
COT, Sentiment & News-Driven Volatility
🎯 ENTRY ZONE:
Enter short (sell) using 15M or 30M chart.
Sell Limits near recent highs (pullback zone).
DCA (Layered Entry) recommended – Thief loves catching price slipping.
Let the liquidity work for us.
🛑 STOP LOSS (SL):
Base SL around 1.34850 on 4H Chart – above swing high.
Adjust SL per position size and total entries.
Manage risk, but remember: thieves don’t panic, they plan!
🎯 TARGET ZONE:
TP near 1.32500 or adjust using price action.
Escape before target if market mood flips – no need to be greedy.
Trail SLs if market momentum dies down.
👀 Scalpers' Special Note:
Only SHORT — don’t mess with long side unless you’re a liquidity donor.
Quick ins & outs. If you're loaded with capital, jump in big – else follow the swing team.
Use trailing SLs for safety — protect the loot.
📢 FUNDAMENTALS TO WATCH:
News Impacting GBP/USD
COT Reports
Sentiment Indicators
Macro Trends / Yield Spreads
US Dollar Strength Index (DXY)
UK Economic Reports (CPI, GDP, Rate Decisions)
⚠️ RISK MANAGEMENT TIPS:
🚨 Avoid new entries during news releases
🚨 Use trailing stops during volatility spikes
🚨 Secure running trades before major announcements
🚀 Boost the Robbery – Support the Strategy
💖 Smash that BOOST BUTTON if you're vibing with this setup. Help the Thief crew grow stronger!
Let’s keep milking the market 💸 – one “heist” at a time. Stay dangerous, stay smart.
🔓 NOTE: This isn't investment advice. Just a wild trading idea from a chart outlaw.
Always DYOR – Do Your Own Robbery (Research).
Market conditions shift fast. Stay alert, adapt, and respect your capital.
#ForexThiefStyle #CableHeist #GBPUSDShort #SmartMoneyMoves #LiquidityHunters #ChartOutlaws #TradingRebels #DayTradeLife #ScalpersParadise #ForexGang #FXHeistPlans

GBPUSD: Can This Zone Hold the Line?Price has returned to a familiar shelf near 1.3410, previously acting as support.
We’re watching to see if bulls defend this zone or if price breaks through and pushes lower.
200 MA still above—short-term trend remains bearish
But structure shows potential for a bounce

GBPUSD Approaching Channel Support — Rebound Ahead?GBPUSD is nearing the bottom of a well-defined bearish channel while Stoch RSI begins to curl upward.
📌 Bearish channel structure intact
📌 Possible bounce off ~$1.322 zone
⏱️ Timeframe: 1H
#gbpusd #forex #tradingstrategy #channeltrading #technicalanalysis #quanttradingpro #tradingview

GBPUSD Bullish Trade- Spotted Valid Bullish Divergence on 1-H time frame
- Buy stop entry will be made when the bearish trend is overtaken by Bullish trend with the break of last LH
GBPUSD Wave Analysis – 28 July 2025
- GBPUSD broke support zone
- Likely fall to support level 1.3175
GBPUSD currency pair recently broke the support zone between the support level 1.3385 (which has been reversing the price from June) and the support trendline of the daily up channel from January.
The breakout of this support zone should accelerate the active intermediate impulse wave (1) from the start of July.
GBPUSD currency pair can be expected to fall to the next support level 1.3175 (former multi-month low from May, low of the earlier correction (4)).

GBP weakness + USD gaining bullish momentumFX:GBPUSD 🧠 What’s Driving GBP Weakness?
❄️ Cooling Inflation: Slows BoE policy tightening
🔻 Contracting Manufacturing: PMI deep in the red
🛍️ Falling Retail Sales: UK consumers are pulling back
💼 Labor Market Cracking: Recent jobs data may be peak
💣 BoE Dovish Pivot Incoming: Markets are anticipating future cuts in 2025
🇺🇸 USD Strength: Fed holding steady, US macro much stronger than UK
🧭 Extra Confluence: USD Strength
USD is being supported by:
Strong US labor market 🟢
Higher for longer Fed 🟢
Global risk-off sentiment 🟢
Positive divergence in US CPI and Retail Sales 🟢
📌 GBPUSD is not just a GBP short — it’s a USD long play too.
🧩 Historical Price Action Pattern
In 2023 Q3, GBP/USD dropped nearly 700 pips in 6 weeks during similar macro shifts — soft BoE + strong USD.
We may be setting up for a repeat pattern now.
🗣️ What’s Your Take?
Are you looking to short GBP/USD this month?
Where’s your target or trigger zone?
Let’s compare setups ⤵️
I’m sharing more breakdowns weekly — follow for macro + technical convergence trades.

Buy zone for GBP USDEasy buy on GBP_ Very good entry point after a massive rally,,, pull back zone.. and its a careful buy point

GBPUSD extends to the downside. Wait for retest to sell✏️ OANDA:GBPUSD confirms the downtrend by breaking the trendline. The downtrend is still extending to lower areas because the GBPUSD bearish wave structure is very beautiful. Some selling momentum appears around the breakout zone of 1.339, which will form a bearish structure towards the support of 1.287 in the near future. Putting faith in the trendline at the moment is reliable.
📉 Key Levels
SELL zone 1.339-1.341
SELL DCA trigger: Break and trading bellow 1.317
Target 1.287
Leave your comments on the idea. I am happy to read your views.

GBPusd short position31/07/2025English : According to our analysis, we anticipate a bearish scenario.
Morocan Darija : kanchofo d'apres l'analyse dyalna antsanaw hboot
ATENTION : I only share my ideas, not signals

My Trading Journal on GU 30.07.2025GBPUSD has reached a significant point of interest, showing a high level of accuracy with a Fair Value Gap on the higher time frame. This presents an excellent entry opportunity. Additionally, today is midweek, and there are high-impact events to consider. Keep an eye on it as the events unfold.
GBPUSD long position 01/08/2025English : According to our analysis, we anticipate a bullish scenario.
Morocan Darija : kanchofo d'apres l'analyse dyalna antsanaw tloo3
ATENTION : I only share my ideas, not signals

GBPUSD BUY with money mangemnt Analyzing market structure and liquidity using Price Action and Smart Money Concepts. Focuse
done on key supply/demand zones and institutional order flow

GBPUSDGBPUSD needs small correction and one more drop before upside.
Disclosure: We are part of Trade Nation's Influencer program and receive a monthly fee for using their TradingView charts in our analysis.

GBPUSD LongGBP/USD prices could potentially increase from the 1.3146 level within the Fair Value Gap (FVG) zone, with the next likely target being an upper FVG zone as a potential objective.

GBPUSD Outlook Week 21 Day 27CMCMARKETS:GBPUSD rejected at 1.375 to a low of 1.3375 and pulled back to a 50 percent retracement to the high of the week, 1.3575. To confirm whether the pair will continue to the upside, we have to wait to see it break 1.36250 and 1.375, otherwise we must also still wait for the low of the trend of 1.3375 to be broken before we can confirm a bearish trend
Overall bias is bearish.
Sell stop 1.33750 take profit 1.31250 (250 pips)
Buystop 1.36250 take profit 1.37500 (125 pips)
Disclaimer: Not a trading advice, please trade on demo
If you agree with my analysis, please give it a boost for others to see. If you disagree, share your opinion with me in the comment section

LOOKING FOWARD TO SHORT THIS WHAT'S YOUR OPINIONS This is not a financial advice its just an insight on what a market can print out based on the current data and stats any one can share in the comment section

GBPUSD IDEA The key is patience- from all the ideas, well wait for the clearest ones that give us confirmation... and then we jump in. lets goooooo
