Fundamental Market Analysis for June 11, 2025 GBPUSDThe GBP/USD pair continues to decline to around 1.34750 during Wednesday's Asian trading session. The pound sterling (GBP) is weakening against the US dollar (USD) due to a weaker UK employment report. Later on Wednesday, attention will shift to the US Consumer Price Index (CPI) for May.
The ILO unemployment rate in the UK rose to 4.6% in the three months to April from 4.5% previously, the British Office for National Statistics said on Tuesday. The figure was in line with expectations. Meanwhile, the change in the number of applicants for unemployment benefits in May was 33,100, compared with -21,200 previously (revised from 5,200), which is below the consensus of 9,500.
In addition, average earnings excluding bonuses in the UK rose 5.2% year-on-year (3M YoY) in April, compared with a revised 5.5% increase in the previous reading. The market forecast was 5.4%. Average earnings including bonuses rose 5.3% over the same period after accelerating to a revised 5.6% in the quarter to March. The data fell short of the forecast of 5.5%.
These figures indicate that the UK labor market is losing momentum under pressure from tax increases and the minimum wage hike by the government. This, in turn, may put some pressure on the pound sterling in the near term. “This gradual slowdown in wage growth may reassure the Bank of England after inflation unexpectedly jumped to its highest level in more than a year last month,” said Paige Tao, an economist at PwC UK.
Trading recommendation: SELL 1.34800, SL 1.35100, TP 1.34100
GBPUSD trade ideas

Correction The recent downtrend could end within the specified support levels and we could see the start of an uptrend. If the price breaks through the 100% level, a continuation of the downtrend is likely.

GBPUSD SHORT FORECAST Q2 W24 D11 Y25GBPUSD SHORT FORECAST Q2 W24 D11 Y25
Professional Risk Managers👋
Welcome back to another FRGNT chart update📈
Diving into some Forex setups using predominantly higher time frame order blocks alongside confirmation breaks of structure.
Let’s see what price action is telling us today!
💡Here are some trade confluences📝
✅Weekly order block
✅15' order block
✅Intraday 15' break of structure
✅Tokyo ranges to be filled
🔑 Remember, to participate in trading comes always with a degree of risk, therefore as professional risk managers it remains vital that we stick to our risk management plan as well as our trading strategies.
📈The rest, we leave to the balance of probabilities.
💡Fail to plan. Plan to fail.
🏆It has always been that simple.
❤️Good luck with your trading journey, I shall see you at the very top.
🎯Trade consistent, FRGNT X

GBPUSD SELL We have to get back to push from morning after that we can go higher , price has to take all the buyers from earlier
2.6RRR
GL TRADERS
NOT ADVICE !
Bearish drop off major resistance?Cable (GBP/USD) has reacted off the pivot which acts as an overlap resistance and could drop to the 1st support which is a pullback support.
Pivot: 1.3506
1st Support: 1.3423
1st Resistance: 1.3586
Risk Warning:
Trading Forex and CFDs carries a high level of risk to your capital and you should only trade with money you can afford to lose. Trading Forex and CFDs may not be suitable for all investors, so please ensure that you fully understand the risks involved and seek independent advice if necessary.
Disclaimer:
The above opinions given constitute general market commentary, and do not constitute the opinion or advice of IC Markets or any form of personal or investment advice.
Any opinions, news, research, analyses, prices, other information, or links to third-party sites contained on this website are provided on an "as-is" basis, are intended only to be informative, is not an advice nor a recommendation, nor research, or a record of our trading prices, or an offer of, or solicitation for a transaction in any financial instrument and thus should not be treated as such. The information provided does not involve any specific investment objectives, financial situation and needs of any specific person who may receive it. Please be aware, that past performance is not a reliable indicator of future performance and/or results. Past Performance or Forward-looking scenarios based upon the reasonable beliefs of the third-party provider are not a guarantee of future performance. Actual results may differ materially from those anticipated in forward-looking or past performance statements. IC Markets makes no representation or warranty and assumes no liability as to the accuracy or completeness of the information provided, nor any loss arising from any investment based on a recommendation, forecast or any information supplied by any third-party.

GBP-USD Bearish Breakout! Sell!
Hello,Traders!
GBP-USD made a bearish
Breakout of the rising support
Which is a resistance now and
The breakout is confirmed
So we are bearish biased
And we will be expecting
A further bearish move down
Sell!
Comment and subscribe to help us grow!
Check out other forecasts below too!
Disclosure: I am part of Trade Nation's Influencer program and receive a monthly fee for using their TradingView charts in my analysis.

GBPUSD ANALYSISAfter seeing the previous daily candle close bearish and below support, we could expect the move to continue since the 4hr also has structural type move pushing to the downside


GBPUSDGBPUSD Swept Liquidity from swing high whil showing divergence on the macd.
we are waiting for 1hour bearish correction to sell at the breakout.

LONDON BREAKOUTLondon Breakout Strategy – GBP/USD (June 9)
Today’s setup follows the same logic: I marked the high and low between 04:00 to 06:00 UTC to define the pre-London range. Once the London session opened and bearish momentum appeared, I took a sell trade.
Entry (Sell): 1.34820 – Entered as price broke below the early range with momentum.
Stop Loss (SL): 1.35462 – Placed just above the high of the 4–6 UTC range.
Take Profit (TP): 1.33855 – Based on a 1.5x reward relative to the stop-loss distance.
This strategy is designed to capture London session breakouts with a clear structure and defined risk.
Feel free to comment and share your ideas...

Potential bearish breakout?GBP/USD is reacting off the support level which is an overlap support that aligns with the 38.2% Fibonacci retracement and could drop from this level to our take profit.
Entry: 1.3501
Why we like it:
There is an overlap support level that lines up with the 38.2% Fibonacci retracement.
Stop loss: 1.3535
Why we like it:
There is an overlap resistance level that lines up with the 61.8% Fibonacci retracement.
Take profit: 1.3450
Why we like it:
There is a pullback support level.
Enjoying your TradingView experience? Review us!
Please be advised that the information presented on TradingView is provided to Vantage (‘Vantage Global Limited’, ‘we’) by a third-party provider (‘Everest Fortune Group’). Please be reminded that you are solely responsible for the trading decisions on your account. There is a very high degree of risk involved in trading. Any information and/or content is intended entirely for research, educational and informational purposes only and does not constitute investment or consultation advice or investment strategy. The information is not tailored to the investment needs of any specific person and therefore does not involve a consideration of any of the investment objectives, financial situation or needs of any viewer that may receive it. Kindly also note that past performance is not a reliable indicator of future results. Actual results may differ materially from those anticipated in forward-looking or past performance statements. We assume no liability as to the accuracy or completeness of any of the information and/or content provided herein and the Company cannot be held responsible for any omission, mistake nor for any loss or damage including without limitation to any loss of profit which may arise from reliance on any information supplied by Everest Fortune Group.

GBP/USD eases off highs again after poor UK dataAfter an initial tumble to just shy of 1.3450 in response to this morning’s disappointing UK jobs and wages print, the pound staged a spirited recovery, climbing back to a high of 1.3536. However, that rebound appears to be fading, with sterling once again drifting lower as the US dollar finds its footing across the board.
The underwhelming labour market data has bolstered expectations for a Bank of England rate cut in August, with a second move potentially on the cards in November, should incoming data allow. With rate cut probabilities on the rise, the pound’s four-month rally could be running out of steam.
June remains in positive territory for GBP/USD, which raises the prospect of a fifth consecutive monthly gain. But that run may be living on borrowed time. Any further deterioration in UK data—or even a modest pick-up in risk appetite favouring the dollar—could well tip the scales back in favour of the greenback.
From a technical standpoint, cable is beginning to look somewhat top-heavy. The key support zone between 1.3430 and 1.3450 has held up thus far, but a clean break below this region would mark a bearish shift in sentiment. Should that occur, a retreat towards the low 1.30s could swiftly come back into play.
By Fawad Razaqzada, market analyst with FOREX.com

GBPUSD – Holding the Uptrend, Eyeing Resistance BreakoutThe GBPUSD pair continues to respect a well-defined ascending channel on the H4 chart. Each time price retraces to the lower boundary, buying pressure has consistently stepped in. Currently, price is hovering near the channel’s lower edge and the EMA89 – forming a technical support area around 1.35370. If this zone holds, there is a strong potential for a rebound toward the resistance zone near 1.36100–1.36300, which has rejected price twice before.
From a news perspective, markets are awaiting the U.S. CPI report tomorrow. If inflation data comes in weaker, expectations for the Fed to cut interest rates will increase, putting pressure on the USD and allowing GBP to extend gains. Additionally, the Bank of England is expected to maintain a more hawkish stance due to persistent domestic inflation – which further supports the pound’s upward momentum.
Watching the EMA and lower channel boundary is key. If a clear bullish signal forms at this zone, a trend-following long strategy could carry a high probability of success.

GBPUSD stuck in a tight range - Waiting for the final moveGBPUSD stuck in a tight range - Waiting for the final move
On Thursday, GBPUSD tested 1.3590 again and briefly reached 1.3615, but the bullish attempt failed. The price dropped back below the resistance zone.
For almost two weeks, GBPUSD has been moving up and down in this area. No major economic events are expected this week.
However, US and China officials will meet in London on Monday, June 9. Optimism for a deal is high, and this could push GBPUSD lower from this zone.
Bearish targets: 1.3425, 1.3350, 1.3250, 1.3170.
⚠️ Watch out! This pair is heavily influenced by news.
You may find more details in the chart!
Thank you and Good Luck!
❤️PS: Ple ase support with a like or comment if you find this analysis useful for your trading day❤️
Disclosure: I am part of Trade Nation's Influencer program and receive a monthly fee for using their TradingView charts in my analysis.

DeGRAM | GBPUSD broke the channel📊 Technical Analysis
● Pullback stalled exactly on the purple trend-support (≈1.348) and the channel mid-line after a false break of the upper wedge, preserving the sequence of higher-lows since May.
● Price is basing inside the 1.337-1.353 support strip; reclaim of 1.3530 would invalidate the bearish trap and open the next channel-median / April swing at 1.3590, while the lower rail at 1.3250 guards the up-trend.
💡 Fundamental Analysis
● UK April wage growth held at 5.7 % y/y, keeping BoE tightening bias alive, while softer US CPI expectations cool Treasury yields—narrowing the rate gap and underpinning sterling.
✨ Summary
Long 1.337-1.348; confirmation above 1.353 targets 1.3590, stretch 1.3700. View void on an H4 close below 1.3250.
-------------------
Share your opinion in the comments and support the idea with a like. Thanks for your support!

GBP SLIDES AS UK LABOR DATA MISS FUELS DOVISH BOE BETSEarlier today, the UK’s Claimant Count Change (jobless claim) i.e. the number of people in the UK claiming unemployment related benefits for the month of May was released with a whopping 33.1k against 9.5k projection and average earnings index plus bonus witnessed a decline to 5.3% against 5.5% forecast.
Today’s disappointing UK labor market report prompted a notable shift in market expectations for Bank of England policy. Following the release of the weaker-than-expected jobs data, traders are now pricing in a more dovish path ahead, anticipating around 48 basis points of rate cuts by the end of the year as against 38bps before the data release.
In the wake of the weak data, GBP tanked across board and GBPUSD wasn’t left out.
TECHNICAL VIEW OF GBPUSD AND POTENTIAL TARGET AS PER ANALYST
From the technical perceptive, the GU on the 2H closed below the 50 EMA and is seen supported around the trendline at 1.3467 as evident on the chart.
With the formation of H&S pattern and a clear break of the neckline at 1.3503, it hints that sellers are still dominant. While waiting for the next catalyst. If buyers step in and GU retraces, analyst expects potential target towards 1.3562 and a break above this would usher in the next resistance around 1.3610. On the flip side, if the bearish momentum continues, analysts envisage potential target towards 1.3418 and further decline would usher in 1.3334.
Meanwhile, further break out of these levels are not ruled out.
UPCOMING CATALYST
On the radar, markets await U.S CPI and core CPI tomorrow. On Thursday, UK GDP and U.S PPI and core PPI would be on the wire. To wrap up the week, U.S consumer sentiment and inflation expectation would be the focus on Friday.
These data points have the tendency to cause market volatility in the coming days.

GBPUSD: Intraday Bullish Reversal📉GBPUSD pair approached a significant horizontal resistance last week.
The price formed a clear head and shoulders pattern, then rebounded and broke below a strong rising trend line.
This indicates considerable selling strength, suggesting that the market may continue to decline.
The next target is 1.3453.

GBPUSDSelll. Market Execution. trade 1:2. risk 0.50%
We entered Sell because the market is respecting the sellers' zone.


GBPUSD SHORT FORECAST Q2 W24 D10 Y25GBPUSD SHORT FORECAST Q2 W24 D10 Y25
Professional Risk Managers👋
Welcome back to another FRGNT chart update📈
Diving into some Forex setups using predominantly higher time frame order blocks alongside confirmation breaks of structure.
Let’s see what price action is telling us today!
💡Here are some trade confluences📝
✅Weekly order block
✅15' order block
✅Intraday 15' break of structure
✅Tokyo ranges to be filled
🔑 Remember, to participate in trading comes always with a degree of risk, therefore as professional risk managers it remains vital that we stick to our risk management plan as well as our trading strategies.
📈The rest, we leave to the balance of probabilities.
💡Fail to plan. Plan to fail.
🏆It has always been that simple.
❤️Good luck with your trading journey, I shall see you at the very top.
🎯Trade consistent, FRGNT X

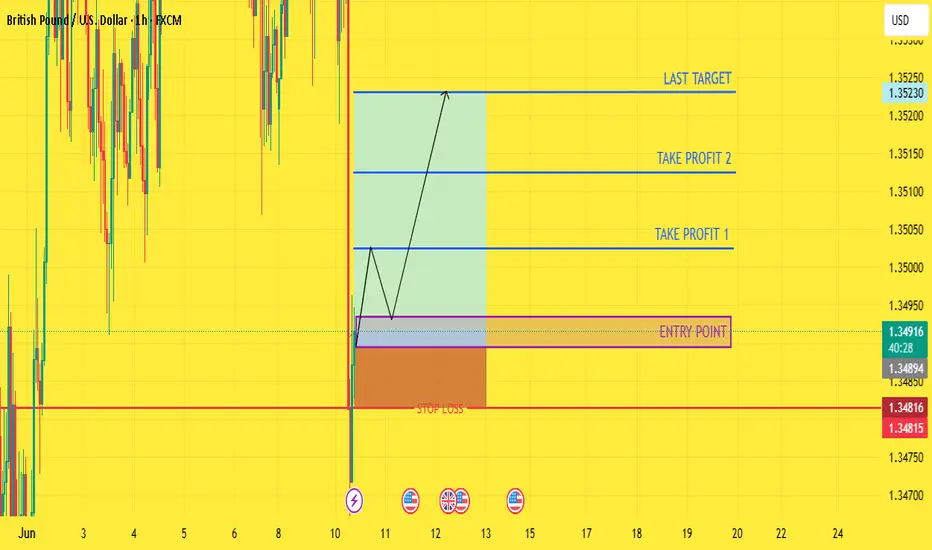
CHECK GBPUSD SIGNAL READ CAPTAIN(GBPUSD) trading signals technical analysis satup👇🏼
( GBPUSD ) BUY zone
( TRADE SATUP)
ENTRY POINT (1.34895 to (1.34935) 📊
FIRST TP (1.35025)📊
2ND TARGET (1.35125) 📊
LAST TARGET (1.35230) 📊
STOP LOOS (1.34815)❌
Tachincal analysis satup
Fallow risk management
GBPUSD to the downsideClassic overbought condition. In addition to the positive US data last week, expect a drop lower for GBPUSD
Safe trading.

GBPUSD Is Very Bearish! Short!
Please, check our technical outlook for GBPUSD.
Time Frame: 3h
Current Trend: Bearish
Sentiment: Overbought (based on 7-period RSI)
Forecast: Bearish
The price is testing a key resistance 1.355.
Taking into consideration the current market trend & overbought RSI, chances will be high to see a bearish movement to the downside at least to 1.350 level.
P.S
Overbought describes a period of time where there has been a significant and consistent upward move in price over a period of time without much pullback.
Disclosure: I am part of Trade Nation's Influencer program and receive a monthly fee for using their TradingView charts in my analysis.
Like and subscribe and comment my ideas if you enjoy them!
