GBP/USD | Supply Zone Holding – Major Drop Incoming?Price is now inside a key institutional supply zone (1.35400 area)
🔵 This zone has previously led to strong rejections – and it’s holding again.
📉 Bearish bias remains valid as long as price trades below this zone.
---
🎯 Potential Targets:
🟦 TP1: 1.28451 – Previous support zone
🟧 TP2: 1.24701 – Demand imbalance
🟨 TP3: 1.21693 – Major unfilled demand + price memory
---
🔍 What Smart Money Sees:
✔️ Liquidity above previous highs has been swept
✔️ Price now compressing under resistance = Possible redistribution
✔️ No new higher high = Weakness confirmation
---
📅 What’s Coming:
🇬🇧 GBP news event marked on the chart could trigger volatility – watch closely for fakeouts or confirmations!
---
✅ Trade Plan:
❌ No buys inside the supply zone
🔻 Look for bearish structure break + pullback entry
🔐 SL above 1.3560 wick trap
---
💬 What’s your take on this setup?
🟢 Breakout or 🔴 Breakdown?
👇 Drop your bias in the comments.
❤️ Like & 🔁 Share if you caught the last drop from this zone!
#GBPUSD #SmartMoney #LuxAlgo #SupplyAndDemand #ForexSignals #PriceAction #LiquiditySweep #InstitutionalTrading #ForexTradingView #GBPSetup
GBPUSD trade ideas

GBPUSD Sell analysis/ideaThis trade/analysis is based on the Daily and 4-hour timeframes and executed using reversal trading and trend formation. Complete explanation in the video!

Market Insights with Gary Thomson: 9 - 13 JuneMarket Insights with Gary Thomson: UK Unemployment & GDP, US Inflation & PPI, Earnings Reports
In this video, we’ll explore the key economic events, market trends, and corporate news shaping the financial landscape. Get ready for expert insights into forex, commodities, and stocks to help you navigate the week ahead. Let’s dive in!
In this episode, we discuss:
— UK Unemployment Rate
— US Inflation Rate
— UK GDP Growth Rate
— US Producer Price Index
— Corporate Earnings Statements
Don’t miss out—gain insights to stay ahead in your trading journey.
This video represents the opinion of the Companies operating under the FXOpen brand only. It is not to be construed as an offer, solicitation, or recommendation with respect to products and services provided by the Companies operating under the FXOpen brand, nor is it to be considered financial advice.

BULLISH A market break of structure occurred on the H1 indicating a buy. It jus got to a strong support to push the price up. The trend is still bullish.

Analysis of Trades and Trading Tips for the British PoundThe price test at 1.3535 in the second half of the day occurred just as the RSI indicator was beginning to move downward from the zero line. This confirmed the correct entry point for selling the pound, resulting in a decline of more than 30 pips.
U.S economic indicators published on Friday sparked a wave of optimism across financial markets. Non-farm employment showed confident growth, surpassing economists' forecasts and reaching 139,000 new jobs, while market expectations hovered around 127,000. This factor immediately impacted currency rates. prompting the U.S. dollar to strengthen against major world currencies, particularly the British pound. The unemployment rate, remaining stable at 4.2%, also added to the positive sentiment. A low unemployment rate indicates the U.S. economy's healthy state and stable labor demand. This provides a favorable backdrop for continued economic growth and strengthens the dollar's position. The British pound's reaction to this news was expected - a decline against the U.S dollar. investors, assessing U.S. economic prospects as more favorable, redirected their capital, increasing demand for the dollar and decreasing demand for the pound sterling.
Today, there is no economic data from the UK, so it possible that after Friday's pullback, pound buyers may continue to act within the bullish market framework, betting on further growth in the GBP/USD pair. The absence of fresh economic data leaves room for speculation and allows traders to rely on already-established trends. However, existing risks should not be forgotten, Global economic uncertainty due to U.S. tariffs could exert pressure on the British currency at any moment.

GBPUSD [Possible longsHere' how I'm watching GBPUSD for a potential buy trade. I reckon the buy would hold, although I'd be risking 0.5% of my equity because we didn't see the market take out previous high with deliberate candle closes, and that could mean that there are sellers lurking somewhere around.
However, until the sell is confirmed, the trend is our friend.
DYOR

09/06/2025: WILL WE SEE A BREAKOUT ABOVE 1.3550?GBP/USD PLAN – 09/06/2025: WILL WE SEE A BREAKOUT ABOVE 1.3550?
🌍 Macroeconomic & Fundamental Context:
UK Economic Outlook (BoE): The Bank of England (BoE) is under pressure due to inflation and has to make decisions regarding interest rate policy. Diverging opinions on whether to raise or lower rates are creating uncertainty in the market.
US Economic Outlook (Fed): The Federal Reserve's monetary policy continues to be a major influence on the USD, especially as the Fed maintains its rate hikes to control inflation.
US-UK Trade Relations: Trade negotiations between the US and the UK will remain an important factor this week, and any new developments could impact GBP/USD.
📉 Technical Analysis – GBP/USD:
On the H4 and H1 timeframes, GBP/USD is consolidating within a corrective structure, and price has broken several key Fibonacci levels. The EMA indicators (13, 34, 89) are showing strong momentum.
Key Resistance Levels:
1.3550 – This is a major resistance level. If broken, GBP/USD could continue its rally towards 1.3612.
Key Support Levels:
1.3520 – A short-term support level. If this breaks, price may retrace back to 1.3470.
🎯 Trading Scenarios for Today:
🟢 BUY ZONE:
Buy Zone: 1.3520 – 1.3500
SL: 1.3480
TP: 1.3550 → 1.3570 → 1.3600 → 1.3620 → 1.3650
If price retraces to 1.3520 – 1.3500, this would be an ideal buying opportunity with a target at 1.3550. Look for confirmation from technical indicators and the current trend.
🔴 SELL ZONE:
Sell Zone: 1.3550 – 1.3570
SL: 1.3590
TP: 1.3520 → 1.3500 → 1.3470 → 1.3450 → 1.3420
If price reaches the resistance zone of 1.3550 – 1.3570, consider selling with targets at the support levels below.
🟡 Scalping:
Buy Scalping: 1.3520 → 1.3500
Sell Scalping: 1.3570 → 1.3600
Look for short-term opportunities when price moves within the range.
⚠️ Important Notes:
Pay close attention to short-term fluctuations and any major economic data releases from the BoE and Fed.
Risk management is key during volatile periods.
📌 Conclusion:
GBP/USD is in a short-term corrective phase, but a breakout above 1.3550 could trigger a strong rally. Traders should monitor support and resistance levels carefully and ensure risk management is in place.

GBPUSDGBP/USD 10-Year Bond Yield, Interest Rate Differential, Carry Trade, and Uncovered Interest Rate Parity
1.the current 10-Year Bond Yields or UK 10-Year Gilt Yield: 4.63% (as of June 9, 2025), down slightly from recent highs but elevated due to persistent inflation concerns,while the US 10-Year Treasury Yield stands at 4.50% (as of June 9, 2025), reflecting fiscal uncertainties and moderated Fed rate cut expectations.
2.the Interest Rate Differential will be The 10-year yield spread (UK minus US) ,which is +0.13% (4.63% – 4.50%), favoring UK gilts.
The policy rate differential (BoE: 4.25%, Fed: 4.25–4.50%) is neutral to slightly negative for GBP, as the Fed holds rates steady while the BoE recently cut.
3. Carry Trade Implications
The modest yield spread provides a limited carry trade advantage for GBP over USD. Investors borrowing in USD to buy GBP assets gain a small yield pickup (~0.13%), but this is offset by:
Currency risk: GBP/USD volatility.
Economic uncertainty: UK inflation (3.5% y/y) remains sticky, while US growth and fiscal risks dominate.
4. Uncovered Interest Rate Parity (UIP)
UIP predicts the GBP should depreciate against USD by ~0.13% annually to offset the higher UK yield. However, deviations are common due to:
Risk premiums: Safe-haven USD demand during global uncertainty.
Diverging central bank policies: BoE’s recent rate cut vs. Fed’s cautious stance.
Inflation dynamics: UK CPI (3.5%) exceeds US forecasts (2.5%), pressuring BoE to maintain tighter policy despite cuts.
Key Data: UK services PMI (June 13) and US CPI (June 11) will dictate near-term momentum. A stronger US CPI print could widen the rate differential in favor of USD, pressuring GBP.
stay cautious .
#gbpusd

SHORT ON GBP/USDGBP/USD has just broken a uptrend line and has given us a nice break and retest to that same trendline.
The bearish have shown up and the dollar is currently looking bullish
I will be selling GBP/USD to the next level of demand for 50-80 pips

GBPUSD Sell- Go for sell if setup given then manage your trade
- potentially go lower
- Refine entry with smaller SL for better RR, if your strategy allow
A Message To Traders:
I’ll be sharing high-quality trade setups for a period time. No bullshit, no fluff, no complicated nonsense — just real, actionable forecast the algorithm is executing. If you’re struggling with trading and desperate for better results, follow my posts closely.
Check out my previously posted setups and forecasts — you’ll be amazed by the high accuracy of the results.
"I Found the Code. I Trust the Algo. Believe Me, That’s It."

GBPUSD Edges HigherGBPUSD Edges Higher
GBP/USD is attempting a fresh increase above the 1.3500 resistance.
Important Takeaways for GBP/USD Analysis Today
- The British Pound is attempting a fresh increase above 1.3515.
- There was a break above a key bearish trend line with resistance at 1.3535 on the hourly chart of GBP/USD at FXOpen.
GBP/USD Technical Analysis
On the hourly chart of GBP/USD at FXOpen, the pair declined after it failed to clear the 1.3615 resistance. The British Pound even traded below the 1.3575 support against the US Dollar.
Finally, the pair tested the 1.3500 zone and is currently attempting a fresh increase. The bulls were able to push the pair above the 50-hour simple moving average and 1.3540. There was a break above a key bearish trend line with resistance at 1.3535.
The pair tested the 50% Fib retracement level of the downward move from the 1.3616 swing high to the 1.3507 low. It is now showing positive signs above 1.3540.
On the upside, the GBP/USD chart indicates that the pair is facing resistance near 1.3575 and the 61.8% Fib retracement level of the downward move from the 1.3616 swing high to the 1.3507 low.
The next major resistance is near 1.3590. A close above the 1.3590 resistance zone could open the doors for a move toward 1.3615. Any more gains might send GBP/USD toward 1.3650.
On the downside, immediate support is near the 1.3515. If there is a downside break below 1.3515, the pair could accelerate lower. The first major support is near the 1.3500 level. The next key support is seen near 1.3450, below which the pair could test 1.3420. Any more losses could lead the pair toward the 1.3350 support.
This article represents the opinion of the Companies operating under the FXOpen brand only. It is not to be construed as an offer, solicitation, or recommendation with respect to products and services provided by the Companies operating under the FXOpen brand, nor is it to be considered financial advice.

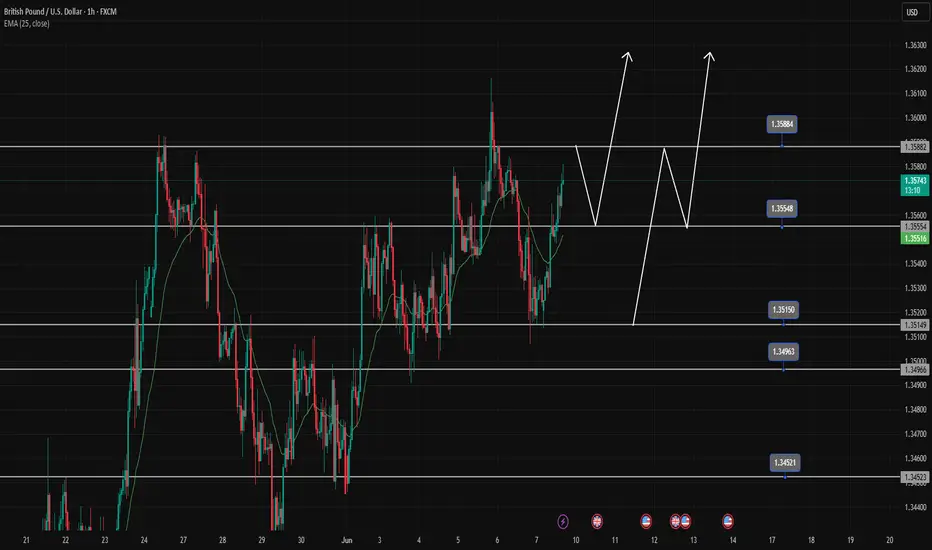
Buy opportunity when price retraces to break the topGBPUSD encounters resistance at 1.358, there is a high possibility that there will be a price reaction to 1.35500 to create a Dow break 1.358 towards higher levels.
GBPUSD is increasing very strongly again in the main trend, we wait for a retracement to the support zones, which is a strong buying opportunity.
1.358-1.355-1.351-1.345 are BUY zones when the price has a reaction of buying force at these price zones.
GBPUSD BULLISH OR BEARISH DETAILED ANALYSISGBPUSD is showing strong bullish momentum after successfully bouncing off the key support zone around 1.34300. This level, which previously acted as a major resistance, has now flipped into solid support, confirming a classic breakout-retest structure. With the daily chart printing higher highs and higher lows, the market is clearly building a bullish continuation structure. Price action above this level signals that the bulls are gaining confidence, and we are now setting up for a clean run toward the 1.38000 target in the coming sessions.
Fundamentally, the British pound is currently benefitting from improved economic sentiment in the UK. With services PMI holding firm and inflation slowly coming under control, there’s growing speculation that the Bank of England could maintain a more hawkish stance compared to the Fed. Meanwhile, the US dollar is facing pressure due to softer labor data and increased expectations for a potential rate cut later this year. This divergence between the BoE and Fed is creating a favorable environment for GBP strength against USD.
From a technical perspective, the bounce off support is being validated with strong bullish candlesticks and momentum continuation. The market structure remains intact with a bullish trendline, and Fibonacci confluence levels are lining up perfectly to support higher price objectives. The nearest resistance sits just under 1.36000, and a break above that would likely trigger accelerated buying pressure toward the 1.38000 handle. Traders watching for trend continuation setups will find this level highly attractive.
GBPUSD is preparing for another bullish wave, and this structure remains one of the cleaner technical patterns in the majors right now. As long as the pair holds above 1.34300, the bias remains bullish with potential for extended gains. Monitor DXY and Fed rate sentiment closely, but with current fundamentals aligning with technicals, this setup is shaping up to be a high-probability bullish continuation.

a lower move expected after liquidity raidMonday should seek liquidity higher from previous sessions then a move lower will be expected. this is also seen by the dollar move lower first to go higher

Sell GBPUSDGBPUSD may fall from this area judging from the current trend and movement of price within this rising channel. Overall, this pair is bullish, this is only a pull back trade before the bulls resume next week.

GBP/USD – 1H Chart Pattern: Bullish Momentum AB=CD GBP/USD – 1H Chart
Pattern: Bullish AB=CD
Trend: Bullish Momentum Detected
🔹 Entry (EP): Instant Buy @ 1.35694
🔹 Stop Loss (SL): 1.35004
🔹 Take Profit (TP1): 1.36352
🔹 Take Profit (TP2): — (Trail if desired or wait for new structure)
🔹 Lot Size: 0.14
🔹 Risk/Reward Ratio: 1:1
🔹 Risk: $100 💸
🔹 Reward: $100 💰
📊 The AB=CD harmonic pattern confirms a potential bullish reversal zone, and price action aligns with this projection on the 1H chart. Clean setup for short-term intraday traders.
⚠️ As always, manage risk properly and adjust your strategy based on market conditions.
#GBPUSD #ForexTrading #PriceAction #HarmonicPattern #TradingSetup #ForexSignals #TechnicalAnalysis #ABCDPattern #1HRChart #RiskReward #BullishSetup
