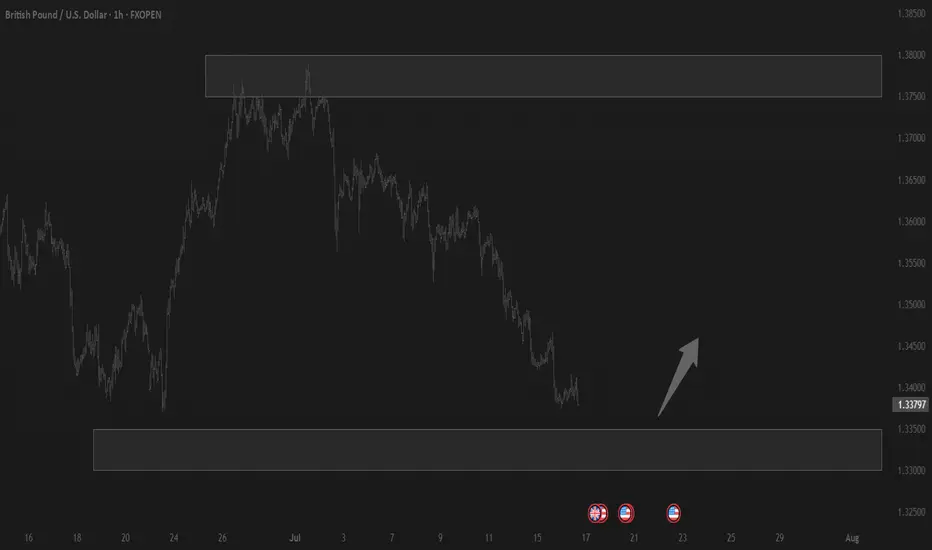
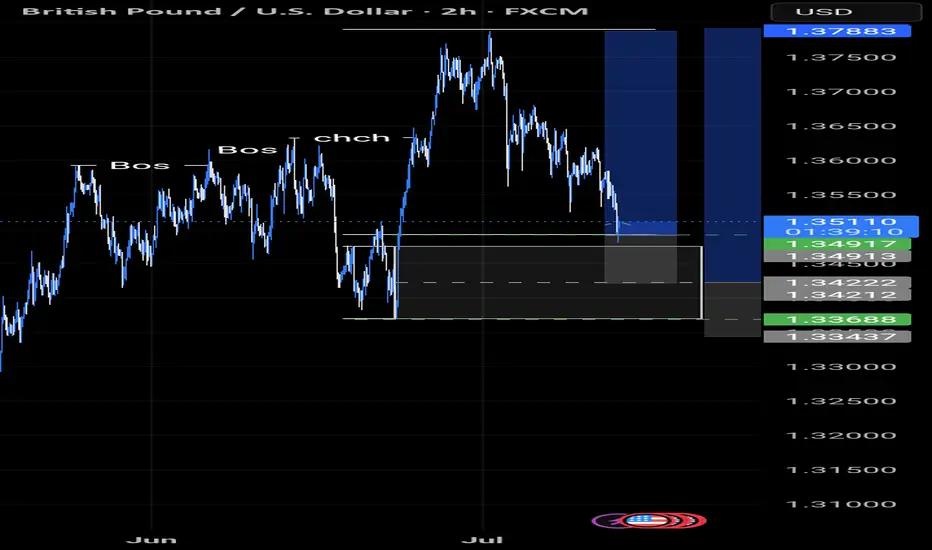
GBP_USD RISING SUPPORT AHEAD|LONG|
✅GBP_USD is going down now
But a strong rising support level is ahead
Thus I am expecting a rebound
And a move up towards the target of 1.3600
LONG🚀
✅Like and subscribe to never miss a new idea!✅
Disclosure: I am part of Trade Nation's Influencer program and receive a monthly fee for using their TradingView charts in my analysis.
GBPUSD trade ideas

Trading balanceTrading balance The price of the asset has rebounded from the balance zone. With the prospect of growth into the resistance zone.
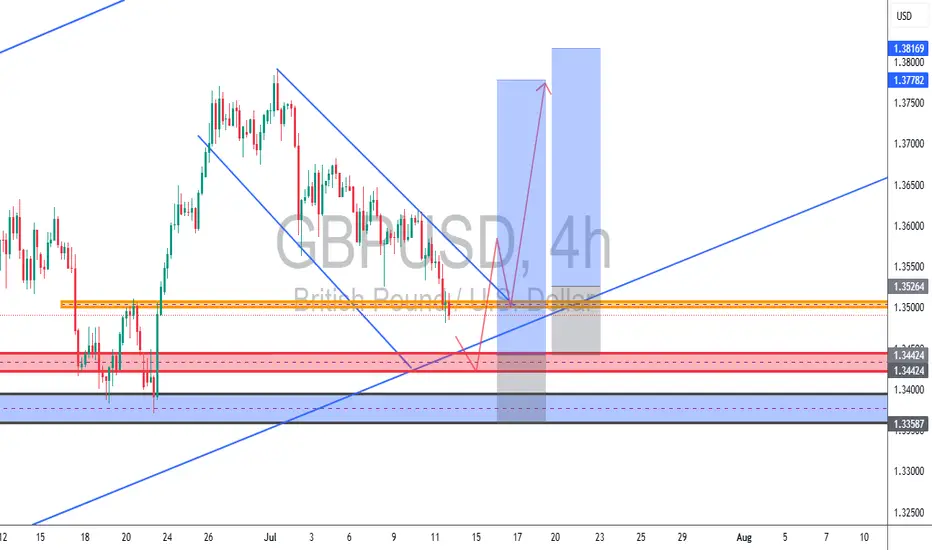
GBPUSD – Countertrend Wedge Setup Near Key Demand (TCB Strategy📈 GBPUSD – Countertrend Wedge Setup Near Key Demand (TCB Strategy Setup in Progress)
Timeframe: 4H
Strategy Phase: ✅ Countertrend Phase (Falling Wedge + Liquidity Sweep Potential)
🔍 Analysis:
GBPUSD is currently forming a falling wedge correction within a higher-timeframe bullish trend. Price is approaching a major confluence zone between 1.3442 and 1.3358, which includes:
Stacked demand zones (HTF support)
A rising trendline from the previous bullish leg
The wedge’s lower boundary
Potential liquidity pockets below recent lows
If price sweeps the zone and gives a bullish engulfing or reversal candle, this would trigger a TCB Countertrend entry targeting a breakout and continuation to the upside.
📌 Watchlist Trade Setup:
Entry Zone: 1.3442 – 1.3358 (awaiting confirmation)
Stop Loss: Below 1.3358
Take Profit 1: 1.3526
Take Profit 2: 1.3778
Take Profit 3 (extended): 1.3816
Risk-to-Reward: Potential 1:3 – 1:4+
📋 TCB Strategy Confluences:
Falling Wedge Structure ✅
Demand Zone Support ✅
Trendline Support ✅
Liquidity Trap Potential ✅
Clean Structure to TP ✅
🧠 Waiting for:
Bullish candle confirmation (engulfing/pin bar)
Breakout of wedge or sweep-reversal scenario
Final check for news before entry
📚 Strategy: TCB (Trend – Countertrend – Breakout)
Looking for clean, high-RR reversals from structure with momentum confirmation.
#GBPUSD #Forex #TCB #Breakout #Trend #Countertrend #ForexTrading #TradeSetup #TechnicalAnalysis
GBPUSD set for a move lower?Table is set! The GBPUSD is in a rising wedge, with the test (today) of the 61.8% Fibonacci level once again and now ascending wedge support and horizontal support as well. A break of the 1.3530 would put the 1.3440 breakout point (high from Sept 2024) and a possible breakdown back below the 1.3370 level. Bulls should be cautious with this technical setup.

GBP/USD: Path to 1.3200 on Policy DivergenceThis trade idea outlines a high-conviction bearish thesis for GBP/USD. The core of this analysis is a significant and growing divergence between the fundamental outlooks of the UK and US economies, which is now being confirmed by a bearish technical structure. We anticipate the upcoming UK economic data releases during the week of July 14-18 to act as a catalyst for the next leg down.
The Fundamental Why 📰
The primary driver for this trade is the widening policy and economic divergence. The UK is facing a triad of headwinds while the US economy exhibits greater resilience. This fundamental imbalance favors the US Dollar and is expected to intensify.
Dovish Bank of England: The BoE is clearly signaling a dovish pivot towards monetary easing in response to a weakening labor market and sluggish growth prospects. This contrasts with the Federal Reserve's more patient, data-dependent stance.
Widening Rate Differentials: The divergence in central bank policy is leading to a widening interest rate differential that favors the US Dollar.
Geopolitical Headwinds: Fiscal policy from the new UK government and ongoing trade tensions are creating additional headwinds for the Pound.
The Technical Picture 📊
Price action provides strong confirmation of the bearish fundamental thesis, showing a clear loss of upward momentum and the formation of a new downtrend.
📉 Death Cross: The 50-day moving average has crossed below the 200-day moving average, forming a "death cross," which is a strong bearish indicator.
📉 Key Level Lost: The price has recently broken and is holding below the critical 200-day moving average, a classic bearish signal.
📉 Bearish Momentum: Both the RSI (below 50) and the MACD (below its signal line and zero) indicate that bearish momentum is in control.
The Trade Setup 📉
👉 Entry: 1.3540 - 1.3610
🎯 Take Profit: 1.3200
⛔️ Stop Loss: 1.3665


GBPUSD SHORTWe have a break of structure. we waiting for a fair value gap on lower time frame in order to sell to those zone. lets wait and see how it goes

GBPUSD SELL SETUPTimeframe: 4H
Current Price Area: 1.3485
Price Structure: Bearish trend → possible reversal zone
Tools Used: LuxAlgo SMC, Market Structure Breaks (BOS), Supply & Demand zones, Liquidity zones, and internal trendlines
🔧 Structure Breakdown
🟥 1. Break of Structure (BOS) at the top:
There was a bullish BOS earlier (left side of chart), but now the structure shifted bearish.
A clear trendline channel formed as price moved down — showing controlled selling (a descending wedge).
🔻 2. Supply Zone at the top:
Marked in red box — this represents the last bearish order block before the sharp move down.
Acts as a strong supply or re-entry point for sellers if price retraces back.
🔺 3. Current Price at Demand Zone (Reversal Area):
Price is currently sitting inside a demand zone (highlighted in orange + blue).
This zone aligns with previous inefficiency (fair value gap) and a strong low at 1.3451, suggesting a possible buy opportunity for a retracement or reversal.
🧱 4. Strong High / Weak High Logic:
The chart marks a strong high (protected by supply), and a weak high at the top that could be targeted later if bullish continuation happens.
This implies the short-term goal is to grab liquidity from sell-side traders and reverse toward the weak high.
🎯 Entry Logic & Trade Setup
Entry:
Around current demand zone (1.3450–1.3480) after price showed reaction/wick rejection.
Stop Loss (SL):
Just below the strong low (~1.3371) to protect against deep sweep/liquidity grab.
Target 1 (TP1):
Return to supply zone or imbalance area near 1.3507–1.3580.
Target 2 (TP2):
A more aggressive target would be a run toward the weak high (~1.3661).
📉 Bearish Possibility?
If price fails to hold this demand zone and closes strongly below 1.3450 → it would break the strong low → bearish continuation becomes likely.
That would invalidate this reversal and re-open downside targets.

USD Strengthens Against GBP With New Tariff AnnouncementsThis is the Weekly FOREX Forecast for the week of July 14 - 18th.
In this video, we will analyze the following FX market: GBPUSD
The latest headlines tell the story. The tariffs are triggering a slow run to the USD safe haven. The previous week showed the USD Index closed pretty strong, while GBPUSD weakened.
There's a good chance we'll see more of the same this coming week.
Look for the strength in USD to continue to be supported by fundamental news, and outperform the other major currencies, including the GBP.
Buy USD/xxx
Sell xxx/USD
Enjoy!
May profits be upon you.
Leave any questions or comments in the comment section.
I appreciate any feedback from my viewers!
Like and/or subscribe if you want more accurate analysis.
Thank you so much!
Disclaimer:
I do not provide personal investment advice and I am not a qualified licensed investment advisor.
All information found here, including any ideas, opinions, views, predictions, forecasts, commentaries, suggestions, expressed or implied herein, are for informational, entertainment or educational purposes only and should not be construed as personal investment advice. While the information provided is believed to be accurate, it may include errors or inaccuracies.
I will not and cannot be held liable for any actions you take as a result of anything you read here.
Conduct your own due diligence, or consult a licensed financial advisor or broker before making any and all investment decisions. Any investments, trades, speculations, or decisions made on the basis of any information found on this channel, expressed or implied herein, are committed at your own risk, financial or otherwise.

GBPUSD – Classic FRL setup unfoldingWe have a clear descending channel (wedge) on H1, with the price testing the neckline level after a corrective consolidation.
According to Fractal Reversal Law (FRL):
The neckline is drawn horizontally at the start of the last impulse, not on the top of the candle wicks.
The price has retested the neckline multiple times, forming a clean structure before potential continuation.
The 100 SMA is above the price, confirming the bearish structure and scale alignment.
Trade Plan:
🔻 Entry: Below the neckline on confirmation of breakout.
🔻 Stop Loss (SL): Above the upper boundary of the channel and last swing high (clearly marked on the chart).
🔻 Take Profit (TP): At the intersection of the lower channel line with the long-term ascending trendline (green support), around 1.34 area.
Confirmation:
• The MACD shows momentum fading, indicating a potential downside move aligning with the FRL setup.
• We expect a clean impulse downward after a tight consolidation, providing a high-probability entry.
Following the FRL principles, we wait for a clean breakout below the neckline to confirm the structure shift before entering.

Momentum’s Here. Don’t Miss Out.Opportunity favors the prepared. The market’s shifting, and this setup is your signal to rise. If you're aiming for growth, consistency, and a clear path forward — you're in the right place.
No more solo trades with shaky confidence. It’s time to align with a professional approach that focuses on results, not guesswork. I help traders navigate, structure, and succeed — and I’m here for those ready to take the next step.
🚀 Growth isn’t accidental. Let’s build it together.
#buysetup #forexmentor #tradingmindset #tradingconfidence #tradingeducation #consistentprofits

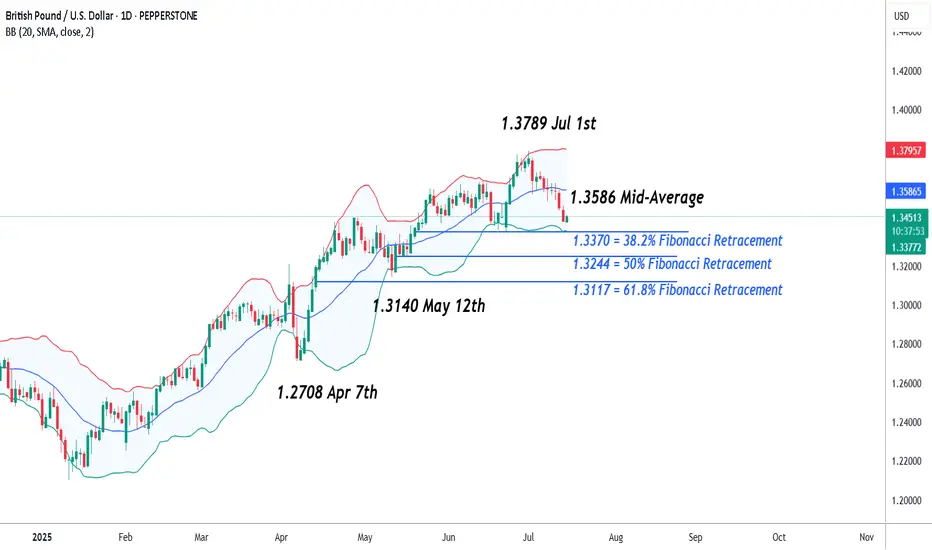
GBPUSD – Potential Short Term Volatility Ahead This WeekSo far, the month of July has not been a good one for GBPUSD, undermined by the precarious state of the UK Labour government’s finances, a deteriorating growth backdrop, and shifting interest rate differentials back in favour of the US dollar. This has seen a liquidation of stale long positioning and a steady decline from a 40 month high of 1.3789 registered on July 1st to a low of 1.3419 seen earlier today.
Looking forward, it could be another challenging week for FX traders to navigate. There are several economic data releases in the US and UK to digest, starting with the latest US CPI release later this afternoon (1330 BST), followed by the UK CPI update tomorrow (0700 BST) and then the UK Employment release on Thursday (0700 BST). All of these may have the potential to shift trader thinking on the next interest rate moves from the Federal Reserve (Fed), who are currently expected to keep rates unchanged when they next meet on July 31st, and the Bank of England (BoE), who are expected to cut by 25bps (0.25%) on August 7th.
When the outcome of these events is combined with the uncertain backdrop for global trade as President Trump’s new tariff deadline approaches on August 1st, alongside his ability to drop market moving social media headlines on a whim, this week has the potential to be a volatile one for GBPUSD.
Technical Update: Watching Closing Defence of 38.2% Retracement Support
So far, July has seen GBPUSD enter a correction phase, as prices have sold off from the 1.3789 July 1st session high into Tuesday’s current 1.3419 low. As the chart below shows, this 2.7% decline, seen over little more than a 10 session period, is now approaching what some might class as a support focus at 1.3370.
This level is equal to the 38.2% Fibonacci retracement of the April 7th to July 1st phase of strength, and could be one that traders are now monitoring on a closing basis over coming sessions. While this level remains intact, some might argue there is still a positive uptrend pattern in place.
However, it is also important to consider what are the support and resistance levels on which to focus, if either 1.3370 is broken to the downside, or it continues to stem the current phase of weakness, even helps prompt fresh attempts at price strength.
Possible Support Levels:
As we’ve suggested, it could be the 1.3370 retracement level that represents the first support, with closing breaks below this level opening potential for a more extended phase of price declines.
While much will depend on future market sentiment and price trends, closes below 1.3370 may represent possibilities of further weakness towards 1.3244, which is equal to the lower 50% retracement level. This giving way, may in time result in tests of 1.3140, the May 12th session low.
Possible Resistance Levels:
While the 1.3370 retracement continues to hold current price declines, it might be successful in prompting fresh attempts at price strength.
With that in mind, if moves back higher do materialise, a resistance point to monitor on a closing basis could be 1.3586. This is the current level of the Bollinger mid-average and this giving way on a closing basis may in turn lead to further attempts at price strength to challenge 1.3789, the July 1st high again.
The material provided here has not been prepared accordance with legal requirements designed to promote the independence of investment research and as such is considered to be a marketing communication. Whilst it is not subject to any prohibition on dealing ahead of the dissemination of investment research, we will not seek to take any advantage before providing it to our clients.
Pepperstone doesn’t represent that the material provided here is accurate, current or complete, and therefore shouldn’t be relied upon as such. The information, whether from a third party or not, isn’t to be considered as a recommendation; or an offer to buy or sell; or the solicitation of an offer to buy or sell any security, financial product or instrument; or to participate in any particular trading strategy. It does not take into account readers’ financial situation or investment objectives. We advise any readers of this content to seek their own advice. Without the approval of Pepperstone, reproduction or redistribution of this information isn’t permitted.
Key level for GBPUSDKey level for the bulls highlighted in green. We've pulled deeeep into the discount of the daily bullish leg, which is ideal. We're more than likely going to see the sentiment reports flip to majority bearish, which again, further confluence (for me at least). Waiting for a clear 1-4h bullish BOS, liquidity sweep and imbalance. Only then will I look for a long term swing trade to the upside.
Lots of news this week which coincide well with level. From my experience, we may see a nice range created around this level, and then when news hits we'll start the move higher. That's my take at least, let me know your thoughts.

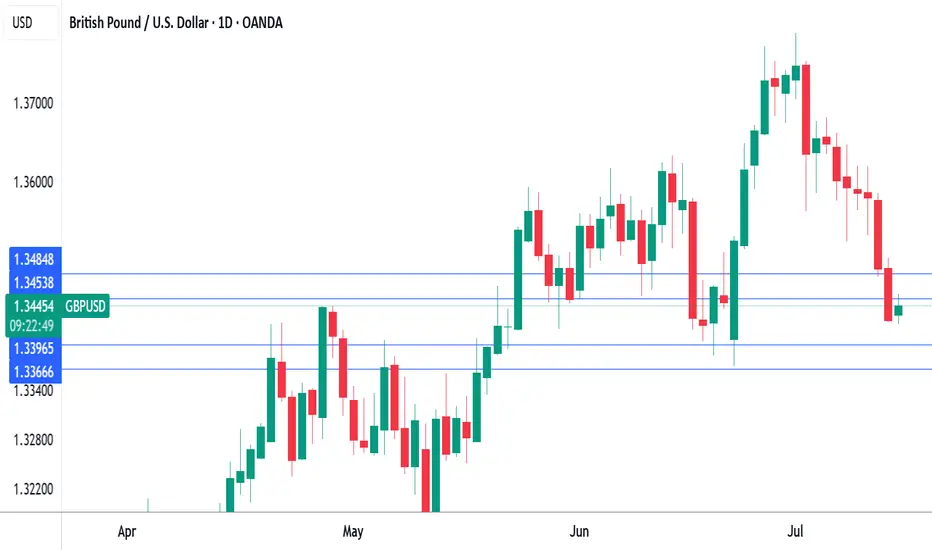
Pound under pressure ahead of US, UK inflation reportsThe British pound has edged up higher on Tuesday. In the European session, GBP/USD is trading at 1.3453, up 0.21% on the day. Earlier, GBP/USD touched a low of 1.3416, its lowest level since June 23.
All eyes will be on the UK inflation report for June, which will be released on Wednesday. Headline CPI is expected to remain unchanged at 3.4% y/y, as is core CPI at 3.5%. Monthly, both the headline rates are expected to stay steady at 0.2%.
Has the BoE's battle to lower inflation stalled? The BoE was looking good in March, when inflation eased to 2.6%, but CPI has rebounded to 3.4%, well above the BoE's inflation target of 2%. Services data has been especially sticky, although it dropped to 4.7% in May, down from 5.4% a month earlier.
At 3.4%, inflation is stuck at its highest level since February 2024 and that will complicate plans at the BoE to renew interest rate cuts in order to kick-start the weak UK economy. The central bank has lowered rates twice this year and would like to continue trimming the current cash rate of 4.25%. The Bank meets next on Aug. 7 and Wednesday's inflation data could be a significant factor in the rate decision.
In the US, if June inflation data rises as is expected, fingers will quickly point to President Trump's tariffs as finally having an impact. Recent inflation reports have not shown a significant spike higher due to the tariffs, which were first imposed in April. However, the tariffs may have needed time to filter throughout the economy and could be felt for the first time in the June inflation reading.
The Fed meets next on July 30, with the markets pricing in a 95% chance of a hold, according to CME's FedWatch. For September, the odds of a rate cut stand at 59%. Today's inflation report could cause a shift in these numbers.
GBP/USD tested resistance at 1.3454 earlier. Above, there is resistance at 1.3484
1.3396 and 1.3366 are the next support levels
GBP/USD – Falling Wedge Breakout & Bullish Reversal Setup
🔹 1H Chart by PULSETRADESFX
Cable has broken out of a clean falling wedge pattern within a broader descending channel. Price respected key demand at 1.34060 – 1.34456, followed by a bullish breakout and retest of the wedge resistance.
With momentum now favoring the bulls, a recovery toward 1.35724 is on the cards as long as price sustains above 1.3445.
📌 Trade Plan:
Entry: 1.34507
Stop Loss: 1.34060 (Below demand zone)
Take Profit: 1.35724 (Channel midline resistance)
This setup highlights early reversal signals backed by structure, demand reaction, and wedge breakout.
---
✅ Technical Highlights:
Falling wedge breakout
Retest confirmation
Demand zone bounce
Risk-to-reward > 2:1
📅 July 15, 2025
📊 FOREX.com feed via TradingView
#GBPUSD #ForexSignals #ChartAnalysis #BullishSetup #PriceAction #TradingView #PULSETRADESFX

GBPUSD TRADE IDEA UPDATE We seem to in for a continuation move to the upside.
We've been waiting for a pullback throughout this week and we've been tapped into the trade.
Let's see how the market does it's thing
GBPUSD: Price Action at Critical JunctureApproaching a Deciding Level : GBPUSD is currently trading near a critical "Deciding Level" (highlighted in grey) around 1.33927. This zone appears to be a crucial pivot point, where the market will likely determine its next significant move.
Uptrend Line as Dynamic Support : An ascending trendline (light blue) originating from January 2025 has consistently provided dynamic support for the price. The current price action is testing this trendline, making its integrity vital for the continuation of the bullish structure.
Identified First Resistance Level Above : A "1st Resistance Level" (highlighted in red) is clearly marked around 1.36000. This level has proven to be a ceiling for recent upward movements and represents the immediate hurdle for bulls.
Strong First Support Level Below : Below the current price, a "1st Support Level" (highlighted in green) is identified between approximately 1.31000 and 1.32000. This zone previously acted as strong support in late April/early May and could serve as a significant demand area if the price breaks below the "Deciding Level" and the trendline.
Disclaimer:
The information provided in this chart is for educational and informational purposes only and should not be considered as investment advice. Trading and investing involve substantial risk and are not suitable for every investor. You should carefully consider your financial situation and consult with a financial advisor before making any investment decisions. The creator of this chart does not guarantee any specific outcome or profit and is not responsible for any losses incurred as a result of using this information. Past performance is not indicative of future results. Use this information at your own risk. This chart has been created for my own improvement in Trading and Investment Analysis. Please do your own analysis before any investments.

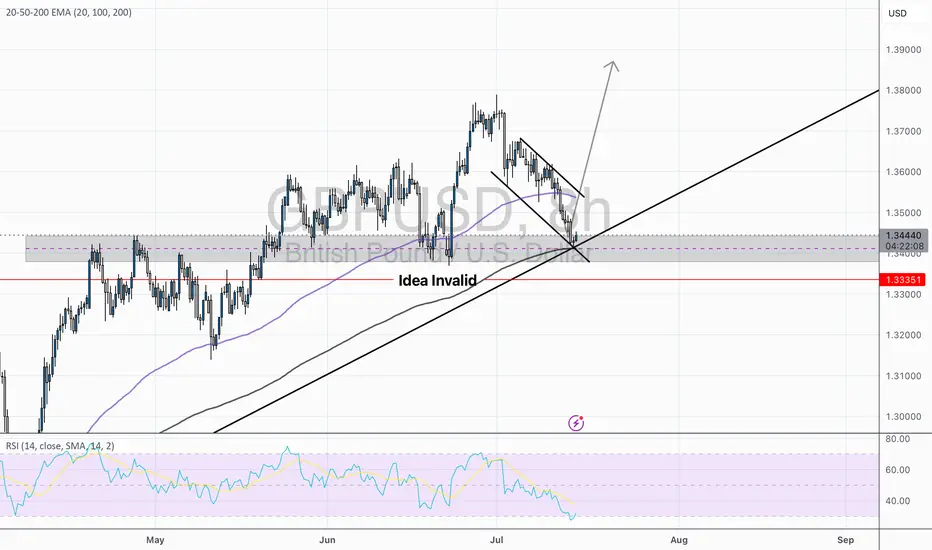
GBP/USD — Potential Bullish Reversal Setup | Long Bias Above Sup🧠 Thesis:
GBP/USD is showing early signs of a potential bullish reversal from a key confluence zone. While price has recently tested short-term descending channel, we’re currently testing a strong ascending trendline support and prior demand zone. This setup offers a favorable long-risk scenario — so long as price remains above 1.3335 (invalid level).
🔍 Technical Breakdown:
Descending Channel: Price has been in a corrective downward channel since early July. This pullback appears orderly and corrective rather than impulsive.
Support Zone: We are seeing strong reactions from the 1.3400–1.3440 area, which aligns with:
Previous consolidation zone (mid-May).
200 EMA on the 4H.
Long-term ascending trendline support (from April lows).
Bullish RSI Divergence: RSI is testing oversold territory (~32) with potential for bullish divergence forming — a classic early signal for a bounce.
EMA Cluster: 50 EMA has been breached but price is testing the 200 EMA as last-resort dynamic support. If held, this further adds to the bullish case.
🧭 Scenarios:
✅ Bullish Bias (Preferred)
If price holds above the trendline support and breaks out of the descending channel, we could see a bullish impulse toward:
🎯 TP1: 1.3600 (prior structure)
🎯 TP2: 1.3770 (trendline extension & fib confluence)
Confirmation trigger: Break and close above 1.3500 resistance (channel breakout).
❌ Invalidation:
A decisive break below 1.3335 (marked in red) invalidates this idea and shifts bias back to bearish — potential deeper pullback toward 1.3200s.
⚠️ Risk Management:
Entry zone: 1.3430–1.3450 (near support)
Stop loss: Below 1.3335
Risk-reward: >2.5:1 on a successful breakout
📝 Conclusion:
This is a classic trend-continuation play with clean structure and a logical invalidation point. The market is offering a textbook “buy-the-dip” scenario off strong multi-timeframe support. Patience is key — wait for confirmation before sizing in.
Bullish reversal?The Cable (GBP/USD) has bounced off the pivot and could rise to the 38.2% Fibonacci resistance.
Pivot: 1.3529
1st Support: 1.3457
1st Resistance: 1.3633
Risk Warning:
Trading Forex and CFDs carries a high level of risk to your capital and you should only trade with money you can afford to lose. Trading Forex and CFDs may not be suitable for all investors, so please ensure that you fully understand the risks involved and seek independent advice if necessary.
Disclaimer:
The above opinions given constitute general market commentary, and do not constitute the opinion or advice of IC Markets or any form of personal or investment advice.
Any opinions, news, research, analyses, prices, other information, or links to third-party sites contained on this website are provided on an "as-is" basis, are intended only to be informative, is not an advice nor a recommendation, nor research, or a record of our trading prices, or an offer of, or solicitation for a transaction in any financial instrument and thus should not be treated as such. The information provided does not involve any specific investment objectives, financial situation and needs of any specific person who may receive it. Please be aware, that past performance is not a reliable indicator of future performance and/or results. Past Performance or Forward-looking scenarios based upon the reasonable beliefs of the third-party provider are not a guarantee of future performance. Actual results may differ materially from those anticipated in forward-looking or past performance statements. IC Markets makes no representation or warranty and assumes no liability as to the accuracy or completeness of the information provided, nor any loss arising from any investment based on a recommendation, forecast or any information supplied by any third-party.

check the trendWith the current support range broken, a continuation of the downward trend to the next support levels is possible. Otherwise, with the support range stabilized above, an upward trend to the specified resistance levels is possible.

GBPUSD 4HR Analysis on a bearish outlookGBPUSD - Short term bullish on DXY - I have my doubts on DXY still being bullish but I do like this scenario.

GU-Tue-15/07/25 TDA-USD CPI in New York session!Analysis done directly on the chart
Follow for more, hit me up on Tradingview!
Risk per trade (from my point of view):
-Low risk (0.2% or less)
-Medium risk (0.3%-0.6%)
-High risk (0.7%-1%)
Market is always changing, not every trade is worth
risking full risk. Adapt to how the market is changing
and use a proper risk management accordingly is key.
Premise:
A simple idea plan (like Tradingview public posts) won't describe everything.
No one can predict how market will move, it's always good to react to how it moves.
It gives an idea of how price might move, but no one come from FUTURE.
So I always encourage people to openly and actively discuss in real time.
I don't give signals blindly, people should learn
and understand the skill.
Following blindly signals you won't know how to
manage the trade, where precisely put sl and tp,
lot size and replicate the move over time.
That's why you need active real time discussions.
Trading is not get rich quick scheme!
I want to find like minded traders, hit me up
privately here on Tradingview or other socials!
Active in London session!
Not financial advice, DYOR.
Market Flow Strategy
Mister Y
