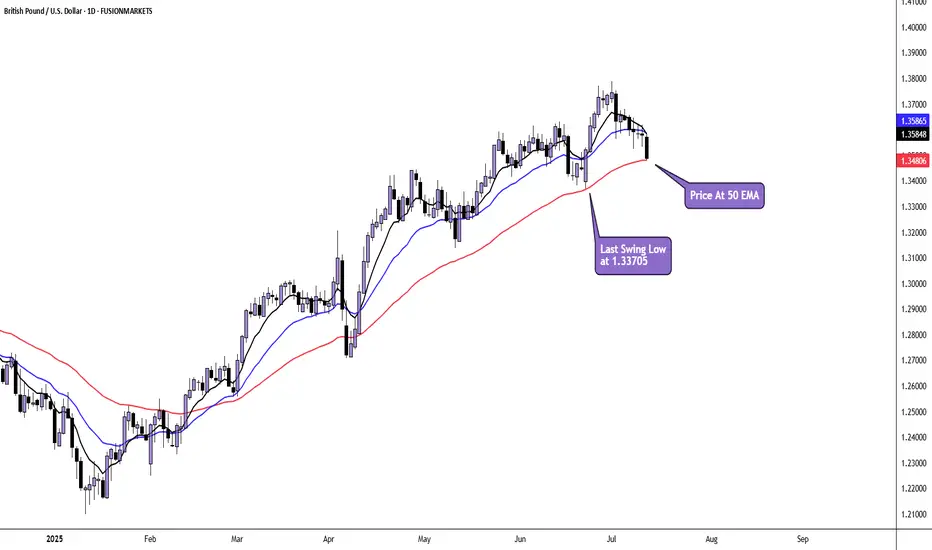
GBP/USD Daily AnalysisPrice is in a daily uptrend and has pulled back to the 50 moving average.
Here, price may find support and set up for another bullish impulse.
However, if price breaks the last swing low at 1.33705, we may have seen a top formed and a change in sentiment.
If you agree with this analysis. look for a trade that meets your strategy rules.
GBPUSD trade ideas
GBPUSD: Bullish Continuation & Long Signal
GBPUSD
- Classic bullish pattern
- Our team expects retracement
SUGGESTED TRADE:
Swing Trade
Buy GBPUSD
Entry - 1.3503
Stop - 1.3453
Take - 1.3608
Our Risk - 1%
Start protection of your profits from lower levels
Disclosure: I am part of Trade Nation's Influencer program and receive a monthly fee for using their TradingView charts in my analysis.
❤️ Please, support our work with like & comment! ❤️

UK GBP contracts, pound dipsThe British pound continues to have a quiet week. In the European session, GBP/USD is trading at 1.3530, down 0.30% on the day.
The UK wrapped up the week on a down note, as GDP contracted in May by 0.1% m/m. This followed a 0.3% decline in April and missed the consensus of 0.1%. The decline was driven by a 1% decline in manufacturing and a 0.6% contraction in construction, which cancelled out a 0.1% expansion in services.
The GDP contractions in April and May point to a weak second quarter of growth, after an impressive 0.7% gain in the first quarter. The economic landscape remains uncertain and the Bank of England has projected weak growth of 1% for 2025. Governor Bailey has said that the rate path will be "gradually downwards" but hasn't hinted as to the timing of the next cut.
The weak GDP data supports the case for an August rate cut, even though headline inflation is running at 3.4% and core inflation at 3.5%, well above the BoE's target of 2%. The money markets have priced in a quarter-point cut in August at 80%, which would lower the cash rate to 4.0%.
The BoE released its financial stability report earlier in the week, noting that the outlook for UK growth over the coming year is "a little weaker and more uncertain". The Bank highlighted President Trump's tariffs and the conflict in the Middle East. The UK has recently signed a trade deal with the US but some tariffs on UK products remain in effect.
GBP/USD is testing support at 1.3534. Below, there is support at 1.3491
The next resistance lines are 1.3577 and 1.3620

GBP/USD FUNDAMENTAL ANALYSISGBP/USD holds its winning streak for the fourth successive session, trading above 1.3700 in the European session on Thursday. The pair hangs close to three-year highs amid sustained US Dollar weakness, in light of US President Trump's fresh attack on the Fed's credibility. US data and BoE-speak awaited.

GBPUSD Long IdeaGBPUSD has formed Higher Low which indicates bullish movement and the price rejected previous major support zone. TP1 is the zone that is most probable for me.
Good Luck!

GBPUSD Under PressureGBP/USD decline is driven by dovish UK central bank tone, disappointing UK data, a firming US Dollar, and global risk aversion. The pair is range‑bound between 1.3360–1.3445, with the next significant downside target at 1.3BoE hints at rate cuts amid weak UK GDP, fueling Pound weakness. possibly 1.3000 if bearish momentum sustains.
Stronger USD + global risk-off adds pressure.
Support: 1.3360 | Bias: Bearish unless UK data surprises.
#GBPUSD

GBPUSD(20250716)Today's AnalysisMarket news:
① The annual rate of the overall CPI in the United States in June rose to 2.7%, the highest since February, in line with market expectations, and the monthly rate was 0.3%, the highest since January, in line with market expectations; the annual rate of the core CPI rose to 2.9%, the highest since February, lower than the expected 3%, but slightly higher than 2.8% last month, and the monthly rate was 0.2%, lower than the market expectation of 0.3%.
② Interest rate futures still show that the Fed is unlikely to cut interest rates this month, but there is a high possibility of a 25 basis point cut in September.
③ Fed mouthpiece: The CPI report will not change the Fed's policy direction.
④ Trump: Consumer prices are low and the federal funds rate should be lowered immediately. The Fed should cut interest rates by 3 percentage points.
⑤ Fed Collins: The core inflation rate is expected to remain at about 3% by the end of the year, and the Fed should maintain active patience.
Technical analysis:
Today's buying and selling boundaries:
1.3409
Support and resistance levels:
1.3497
1.3464
1.3443
1.3375
1.3354
1.3321
Trading strategy:
If the price breaks through 1.3409, consider buying, the first target price is 1.3443
If the price breaks through 1.3375, consider selling, the first target price is 1.3354

GBPUSD ShortGBPUSD is now net short on the regression break.
I am considering my EA options on this pair.
GBPUSD H4 SHORT SETUP: 14-18 JULY 2025TECHNICAL ANALYSIS
Price and market both bearish, with price currently at support. This pair will have to pull back to the resistance level before bears can look to short.
FUNDAMENTAL ANALYSIS
The currency pair GBPUSD has a score of -3, indicating that the base currency is weaker than the quote currency. The trend projection also shows further downside.
The COT report is slightly neutral for both currency pairs, and retail sentiment is 54% bearish. Although the COT is neutral, in a trade like this, the trend is your friend until technical indicators suggest otherwise.

GBPUSD COT and Liquidity AnalysisHey what up traders welcome to the COT data and Liquidity report. It's always good to go with those who move the market here is what I see in their cards. I share my COT - order flow views every weekend.
🎯 Non Commercials has been taking profits on during last 3 weeks. There for I think we need deeper pullback to reload the longs.
📍Please be aware that institutions report data to the SEC on Tuesdays and data are reported on Fridays - so again we as retail traders have disadvantage, but there is possibility to read between the lines. Remember in the report is what they want you to see, that's why mostly price reverse on Wednesday after the report so their cards are hidden as long as possible. However if the trend is running you can read it and use for your advantage.
💊 Tip
if the level has confluence with the high volume on COT it can be strong support / Resistance.
👍 Hit like if you find this analysis helpful, and don't hesitate to comment with your opinions, charts or any questions.
Analysis done on the Tradenation Charts
Disclosure: I am part of Trade Nation's Influencer program and receive a monthly fee for using their TradingView charts in my analysis.
"Adapt what is useful, reject what is useless, and add what is specifically your own."
— David Perk aka Dave FX Hunter ⚔️

GBPUSD-4H BUYUptrend in the weekly , break resistant with strong momentum Candle. Divergency is showing and It test the Support and now ready to go up with the main trend.

09.07.25 Morning ForecastPairs on Watch -
FX:GBPUSD
FX:EURAUD
OANDA:JP225USD
FX:USDCAD
A short overview of the instruments I am looking at for today, multi-timeframe analysis down to what I will be looking at for an entry. Enjoy!

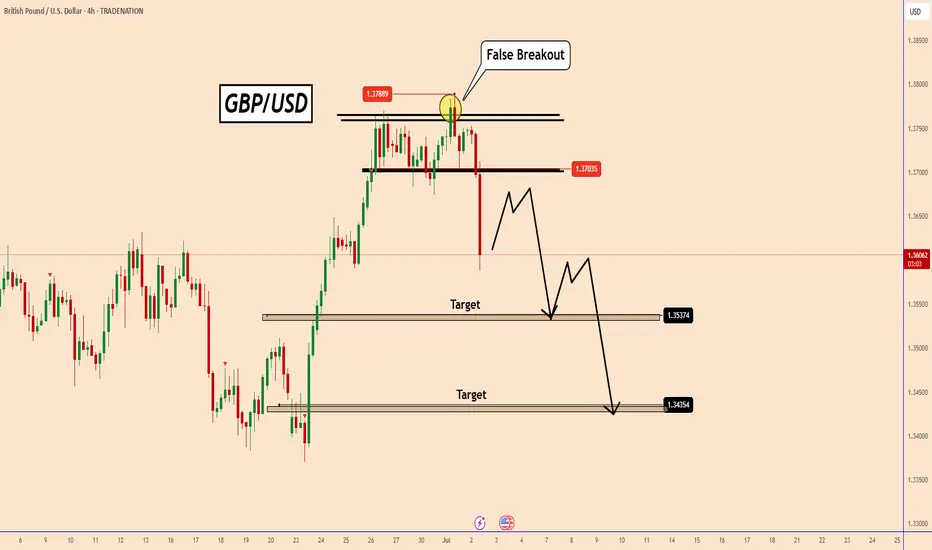
GBPUSD: Profit taking or a downward move?GBPUSD: Profit taking or a downward move?
Yesterday, GBPUSD reached a new high of 1.3788, last seen in February 2022.
From the chart it can be clearly seen that GBPUSD only created a false breakout to the upside.
Market participants expected USD to weaken, but it changed direction again and locked in many long positions.
Despite the ADP data today being a real dud from expectations of 95k to -33k, we can see that GBPUSD did not stop the decline.
I think this could be related to the FED and if they think that maybe this is the time to change Interest Rates at the July meeting. It could also be a liquidity release and it could rise again, but we cannot prove this yet with the current pattern.
Technical Analysis:
As long as the price stays below 1.3680 or below this small structure, the price could fall further.
Don't forget that tomorrow we also have NFP data and the US market will be preparing for a long weekend. The 4-hour candle is strong and bearish, so let's see.
You may find more details in the chart!
Thank you and Good Luck!
PS: Please support with a like or comment if you find this analysis useful for your trading day
Disclosure: I am part of Trade Nation's Influencer program and receive a monthly fee for using their TradingView charts in my analysis.
GBP/USD - Potential TargetsDear Friends in Trading,
How I see it,
PIVOT @ 1.35300
High TF Bullish:
1) The Daily bullish trend is still intact at this time.
2) We need a strong bounce/breach and hold above PIVOT
for 1D trend to continue.
Potential for more downside:
1) If price remains below PIVOT, potential for further downside
remains high.
Keynote:
Monitor price action closely around 1,34000 area.
I sincerely hope my point of view offers a valued insight.
Thank you for taking the time to study my analysis.

GBP/USD : Get Ready for Another Fall!By analyzing the GBP/USD chart on the 4-hour timeframe, we can see that after reaching 1.36800—filling the targeted FVG as expected—the price faced selling pressure once again and has since dropped to around 1.35690.
The first target at 1.35630 is now within reach. After collecting liquidity below this level and a possible short-term bounce, we can expect another bearish continuation on GBPUSD.
Key supply zones to watch are 1.36180–1.36465 and 1.36940.
Key demand zones are located at 1.35630, 1.35100, and 1.34880.
THE MAIN ANALYSIS :

GBPUSD LONG FORECAST Q3 D14 W29 Y25GBPUSD LONG FORECAST Q3 D14 W29 Y25
Welcome back to the watchlist GBPUSD ! Let's go long ! Alignment across all time frames.
Professional Risk Managers👋
Welcome back to another FRGNT chart update📈
Diving into some Forex setups using predominantly higher time frame order blocks alongside confirmation breaks of structure.
Let’s see what price action is telling us today!
💡Here are some trade confluences📝
✅Daily order block
✅1H Order block
✅Intraday breaks of structure
✅4H Order block
📈 Risk Management Principles
🔑 Core Execution Rules
Max 1% risk per trade
Set alerts — let price come to your levels
Minimum 1:2 RR
Focus on process, not outcomes
🧠 Remember, the strategy works — you just need to let it play out.
🧠 FRGNT Insight of the Day
"The market rewards structure and patience — not emotion or urgency."
Execute like a robot. Manage risk like a pro. Let the chart do the talking.
🏁 Final Words from FRGNT
📌 GBPUSD is offering textbook alignment — structure, order flow, and confirmation all check out.
Let’s approach the trade with clarity, conviction, and risk-managed execution.
🔑 Remember, to participate in trading comes always with a degree of risk, therefore as professional risk managers it remains vital that we stick to our risk management plan as well as our trading strategies.
📈The rest, we leave to the balance of probabilities.
💡Fail to plan. Plan to fail.
🏆It has always been that simple.
❤️Good luck with your trading journey, I shall see you at the very top.
🎯Trade consistent, FRGNT X

Bullish bounce off pullback support?The Cable (GBP/USD) has bounced off the pivot, which has been identified as a pullback support, and could bounce to the 1st resistance, which is a pullback resistance.
Pivot: 1.3584
1st Support: 1.3519
1st Resistance: 1.3771
Risk Warning:
Trading Forex and CFDs carries a high level of risk to your capital and you should only trade with money you can afford to lose. Trading Forex and CFDs may not be suitable for all investors, so please ensure that you fully understand the risks involved and seek independent advice if necessary.
Disclaimer:
The above opinions given constitute general market commentary, and do not constitute the opinion or advice of IC Markets or any form of personal or investment advice.
Any opinions, news, research, analyses, prices, other information, or links to third-party sites contained on this website are provided on an "as-is" basis, are intended only to be informative, is not an advice nor a recommendation, nor research, or a record of our trading prices, or an offer of, or solicitation for a transaction in any financial instrument and thus should not be treated as such. The information provided does not involve any specific investment objectives, financial situation and needs of any specific person who may receive it. Please be aware, that past performance is not a reliable indicator of future performance and/or results. Past Performance or Forward-looking scenarios based upon the reasonable beliefs of the third-party provider are not a guarantee of future performance. Actual results may differ materially from those anticipated in forward-looking or past performance statements. IC Markets makes no representation or warranty and assumes no liability as to the accuracy or completeness of the information provided, nor any loss arising from any investment based on a recommendation, forecast or any information supplied by any third-party.

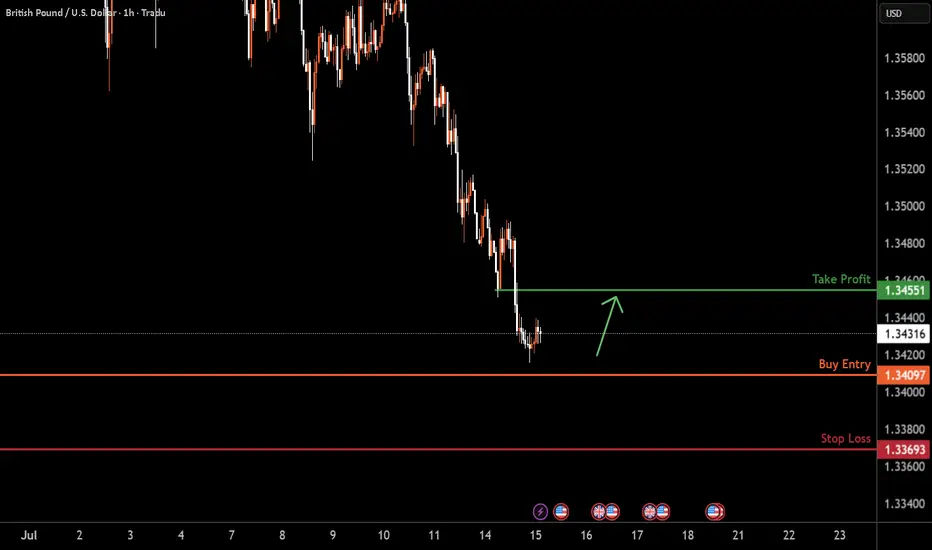
GBPUSD H1 I Bullish Reversal Based on the H1 chart analysis, we can see that the price could fall toward our buy entry at 1.3409, which is a pullback support.
Our take profit will be at 1.3455, which is a pullback resistance level.
The stop loss will be placed at 1.3369, a swing low support
High Risk Investment Warning
Trading Forex/CFDs on margin carries a high level of risk and may not be suitable for all investors. Leverage can work against you.
Stratos Markets Limited (tradu.com ):
CFDs are complex instruments and come with a high risk of losing money rapidly due to leverage. 63% of retail investor accounts lose money when trading CFDs with this provider. You should consider whether you understand how CFDs work and whether you can afford to take the high risk of losing your money.
Stratos Europe Ltd (tradu.com ):
CFDs are complex instruments and come with a high risk of losing money rapidly due to leverage. 63% of retail investor accounts lose money when trading CFDs with this provider. You should consider whether you understand how CFDs work and whether you can afford to take the high risk of losing your money.
Stratos Global LLC (tradu.com ):
Losses can exceed deposits.
Please be advised that the information presented on TradingView is provided to Tradu (‘Company’, ‘we’) by a third-party provider (‘TFA Global Pte Ltd’). Please be reminded that you are solely responsible for the trading decisions on your account. There is a very high degree of risk involved in trading. Any information and/or content is intended entirely for research, educational and informational purposes only and does not constitute investment or consultation advice or investment strategy. The information is not tailored to the investment needs of any specific person and therefore does not involve a consideration of any of the investment objectives, financial situation or needs of any viewer that may receive it. Kindly also note that past performance is not a reliable indicator of future results. Actual results may differ materially from those anticipated in forward-looking or past performance statements. We assume no liability as to the accuracy or completeness of any of the information and/or content provided herein and the Company cannot be held responsible for any omission, mistake nor for any loss or damage including without limitation to any loss of profit which may arise from reliance on any information supplied by TFA Global Pte Ltd.
The speaker(s) is neither an employee, agent nor representative of Tradu and is therefore acting independently. The opinions given are their own, constitute general market commentary, and do not constitute the opinion or advice of Tradu or any form of personal or investment advice. Tradu neither endorses nor guarantees offerings of third-party speakers, nor is Tradu responsible for the content, veracity or opinions of third-party speakers, presenters or participants.
GBPUSD Week 29 Swing Zone/LevelsAfter 7 straight weeks of profitable gold trading, we’re shifting gears to GBPUSD.
Why this pair? It’s offering a classic low-risk, high-reward setup that many traders appreciate:
🔒 Stop Loss: 10–15 pips
🎯 Take Profit: 50–100 pips
We’re analyzing price action using a simple but powerful concept:
Each zone is drawn based on how the high and low of one day compares with the next. For example:
Monday’s high/low vs Tuesday’s range
Tuesday’s vs Wednesday’s, and so on
This method helps spot potential continuation zones as market structure unfolds across the week.
👉 The key? Patience, and letting the levels tell the story.
As always price action determines trades

GBPUSD - 15m - 95% PredictionGBPUSD - 15m
Bumping to 5 minutes order block and then dumping to create new lower low.

GBPUSD: Bearish > Bullish Order FlowAlright, we are approaching some Higher Timeframe Points of Interests. We got a Potential Bullish Bat Pattern Pattern this align with this Bullish H4 Order Block, that's right in the middle of an whole number 1.34. We could expect some spikes around the area, some complex pullbacks, but we must remain steady.

GBPUSD: NEW-WEEK TECHNICAL BIAS (MARKET OPEN) Higher Timeframe Bias:
Ascend Sequence remains valid on the Monthly, Weekly, and Daily structures, with the current Descend Sequence viewed as a pullback phase within broader bullish flow.
Structural Insight:
Despite recent sell-side pressure, price failed to break the Range Low during last week’s trading — suggesting possible defense of bullish territory.
Key Zones to Watch:
Focus remains on the Range Origin Zone. If respected, it may trigger a cautious rally toward the LRP or even the OCZ above.
A clean violation of the Range Origin would open downside toward 1.33704 (Range Low). A breach of this level could signal a Sequence Switch, confirming shift to Sell-Side Bias Environment (SBE) and initiating deeper exploration into the Monthly PIZ.
Execution Outlook:
If Range Origin holds: Lean toward tactical long setups with tight validation structure.
If broken: Bias shifts aggressively bearish — looking to short rallies in line with new descending flow.
Summary:
Still favoring HTF bullish structure unless Range Origin fails. Below that, sell-side becomes dominant, and rallies become shorting opportunities.

Wait for a sell confirmation and don't forget to use a stop lossThe market structure suggests a strong bearish trend with a potential breakout below 1.3400, supported by the descending triangle and bearish indicators
