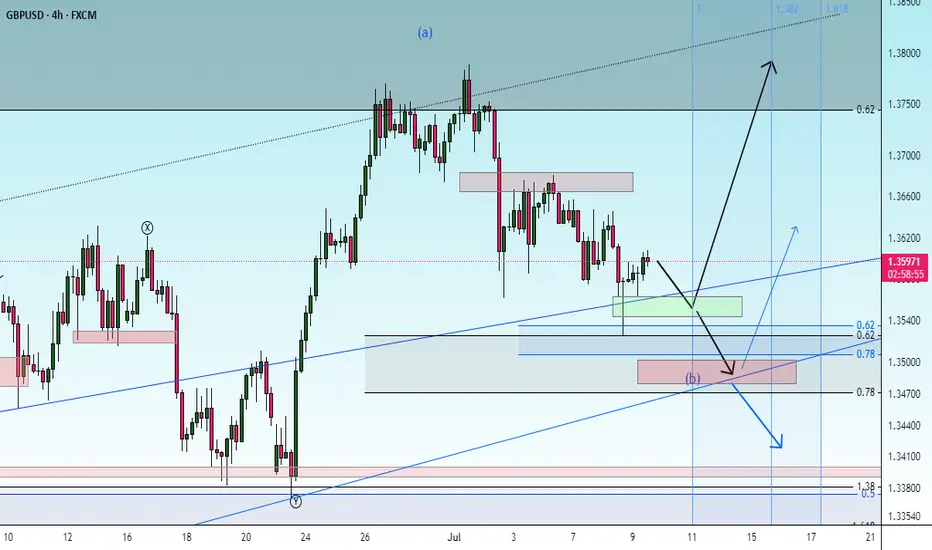
LONG - GBP/USDPrice has already reached my third reversal line and this is where I can expect to price to close above the reversal line to hint a possible change in the direction of the trend.
Currently right now I am waiting for the price to show me a bullish reversal candle for the price to give me confluence to possible change of trend.
I am still bias with the trend moving upwards base on the market structure given by the price action.
However I will not consider the 4th Key Point Market Structure as HL if it breaks the previous structure.
Entry - 1.34683
Stop Loss - 1.33704
Take Profit - 1.36002
GBPUSD trade ideas

GBPUSD TRADE SETUPWait for retest the entry level then take a trade for sell otherwise skip this setup

GBPUSD Bearish Signal | Technical + Custom AlgoSmart Trend Signal | Technical Analysis + Custom Algorithm
This signal is the result of a combination of classic technical trend analysis and a proprietary software I personally developed.
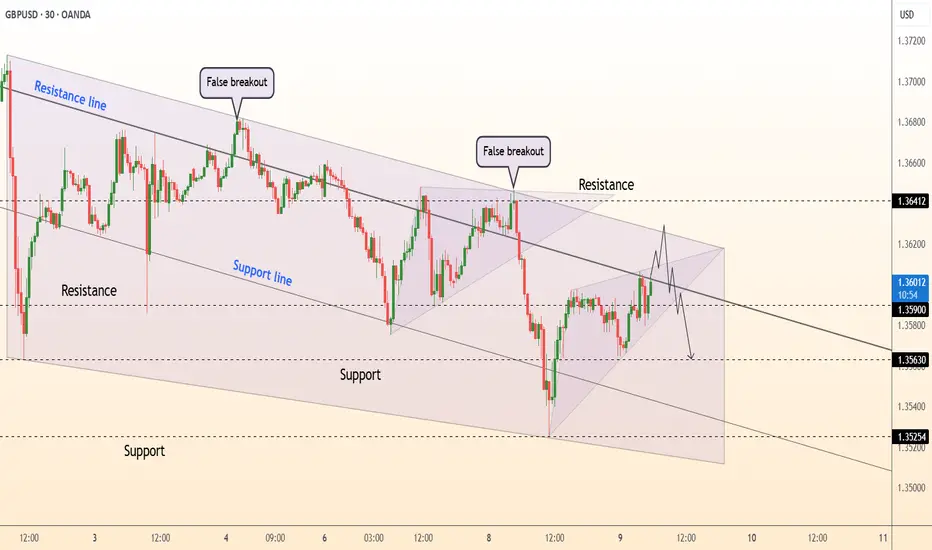
DeGRAM | GBPUSD will continue to correct📊 Technical Analysis
● Two false breakouts at the channel roof (1.3640 ±) underline supply; price is now carving successive lower-highs beneath the blue resistance line inside a 7-day falling channel.
● Fresh bearish rejection of 1.3605 leaves a descending triangle whose base aligns with 1.3563 support; a 30 min close below it exposes the lower rail / June pivot at 1.3525.
💡 Fundamental Analysis
● BoE Chief Economist Pill repeated that “further evidence of disinflation” is needed but rates are “sufficiently restrictive”, reviving August-cut bets, while firm US wage-inflation keeps Fed easing priced farther out—widening the short-rate gap in the dollar’s favour.
✨ Summary
Sell 1.3590-1.3610; break < 1.3563 targets 1.3525. Bear view void on an H1 close above 1.3640.
-------------------
Share your opinion in the comments and support the idea with a like. Thanks for your support!
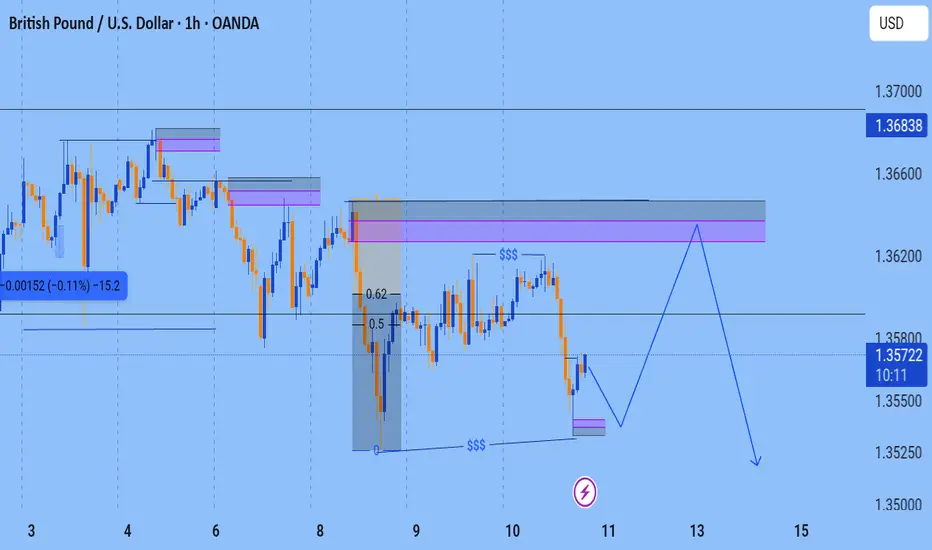
Long to Short Gbpusd The market has formed a double bottom at a support and resistance zone which also servers as a liquidity but the market might might move up to fill the fvgs above and might also grab liquidity into the poi for short
Sell idea!Hello all. market react to the br node and make a low, then after hitting to an LOZ was going higher. now after breaking the IHS market will collapse. R:R 11 is enough. be happy(wink)

GU-Thu-10/07/25 TDA-GU resuming bullish trend?Analysis done directly on the chart
Follow for more, possible live trades update!
I often share my live trades in Tradingview public chat in London session, stay tuned!
For every trade I take, no matter if it's a loss or win, I always
do post trade analysis. It really helps to understand and
improve. You get to know or try to figure out why price
at this time specifically moved this way or that way.
Premise:
A simple idea plan (like Tradingview public posts) won't describe everything.
No one can predict how market will move, it's always good to react to how it moves.
It gives an idea of how price might move, but no one come from FUTURE.
So I always encourage people to openly and actively discuss in real time.
For example discussing on Tradingview public chat (and more).
I don't give signals blindly, people should learn
and understand the skill.
Following blindly signals you won't know how to
manage the trade, where precisely put sl and tp,
lot size and replicate the move over time.
That's why you need active real time discussions.
Trading is not get rich quick scheme!
Active in London session!
Not financial advice, DYOR.
Market Flow Strategy
Mister Y

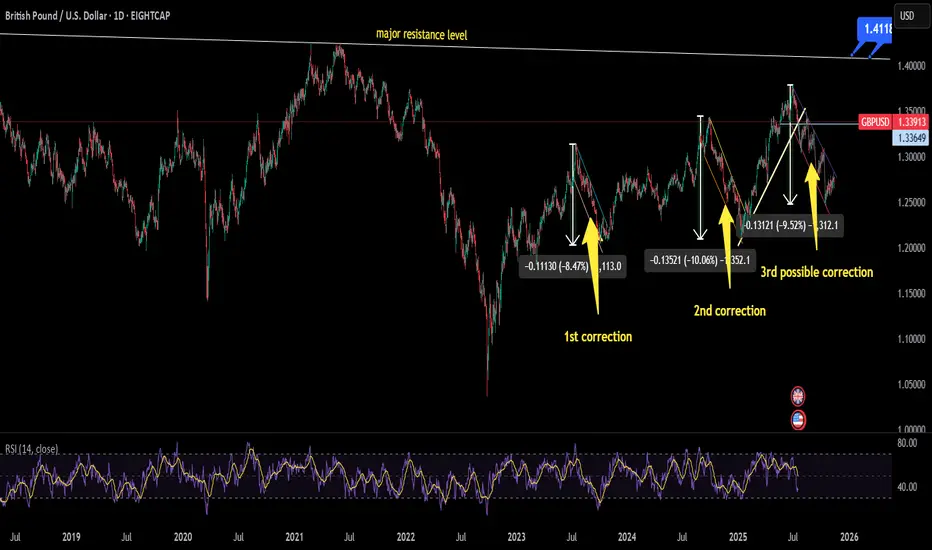
will GBPUSD make its 3rd correction???currently price is testing marked trendline which is acting as support level for a decent time if this level price will reverse its trend from here and will hit major resistance level which also has been drawn but if price action follows what it has done twice in the past then chances are that trend will enter in correction phase which is 3rd phase. In all this movement of DXY will play major role if DXY will continue to move upward pair will follow bearish trend and vice versa
GBP/USD Daily Outlook: At a Pivotal JunctureLong-Term Trend Dynamics
The Pound-Dollar pair has largely maintained an upward trajectory since April, guided by a robust long-term rising trendline. This enduring bullish structure has consistently provided dynamic support, illustrating a sustained period of higher lows and gradual appreciation over several months.
The Immediate "Deciding Level"
GBP/USD currently finds itself at a critical confluence point, labeled the "Deciding Level." This horizontal zone of significance is being tested precisely where it intersects with the established long-term rising trendline, making the present price action absolutely pivotal for determining the pair's short-term direction.
Potential Downside Acceleration
A decisive break and sustained trading below this "Deciding Level" would signal a significant shift in market sentiment, opening the door for "More immediate Downside." Such a move would likely accelerate the existing bearish momentum (indicated by the steep red downtrend line), with the "1st Support Level" becoming the primary downside target where strong buying interest might re-emerge.
Key Resistance Zones to Watch
Should the "Deciding Level" successfully hold as support, the pair could attempt to reverse its recent decline. Any potential rebound, however, would first encounter resistance from the short-term red downtrend line, followed by the formidable "1st Resistance Level," an overhead supply zone that has historically capped bullish advances.
Disclaimer:
The information provided in this chart is for educational and informational purposes only and should not be considered as investment advice. Trading and investing involve substantial risk and are not suitable for every investor. You should carefully consider your financial situation and consult with a financial advisor before making any investment decisions. The creator of this chart does not guarantee any specific outcome or profit and is not responsible for any losses incurred as a result of using this information. Past performance is not indicative of future results. Use this information at your own risk. This chart has been created for my own improvement in Trading and Investment Analysis. Please do your own analysis before any investments.

GBPUSD InsightWelcome to all our subscribers.
Please feel free to share your personal thoughts in the comments.
Don't forget to like and subscribe!
Key Points
- According to CBS and other U.S. media outlets, former President Trump asked Republican lawmakers during a closed-door meeting whether they supported removing Federal Reserve Chair Jerome Powell. It was reported that many lawmakers showed support for the idea. However, in a meeting with the Prime Minister of Bahrain, Trump stated that unless Powell is involved in a scandal related to renovations of the Federal Reserve building, the likelihood of his dismissal is very low.
- President Trump is actively lobbying lawmakers to pass three stalled cryptocurrency bills in the House of Representatives. Optimism about the bills' passage has resurfaced. In particular, the potential strategic use of stablecoins to strengthen the dominance of the U.S. dollar and boost demand for U.S. Treasuries has brought renewed attention to these legislative efforts.
- The U.K.’s Consumer Price Index (CPI) for June came in at 3.6%, exceeding the market expectation of 3.4%. As a result, the possibility of a Bank of England rate cut in July has significantly diminished.
Key Economic Schedule This Week
+ July 17: Eurozone June Consumer Price Index (CPI)
GBPUSD Chart Analysis
The GBPUSD pair failed to break above the 1.38000 level and fell through the trendline after facing resistance in that zone. Currently, it is testing support near the 1.34000 level. If the pair successfully rebounds from this area, we could expect another potential rally toward the 1.40000 level. However, if the support is broken, a further decline toward the 1.31500–1.32000 range is likely.

GBPUSD and EURUSD Analysis todayHello traders, this is a complete multiple timeframe analysis of this pair. We see could find significant trading opportunities as per analysis upon price action confirmation we may take this trade. Smash the like button if you find value in this analysis and drop a comment if you have any questions or let me know which pair to cover in my next analysis.


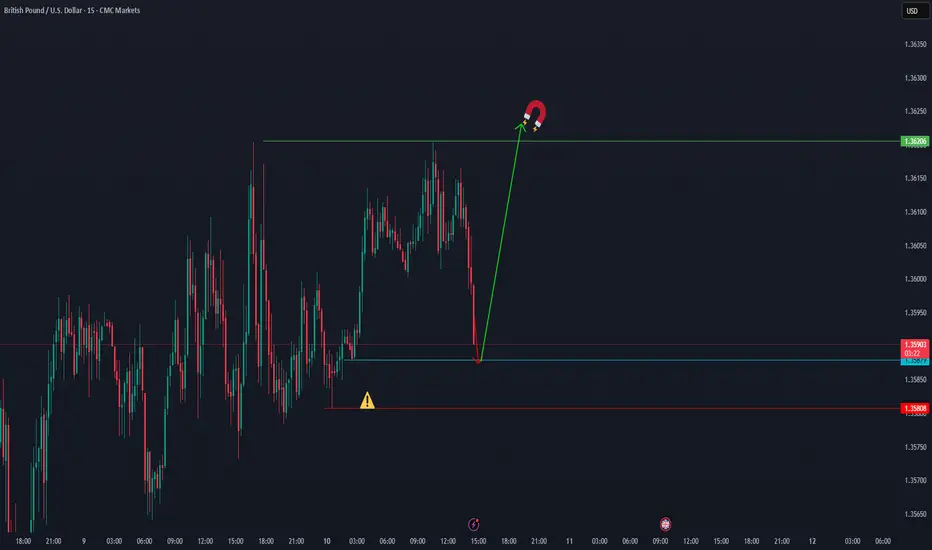
GU - Longs📉📈 GBPUSD 15min – ELFIEDT RSI + Reversion Catches the Knife
🧠 Precision Signal | Zero Delay | Real Trade Example
The ELFIEDT RSI + Reversion indicator once again proves its edge — this time on a sharp GBPUSD selloff, where it called the bottom within a single bar of the low.
🟩 Perfect “UP” Signal After Flash Crash
During the NY session, GBPUSD experienced a sudden and aggressive selloff, dropping nearly 80 pips within a few candles.
While many traders panic or chase the move, the indicator calmly printed a high-conviction UP signal at the bottom wick of the final dump candle.
🔹 Hypothetical Trade Idea:
Entry: On candle close after the UP signal
Stop-loss: Just a few pips below the signal wick (tight risk)
Reward: Price rallied over 100 pips in the following hours — perfect mean reversion setup with minimal drawdown
✅ No delay.
✅ No repaint.
✅ No guesswork.
🔍 Why It Matters
Most indicators react late — this one anticipated exhaustion right at the turn.
The result: a low-risk, high-reward setup, spotted live, not in hindsight.
💼 Want access to more advanced versions?
This is only the public edition of ELFIEDT RSI + Reversion.
Advanced builds include:
Multi-timeframe confirmation
RSI trendline breakouts
Hidden divergences
3SD band expansions
Smart signal stacking logic
📩 Message now to apply for access — limited seats for serious traders only.
#GBPUSD #ReversalTrade #ELFIEDT #SmartSignals #ForexTrading #15mChart #MeanReversion #PrecisionTools #TradingView

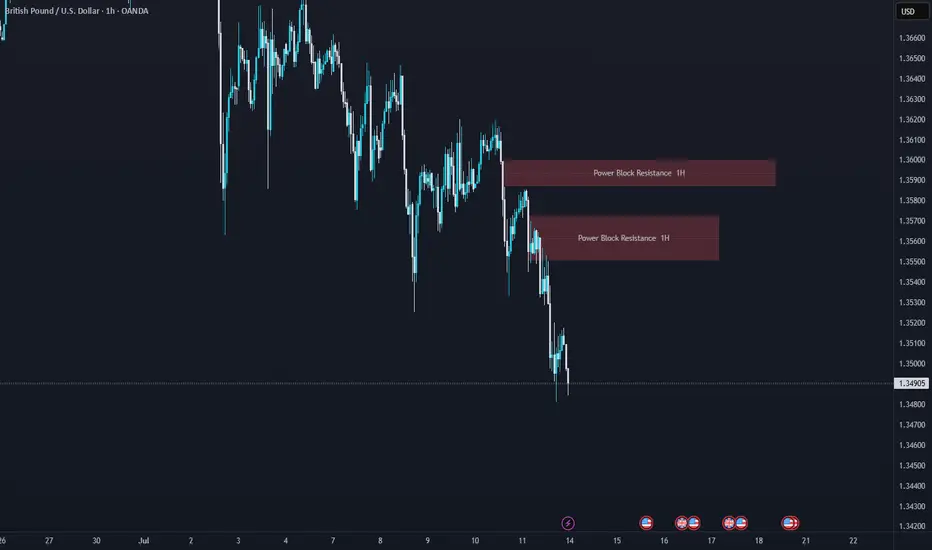
GBPUSD Resistance Ahead!
HI,Traders !
#GBPUSD made a rebound
From the support and went
Up but will now retest a
Local horizontal level
Of 1.36793 from where
We will be expecting
A local bearish reaction !
Comment and subscribe to help us grow !

GBP/USD Poised for Fifth Daily Decline- Support in ViewThe Sterling rally failed to close above confluent trend resistance at the 2022 high near 1.3749 with GBP/USD now off more than 1.8% from the monthly / yearly high. The July opening-range seems set here at 1.3530-1.3750 and the focus is on a breakout in the days ahead with the broader outlook still constructive while within this formation.
GBP/USD is testing support today at the 61.8% retracement of the late-June advance at 1.3530 with the weekly opening-range preserved just above. Initial resistance eyed along this short-term channel with breach above the objective weekly open at 1.3645 needed to shift the focus back towards the 2022 high at 1.3749- a daily close above this level is still needed to mark uptrend resumption. Subsequent resistance objective eyed at the 100% extension of the January advance at 1.3816 and the 61.8% extension of the broader 2022 advance at 1.4003.
A break lower exposes key support at the 61.8% retracement of the May rally / 2024 high-day close (HDC) at 1.3388-1.3415. A break / close below this slope would suggest a more significant high was registered last week / a larger reversal is underway with initial support seen at the May low-day close (LDC) at 1.3176.
Bottom line: A reversal from trend resistance threatens a larger correction within the broader GBP/USD uptrend. The immediate focus is on a breakout of the weekly opening-range for guidance. From a trading standpoint, losses would need to be limited to 1.3388 IF Sterling is heading higher on this stretch with a close above 1.3749 ultimately needed to mark uptrend resumption.
-MB

GBPUSD SHORTWe have a break of structure. we waiting for a fair value gap on lower time frame in order to sell to those zone. lets wait and see how it goes

Bearish drop for the Cable?The price is rising towards the pivot and could drop to the 1st support which is a pullback support.
Pivot: 1.3632
1st Support: 1.3503
1st Resistance: 1.3693
Risk Warning:
Trading Forex and CFDs carries a high level of risk to your capital and you should only trade with money you can afford to lose. Trading Forex and CFDs may not be suitable for all investors, so please ensure that you fully understand the risks involved and seek independent advice if necessary.
Disclaimer:
The above opinions given constitute general market commentary, and do not constitute the opinion or advice of IC Markets or any form of personal or investment advice.
Any opinions, news, research, analyses, prices, other information, or links to third-party sites contained on this website are provided on an "as-is" basis, are intended only to be informative, is not an advice nor a recommendation, nor research, or a record of our trading prices, or an offer of, or solicitation for a transaction in any financial instrument and thus should not be treated as such. The information provided does not involve any specific investment objectives, financial situation and needs of any specific person who may receive it. Please be aware, that past performance is not a reliable indicator of future performance and/or results. Past Performance or Forward-looking scenarios based upon the reasonable beliefs of the third-party provider are not a guarantee of future performance. Actual results may differ materially from those anticipated in forward-looking or past performance statements. IC Markets makes no representation or warranty and assumes no liability as to the accuracy or completeness of the information provided, nor any loss arising from any investment based on a recommendation, forecast or any information supplied by any third-party.

check the trendIt is expected that a trend change will form within the current support range and we will witness the start of an upward trend.
If the price breaks through the support range, a continuation of the downward trend will be likely.
GBPUSD Bank of England (BoE) Bank Rate
Current Rate: 4.25% ,the 10 year bond yield GB10Y =4.632%
The BoE reduced its base rate from 4.50% to 4.25% in May 2025 and has maintained it at 4.25% since then (including the June 19, 2025 meeting).
The Monetary Policy Committee (MPC) has signaled a likely gradual easing path with expectations of a 25 basis point cut possibly at the August 7, 2025 meeting, potentially bringing the rate down to around 4.00%.
The BoE’s decision reflects easing inflation pressures as inflation stands at 3.4% but remains cautious due to ongoing economic uncertainties and inflation still above target.
Federal Reserve (Fed) Funds Rate
Current Rate: Approximately 4.50%-4.25% (mid-2025 consensus)
The united state 10 year government bond yield US10Y=4.407%
The Fed has held rates steady at around 4.50% -4.25%, with markets expecting a cautious approach to rate cuts amid inflation concerns and economic data.
The Fed’s policy remains more restrictive compared to the BoE, though some easing is anticipated later in 2025 depending on inflation and growth.
Context
bond yield differential
GB10Y-US10Y=4.632%-4.407%= 0.225% advantage for carry traders in favour GBP.
Interest rate differential
GBP IRT-USD IRT= 4.25%-4.5%=-0.25% ,The Fed rate is about 0.25 percentage points higher than the BoE rate, giving a slight interest rate advantage to the USD over GBP at the short-term policy rate level.
Carry Trade Impact
The carry trade involves borrowing in a currency with a lower interest rate and investing in a currency with a higher rate to earn the spread.
Despite the Fed’s slightly higher policy rate, the BoE’s historically higher rates earlier in 2025 and expectations of a slower pace of Fed cuts have supported GBP carry trades.
The interest rate differential is relatively narrow, so carry trade flows are moderate but still contribute to demand for GBP assets.
The bond yield differential slightly favors GBP at 4.632% gb10y as against USD 4.407% , attracting fixed-income capital to uk treasury giving gbp short term advantage.
#GBPUSD

short idea!hi all. after hitting to a WA and reversing, market needs an LOZ to go lower more. be careful and use your conformation before entering. be happy(wink)

Bullish bounce?The Cable (GBP/USD) has bounced off the pivot and oculd rise to the 1st resistance which is a an overlap resistance.
Pivot: 1.3531
1st Support: 1.3423
1st Resistance: 1.3675
Risk Warning:
Trading Forex and CFDs carries a high level of risk to your capital and you should only trade with money you can afford to lose. Trading Forex and CFDs may not be suitable for all investors, so please ensure that you fully understand the risks involved and seek independent advice if necessary.
Disclaimer:
The above opinions given constitute general market commentary, and do not constitute the opinion or advice of IC Markets or any form of personal or investment advice.
Any opinions, news, research, analyses, prices, other information, or links to third-party sites contained on this website are provided on an "as-is" basis, are intended only to be informative, is not an advice nor a recommendation, nor research, or a record of our trading prices, or an offer of, or solicitation for a transaction in any financial instrument and thus should not be treated as such. The information provided does not involve any specific investment objectives, financial situation and needs of any specific person who may receive it. Please be aware, that past performance is not a reliable indicator of future performance and/or results. Past Performance or Forward-looking scenarios based upon the reasonable beliefs of the third-party provider are not a guarantee of future performance. Actual results may differ materially from those anticipated in forward-looking or past performance statements. IC Markets makes no representation or warranty and assumes no liability as to the accuracy or completeness of the information provided, nor any loss arising from any investment based on a recommendation, forecast or any information supplied by any third-party.

Bullish bounce?GBP/USD has bounced off the support level which is a pullback support that aligns with the 61.8% Fibonacci retracement and could rise from this level too ur take profit.
Entry: 1.3531
Why we like it:
There is a pullback support level that aligns with the 61.8% Fibonacci retracement.
Stop loss: 1.3450
Why we like it:
There is a pullback support level that lines up with the 78.6% Fibonacci retracement.
Take profit: 1.3688
Why we like it:
There is an overlap resistance level that aligns with the 61.8% Fibonacci retracement.
Enjoying your TradingView experience? Review us!
Please be advised that the information presented on TradingView is provided to Vantage (‘Vantage Global Limited’, ‘we’) by a third-party provider (‘Everest Fortune Group’). Please be reminded that you are solely responsible for the trading decisions on your account. There is a very high degree of risk involved in trading. Any information and/or content is intended entirely for research, educational and informational purposes only and does not constitute investment or consultation advice or investment strategy. The information is not tailored to the investment needs of any specific person and therefore does not involve a consideration of any of the investment objectives, financial situation or needs of any viewer that may receive it. Kindly also note that past performance is not a reliable indicator of future results. Actual results may differ materially from those anticipated in forward-looking or past performance statements. We assume no liability as to the accuracy or completeness of any of the information and/or content provided herein and the Company cannot be held responsible for any omission, mistake nor for any loss or damage including without limitation to any loss of profit which may arise from reliance on any information supplied by Everest Fortune Group.
