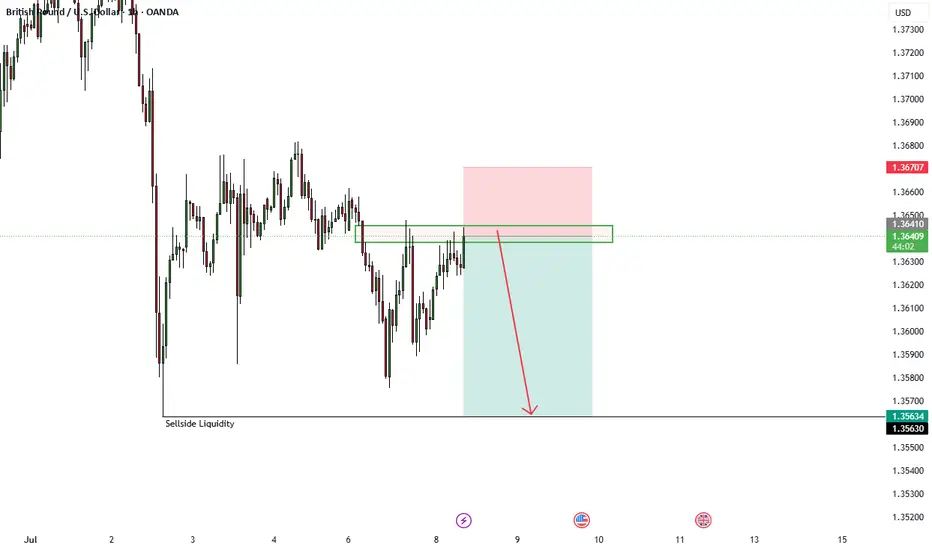
Bearish drop?GBP/USD has rejected off the resistance level which is a pullback resistance and could drop from this level to our take profit.
Entry: 1.3636
Why we like it:
There is a pullback resistance.
Stop loss: 1.3683
Why we like it:
There is a pullback resistance.
Take profit: 1.3604
Why we like it:
There is a pullback support level that aligns with the 78.6% Fibonacci projection.
Enjoying your TradingView experience? Review us!
Please be advised that the information presented on TradingView is provided to Vantage (‘Vantage Global Limited’, ‘we’) by a third-party provider (‘Everest Fortune Group’). Please be reminded that you are solely responsible for the trading decisions on your account. There is a very high degree of risk involved in trading. Any information and/or content is intended entirely for research, educational and informational purposes only and does not constitute investment or consultation advice or investment strategy. The information is not tailored to the investment needs of any specific person and therefore does not involve a consideration of any of the investment objectives, financial situation or needs of any viewer that may receive it. Kindly also note that past performance is not a reliable indicator of future results. Actual results may differ materially from those anticipated in forward-looking or past performance statements. We assume no liability as to the accuracy or completeness of any of the information and/or content provided herein and the Company cannot be held responsible for any omission, mistake nor for any loss or damage including without limitation to any loss of profit which may arise from reliance on any information supplied by Everest Fortune Group.
GBPUSD trade ideas

Bullish continuation?The Cable (GBP?USD) is falling towards the pivot and could bounce to the 1st resistance.
Pivot: 1.3426
1st Support: 1.3170
1st Resistance: 1.3758
Risk Warning:
Trading Forex and CFDs carries a high level of risk to your capital and you should only trade with money you can afford to lose. Trading Forex and CFDs may not be suitable for all investors, so please ensure that you fully understand the risks involved and seek independent advice if necessary.
Disclaimer:
The above opinions given constitute general market commentary, and do not constitute the opinion or advice of IC Markets or any form of personal or investment advice.
Any opinions, news, research, analyses, prices, other information, or links to third-party sites contained on this website are provided on an "as-is" basis, are intended only to be informative, is not an advice nor a recommendation, nor research, or a record of our trading prices, or an offer of, or solicitation for a transaction in any financial instrument and thus should not be treated as such. The information provided does not involve any specific investment objectives, financial situation and needs of any specific person who may receive it. Please be aware, that past performance is not a reliable indicator of future performance and/or results. Past Performance or Forward-looking scenarios based upon the reasonable beliefs of the third-party provider are not a guarantee of future performance. Actual results may differ materially from those anticipated in forward-looking or past performance statements. IC Markets makes no representation or warranty and assumes no liability as to the accuracy or completeness of the information provided, nor any loss arising from any investment based on a recommendation, forecast or any information supplied by any third-party.

GBP/USD : First Long, Then SHORT! (READ THE CAPTION)By analyzing the GBP/USD chart on the 4-hour timeframe, we can see that the price is currently trading around 1.3625. I expect a new Fair Value Gap (FVG), formed by the recent sharp drop, to be filled soon.
The first target for this potential move is 1.3650, with the next bullish zone between 1.3670 and 1.3730.
Supply and demand zones are marked on the chart — keep a close eye on how the price reacts to these key levels!
Please support me with your likes and comments to motivate me to share more analysis with you and share your opinion about the possible trend of this chart with me !
Best Regards , Arman Shaban

GBPUSD breakout still walid? Why I’d wait before buyingGBPUSD broke out of a key double top but pulled back sharply. In this video, we revisit the setup and explain why a deeper dip might offer better risk-reward. We also look at EURUSD's trend and how it could impact GBPUSD timing.
This content is not directed to residents of the EU or UK. Any opinions, news, research, analyses, prices or other information contained on this website is provided as general market commentary and does not constitute investment advice. ThinkMarkets will not accept liability for any loss or damage including, without limitation, to any loss of profit which may arise directly or indirectly from use of or reliance on such information.

GBPUSD → Correction before the bullish trend continuesFX:GBPUSD is forming a trading range for consolidation of potential ahead of a possible continuation of growth as part of a countertrend correction.
The dollar is trying to recover from its decline due to a local change in the fundamental background, but the global trend for the DXY is bearish. This could provide support for the GBP to continue growing, provided that the bulls hold their defense above the 0.5 Fibonacci zone of the main impulse movement.
The market is holding GBPUSD within the trading range of 1.359 - 1.3675. The trend is bullish, and within the correction, liquidity may be captured from 1.359 before further growth.
Resistance levels: 1.3675, 1.3764
Support levels: 1.359, 1.3511
If the reaction to the subsequent retest of support at 1.359 is weak, we can consider a continuation of the correction to the 0.7-0.79 Fibonacci zone, which would be the most favorable entry point for us (focus on 1.3511 — a false breakout will increase interest in buying). In the current situation, the focus is on 1.359.
Best regards, R. Linda!

Cable looking for a new high with Ending DiagonalCable found some support in the last 24 hours and it looks like we may still see a retest of the high, so apparently this 5th wave is still in progress but unfolding with an ending diagonal with subwave five on the way up to 1.37–1.38, which could be the key resistance for this reversal pattern. So despite some recovery that is happening right now, we still think that the impulse from January is in late stages, which is also confirmed by divergence on the RSI and overlapping price action that clearly suggests that bulls are losing strength up here.
GH

Triangle Formation (Rising wedge STF) I believe we can see some downside here. Price has bounced of the 61.8 fib level and looks to have created a triangle pattern. I’m not currently in any positions, I will wait for a breakout of the rising wedge for a short position.

GBPUSD Short idea! Yes, we're bullish on the Daily timeframe. This is a continuation of the 4H bearish pullback. For me, we're not far enough into the discount leg of the daily swing. I'd like to see some of those hefty imbalances get filled first.
Risky, given that we've only wicked that recent 4H swing low, so waiting for 15m confirmation within that 1H extreme OB. Targeting the 4H swing low for a 2.5RR.
We could switch up, and rally up now, but the DXY is showing some more potential upside strength in the short term. So, this aligns well with my notion of more GBP downside, ahead of the next rally up!

GBP/USD Short Idea Analysis : GBP/USD is approaching a critical resistance zone between 1.37850 and 1.38800 on the daily timeframe, presenting a potential short opportunity based on technical and fundamental factors.
Technical Analysis:
Price Action: The 1.37850–1.38800 zone aligns with prior highs and a strong resistance area, likely to trigger rejection or a bearish reversal pattern (e.g., double top or bearish engulfing).
Support/Target: Initial support at 1.3700, with a deeper target at 1.3600 if bearish momentum builds.
Indicators: RSI is approaching overbought territory (near 70), signaling potential exhaustion. MACD shows slowing bullish momentum, supporting a short bias.
Fibonacci: The 1.37850–1.38800 zone coincides with the 76.4%–88.6% Fibonacci retracement of the prior downmove, reinforcing resistance.
Fundamental Context:
UK economic data (e.g., weaker retail sales or PMI) suggests GBP vulnerability. Meanwhile, USD strength is bolstered by hawkish Fed expectations and resilient US economic indicators.
Risks: A breakout above 1.3900 could invalidate the setup. Monitor BoE rhetoric and US data releases for sudden shifts.
Conclusion: The 1.37850–1.38800 resistance zone offers a high-probability short setup for GBP/USD, supported by technical resistance and USD-favorable fundamentals. Use strict risk management due to potential volatility.

GBPUSD 1:2.64 R Trade Idea - 1hr Liquidity Sweep - ICTBeautiful 1:2.64 Trade Idea for a short on GPBUSD, aiming for the 1hr low to take out the 1hr SS Liquidity
GBP/USD 4-hour timeframe with a clear bearish trend currently in📍 Key Levels Noted
Resistance Zone: Around 1.35895 – 1.36053
Fair Value Gap Fill Zone: 1.35304 – 1.35575
Demand Area: 1.34928 – 1.35003
Major trendline break would invalidate the bearish structure.

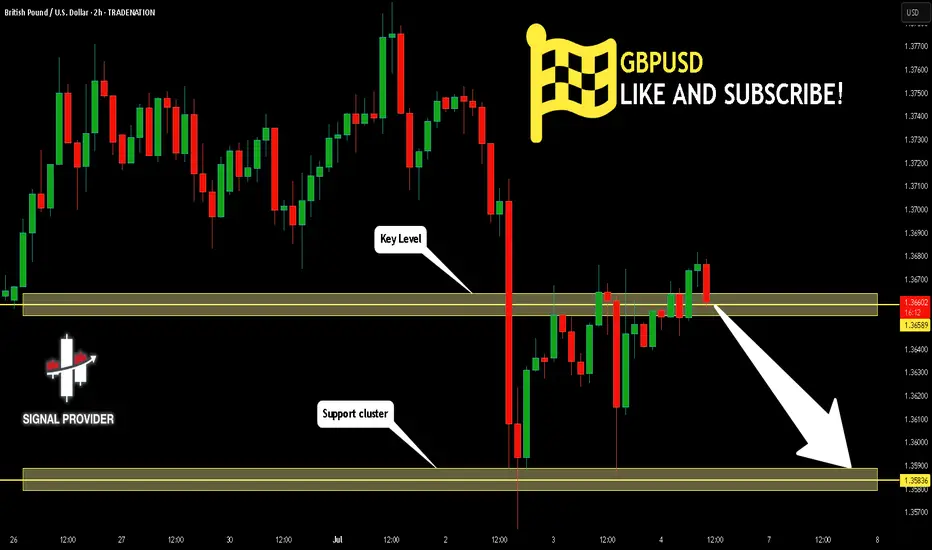
GBPUSD Will Go Lower! Sell!
Take a look at our analysis for GBPUSD.
Time Frame: 2h
Current Trend: Bearish
Sentiment: Overbought (based on 7-period RSI)
Forecast: Bearish
The market is testing a major horizontal structure 1.365.
Taking into consideration the structure & trend analysis, I believe that the market will reach 1.358 level soon.
P.S
Overbought describes a period of time where there has been a significant and consistent upward move in price over a period of time without much pullback.
Disclosure: I am part of Trade Nation's Influencer program and receive a monthly fee for using their TradingView charts in my analysis.
Like and subscribe and comment my ideas if you enjoy them!
GBPUSD📌 GBPUSD – Scenario-Based Plan
The first level I’ve marked is a short-term zone.
If we get a strong buy signal there with good R/R, I’ll enter and trail aggressively.
The second level is a stronger demand zone and a better area for potential long setups.
❗️Remember: These are just scenarios — not predictions.
We stay ready for whatever the market delivers.

SHORT GBPUSDshorting gbpusd after the short term long into the higher tf poi and waiting for confirmation to short

GBPUSD TECHNICAL & ORDER FLOW ANALYSISOur analysis is based on a multi-timeframe top-down approach and fundamental analysis.
Based on our assessment, the price is expected to return to the monthly level.
DISCLAIMER: This analysis may change at any time without notice and is solely intended to assist traders in making independent investment decisions. Please note that this is a prediction, and I have no obligation to act on it, nor should you.
Please support our analysis with a boost or comment!

GBPUSD buy opportunity It is time to buy GBPUSD with 1% risk. it is coming from a strong support area and nice rejection as well.

GBPUSD forming bearish trend in 1 hour time frameGBPUSD forming bearish trend in 1 hour time frame.
Market is forming lower low which shows indicates bearish trend.
Price is also forming Bearish flag pattern.
Market is expected to remain bearish in upcoming trading sessions.
On lower side market can hit the target levels of 1.35800 & 1.35100.
On higher side market may test the resistance level of 1.37900.

GBPUSD Expected Growth! BUY!
My dear friends,
GBPUSD looks like it will make a good move, and here are the details:
The market is trading on 1.3557 pivot level.
Bias - Bullish
Technical Indicators: Supper Trend generates a clear long signal while Pivot Point HL is currently determining the overall Bullish trend of the market.
Goal - 1.3657
Recommended Stop Loss - 1.3503
About Used Indicators:
Pivot points are a great way to identify areas of support and resistance, but they work best when combined with other kinds of technical analysis
Disclosure: I am part of Trade Nation's Influencer program and receive a monthly fee for using their TradingView charts in my analysis.
———————————
WISH YOU ALL LUCK


GBPUSD: Market of Sellers
The analysis of the GBPUSD chart clearly shows us that the pair is finally about to tank due to the rising pressure from the sellers.
Disclosure: I am part of Trade Nation's Influencer program and receive a monthly fee for using their TradingView charts in my analysis.
❤️ Please, support our work with like & comment! ❤️

Intraday Drop into Support Zone — Can GBP/USD Bounce?Hi everyone,
GBP/USD continues to consolidate below the 1.36850 level. Price failed to break above and moved lower into the 1.35300–1.34600 zone, providing us with a clean intraday trade setup.
A drop into this area was highlighted as the more probable short‑term path, and we’re now looking for GBP/USD to find support in this region; and more importantly, to hold above the 1.33800 level to form the base for another push higher.
As previously noted, a decisive break above 1.37500 would renew our expectation for further upside, with the next key target around 1.38400. We'll be monitoring price action closely to see how it unfolds.
We’ll continue to provide updates on the projected path for GBP/USD as price approaches this target.
The longer-term outlook remains bullish, and we expect the rally to continue extending further from the 1.20991 January low towards 1.40000 and 1.417000.
We’ll be keeping you updated throughout the week with how we’re managing our active ideas. Thanks again for all the likes/boosts, comments and follows — we appreciate the support!
All the best for the week ahead. Trade safe.
BluetonaFX

GBP/USD💰Symbol: { GBP/USD }
🟩Price: { 1.36990 }
🟥Stop: { 1.37826 }
1️⃣profit: { 1.36536 }
2️⃣profit: { 1.35912 }
3️⃣profit: { 1.35116 }
4️⃣profit: { 1.34483 }
5️⃣profit: { 1.33859 }
📊Check your chart before entering.
🚨Check before use to make sure there is no important news.🚨

GBPUSD Sell analysis/ideaThis analysis is based on the daily and 4-hour timeframes and executed using reversal trading and trend formation. Complete explanation in the video!
