British Pound / U.S. Dollar forum
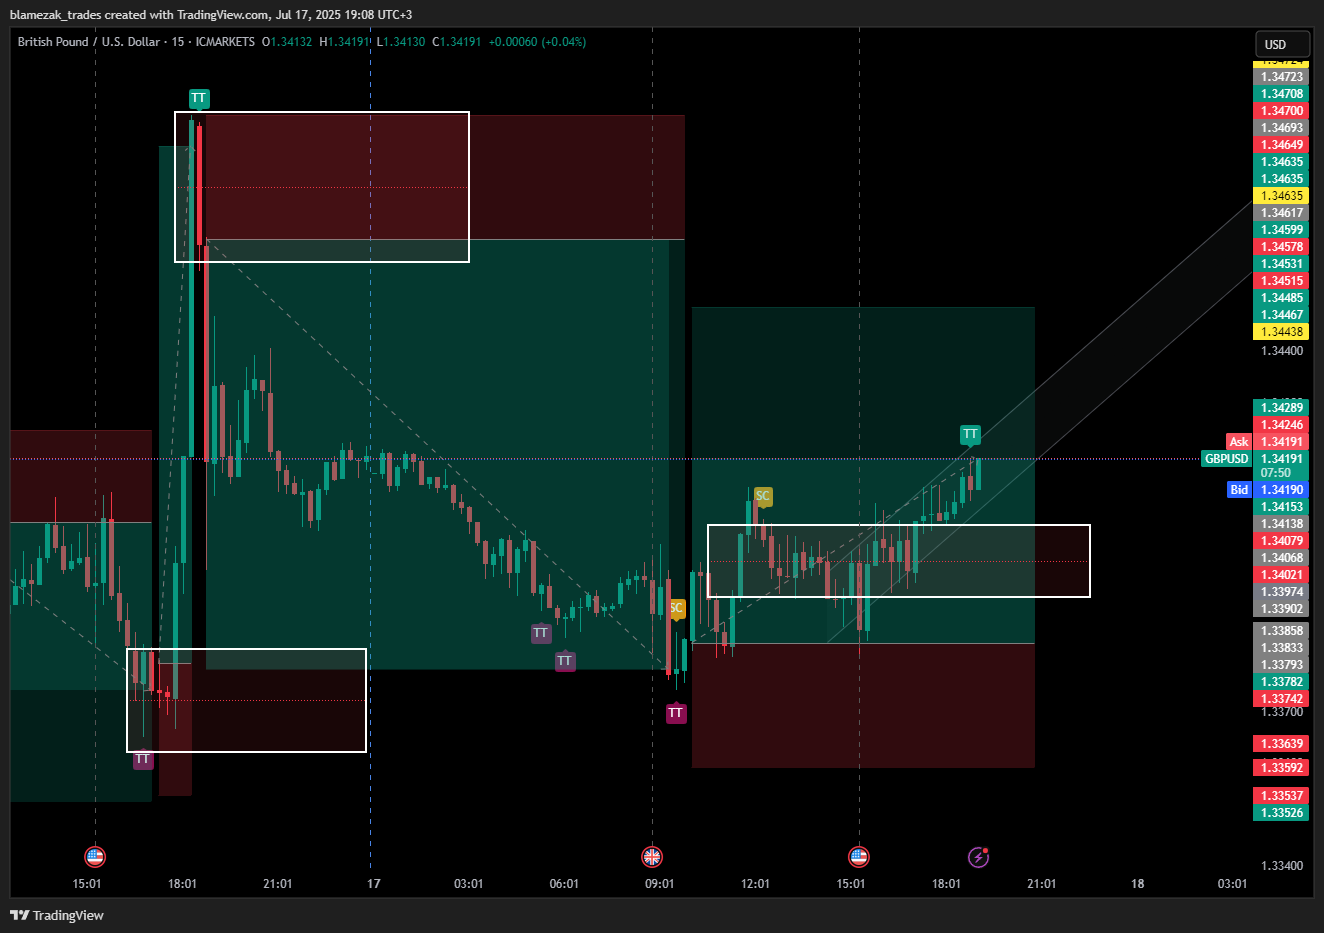
At this point, momentum and volume is the key to decide your entry.
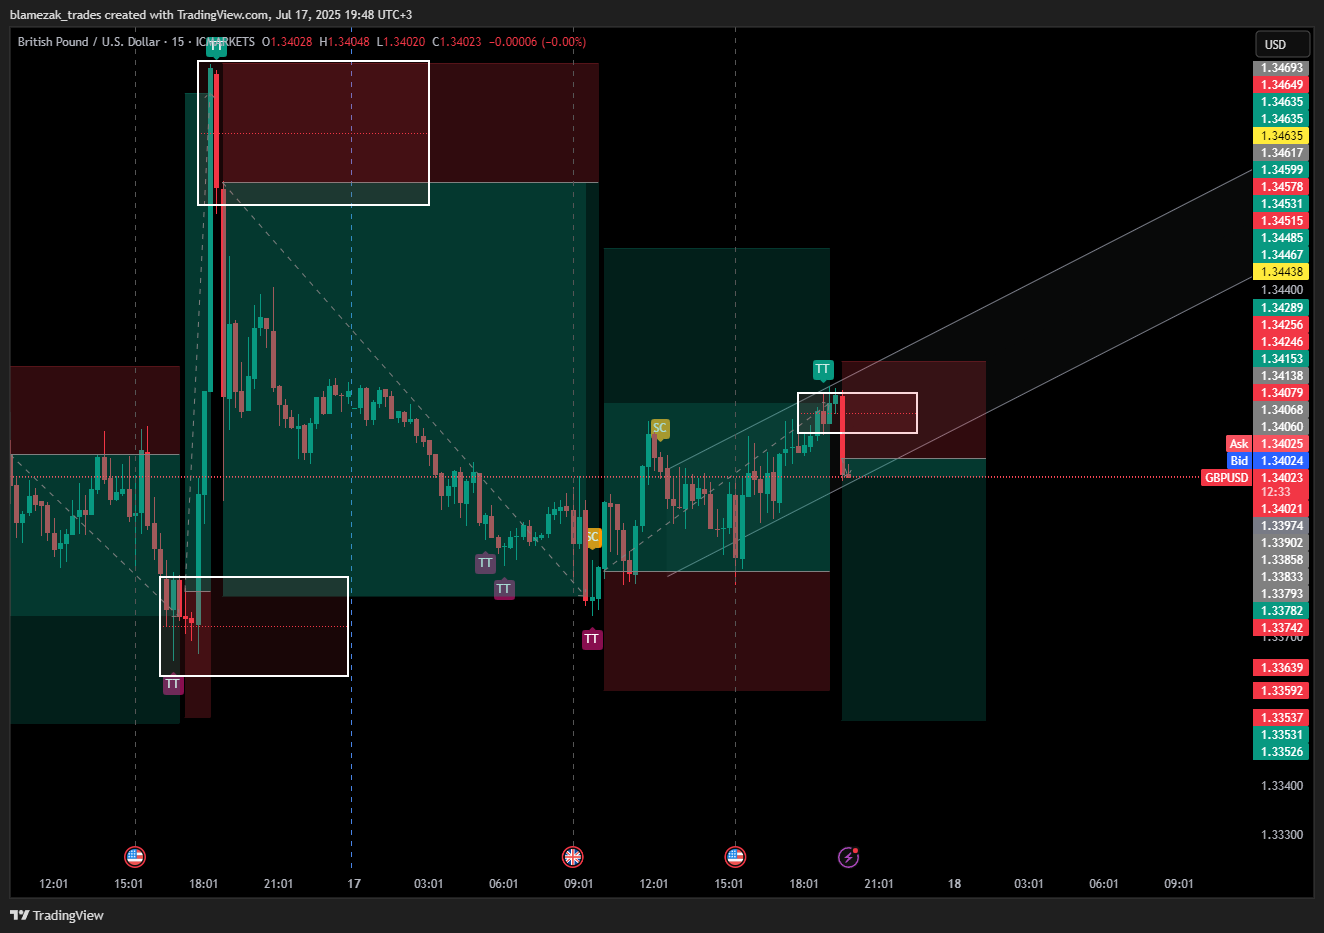
Our POS from 3+ Hrs is going well for now, but this is a area where decisions need to be taken. Where decision is taken we don't leave much on the table and fill our bags at any possible time.