The 3 Step Rocket Booster Strategy – Bullish Setup BreakdownHey traders!
Here’s a trade idea on GBP/USD using a multi-timeframe trend strategy I call the Rocket Booster Strategy. It’s based on trend strength, oscillator signals, and price action confirmation.
---
📊 Weekly Chart – The Big Picture
The Stochastic RSI on the weekly chart recently pulled back near the 80 zone. This isn’t a reversal — it’s a healthy pause in a strong uptrend. I’m watching for a breakout continuation as momentum builds up.
---
📉 Daily Chart – Oversold Alert
On the daily chart, the Stochastic RSI dropped below 20, signaling that GBPUSD might be ready for a bullish reversal. It’s setting the stage for a solid long opportunity — as long as the trend agrees.
---
🕯 4H Chart – Bullish Engulfing Entry
This is where it gets exciting — a clear Bullish Engulfing pattern has formed on the 4-hour chart. That’s my entry trigger. This confirms the reversal idea with a strong price action signal.
---
✅ Rocket Booster Strategy Criteria
To take a long trade using this strategy, I require all 3 of the following:
1. ✅ Price is above the 50 EMA
2. ✅ Price is above the 200 EMA
3. ✅ A breakout or gap-up is either happening or imminent
All three conditions are currently aligning on GBPUSD — this is a potential high-probability setup.
---
💡 Optional Tip for Automation
If you’d like to automate this entry using alerts on TradingView, you’ll need a paid monthly plan to unlock multiple alerts and advanced conditions like candlestick detection or EMA confirmation.
---
⚠️ Disclaimer
Trading is risky. Always use:
Proper risk management
Well-placed stop-losses
A demo account to test your strategy
And take profits with discipline 🧠💰
---
🔚 Final Thoughts
This is a clean example of trend trading with structure and precision.
I used multi-timeframe analysis, the Stochastic RSI, and price action to time the entry. If you're learning trading, this is a great case to study or test in your journal.
Let me know what you think or how you'd manage this trade.
Happy trading! 📈💥
---
GBPUSD_SPT trade ideas

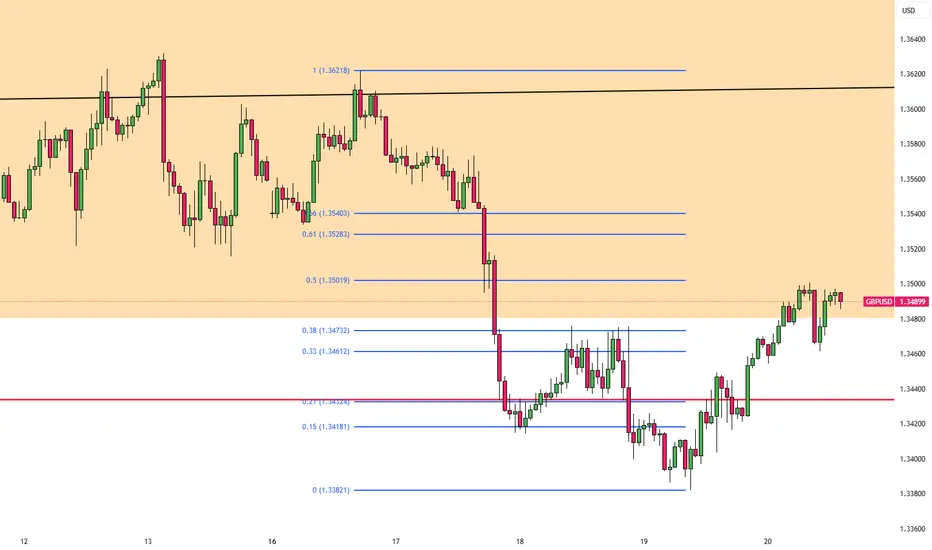
GBPUSD London Session | Live Forex Analysis & Trade ideasIn today’s London session, we conducted a detailed intraday analysis on the GBPUSD currency pair using wave structure analysis on the 5-minute (M5) timeframe.
Price action confirmed a break below bullish market structure that had previously formed the Asian session high, signalling a potential shift in market sentiment to the downside. This breakdown confirmed short-term bearish momentum shift.
Following the completion of the bearish wave, the price retraced to form a structural pullback (trend reset), providing a discounted price zone for new short positions and offering profit-taking opportunities for earlier sellers.
Our trading plan for this session is to sell GBPUSD at 1.3488, anticipating a move below the midline (ML) support at 1.3462. The technical target for this trade, based on our London-New York session projection, is set at 1.3417.
The stop-loss for this setup is placed above MH of the bearish structure at 1.3505, maintaining proper risk management.
This trade idea aligns with our trend-following strategy and is supported by real-time price action analysis.
📉 Short Bias Confirmed
🎯 Entry: 1.3488
🛑 Stop Loss: 1.3505
✅ Take Profit: 1.3417
Trade safe, manage your risk, and stay blessed.

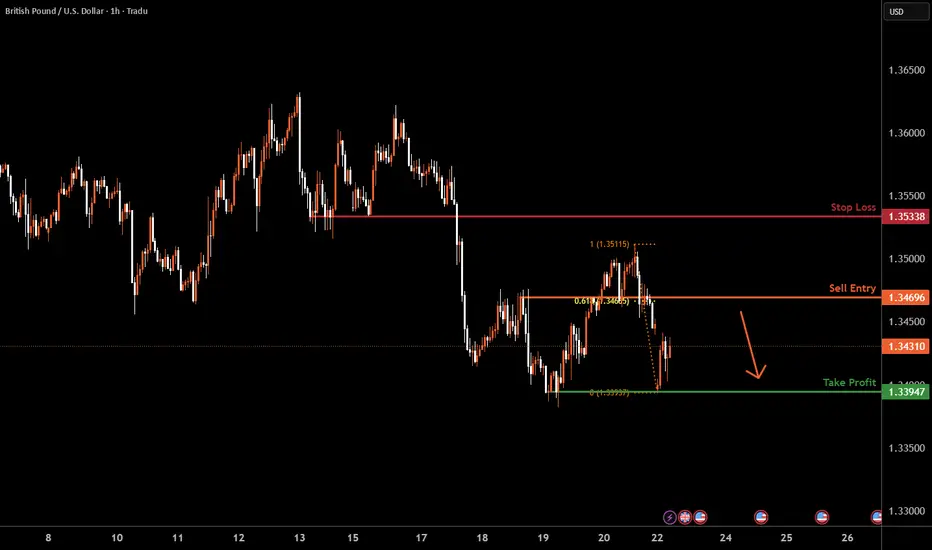
GBPUSD H1 I Bearish Reversal Based on the H4 chart, the price is rising our sell entry level at 1.3469, a pullback resistance that aligns with the 61.8% Fib retracement.
Our take profit is set at 1.3394, a swing low support.
The stop loss is set at 1.3533, a pullback resistance.
High Risk Investment Warning
Trading Forex/CFDs on margin carries a high level of risk and may not be suitable for all investors. Leverage can work against you.
Stratos Markets Limited (tradu.com ):
CFDs are complex instruments and come with a high risk of losing money rapidly due to leverage. 63% of retail investor accounts lose money when trading CFDs with this provider. You should consider whether you understand how CFDs work and whether you can afford to take the high risk of losing your money.
Stratos Europe Ltd (tradu.com ):
CFDs are complex instruments and come with a high risk of losing money rapidly due to leverage. 63% of retail investor accounts lose money when trading CFDs with this provider. You should consider whether you understand how CFDs work and whether you can afford to take the high risk of losing your money.
Stratos Global LLC (tradu.com ):
Losses can exceed deposits.
Please be advised that the information presented on TradingView is provided to Tradu (‘Company’, ‘we’) by a third-party provider (‘TFA Global Pte Ltd’). Please be reminded that you are solely responsible for the trading decisions on your account. There is a very high degree of risk involved in trading. Any information and/or content is intended entirely for research, educational and informational purposes only and does not constitute investment or consultation advice or investment strategy. The information is not tailored to the investment needs of any specific person and therefore does not involve a consideration of any of the investment objectives, financial situation or needs of any viewer that may receive it. Kindly also note that past performance is not a reliable indicator of future results. Actual results may differ materially from those anticipated in forward-looking or past performance statements. We assume no liability as to the accuracy or completeness of any of the information and/or content provided herein and the Company cannot be held responsible for any omission, mistake nor for any loss or damage including without limitation to any loss of profit which may arise from reliance on any information supplied by TFA Global Pte Ltd.
The speaker(s) is neither an employee, agent nor representative of Tradu and is therefore acting independently. The opinions given are their own, constitute general market commentary, and do not constitute the opinion or advice of Tradu or any form of personal or investment advice. Tradu neither endorses nor guarantees offerings of third-party speakers, nor is Tradu responsible for the content, veracity or opinions of third-party speakers, presenters or participants.

Bearish GBP/USD Outlook: Shorting the Pound Against the DollarI can write a lot of text here but let make it short, liek and sub from you for that:
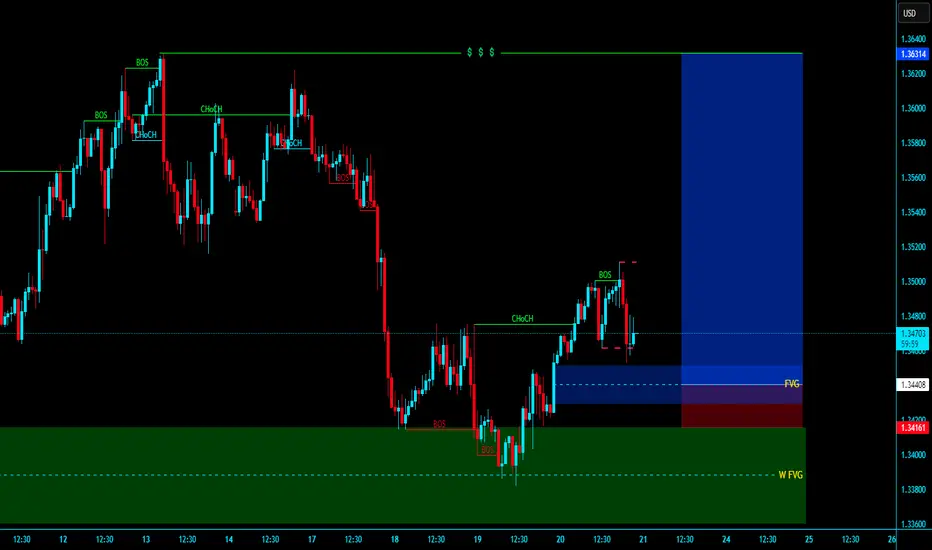
3 options:
pump till PDH then dump to weekly FVG 1.34 area
dump from here till weekly FVG 1.34 area
if it breaks above PWH with good volume and closing at least on 4h then only longs

GBPUSD TRADE SETUPWait for retest the entry level then take a trade for Sell othewise skip this setup

GBP/USD H4 AnalysisPrice has broken below the daily trendline, where it found support on four separate occasions.
When retesting the trendline last week, price appeared to reject with 2 consecutive 4 hour bearish candles.
If you agree with this analysis then look for a sell setup that meets your strategy rules.

Weekly Market Analysis
This is my Weekly Analysis for GBPUSD using volume profile, price action and ICT hybrid.

-0.5% Week | A Tough Reminder: Risk Management is EverythingFirst trade hit 2R , exited early due to the bank holiday.
Next day, I gave it all back. 3 stop-losses. Poor risk management .
I got overconfident after being in profit and paid the price.
Also realized mobile tools (like SL placement on TradingView app) can hurt if not set up right.
Last week was +6% with strict risk rules.
This week? A reminder that trading is 90% mindset and discipline.
Lessons:
• Protect your capital, always.
• Don’t loosen your rules after a win.
• Your edge only works if you follow your plan.
Stay disciplined. Survive the noise. Let your edge play out.

NEXT WEEK CHECK GBPUSD SIGNAL READ CAPTAINEntry: around 1.34490) 1.34390✅
Take Profit 1.34100 ✅
Take Profit 2:1.33740 ✅
Last Target:1.33340✅
Stop Loss: 1.34800❌

GBPUSDFor this pair my bias is leaning to the sellers making there way into the market for the upcoming week june 23-june 27 week ahead we have several news factors that could affect the market also the on going war in the middle east

# GBPUSD WEEKLY FVG MITIGATED AND MSS ENTYR IN FVG # GBPUSD Weekly FVG Mitigated and mss our entry in fvg and target is our BSL
GU SHORTSo start from DXY >Bullish on Daily and was Daily FVG that Daily FVG after close of 4H candle in N-Y session that led me to think that Daily FVG will BE break way gap
So take a trade on GU after starting to see Luck of creating FVG to the upside in 4H
In 15 minutes, I just entered, and my SL was above 1H IFVG

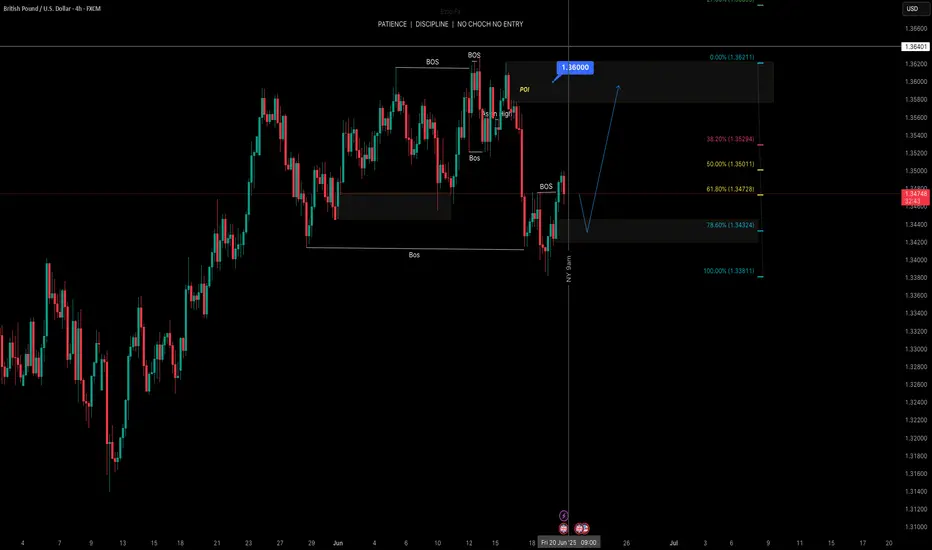
GBP/USD Daily Chart Analysis – June 20, 2025📉 GBP/USD Daily Chart Analysis – June 20, 2025 📊
📌 Chart Overview:
The GBP/USD pair is currently experiencing a critical technical phase. After a strong bullish rally from January 2025, price action has approached a key resistance level near the 1.3600 zone. Here's the detailed breakdown:
🟦 Key Highlights:
🔹 Resistance Zone 💥
Price is testing a major horizontal resistance between 1.3450 – 1.3600. This area has acted as a supply zone where sellers are currently active.
🔹 Trendline Support 🔺
A long-standing bullish trendline, active since early 2025, has been retested multiple times, confirming the trend’s strength.
🔹 Retest in Progress 🔄
Price recently pulled back after hitting the resistance and is now retesting the broken trendline, indicating a potential shift in trend if the trendline fails to hold.
🔹 Fake Breakout ⚠️
An earlier attempt to break below the trendline in April turned out to be a false breakout, which fueled bullish continuation. A similar scenario could be developing.
📊 Technical Outlook:
📈 If price breaks and closes above 1.3600, it would indicate strong bullish momentum and could open doors toward new highs.
📉 However, if the trendline breaks convincingly and retest fails, sellers may gain control with potential downside targets around 1.3200 and 1.3000.
📍 Conclusion:
GBP/USD is at a make-or-break zone 🧨. Traders should monitor the reaction at the trendline and resistance closely. Breakout or rejection here will shape the mid-term direction.
🔔 Watch for confirmation signals before entering positions.

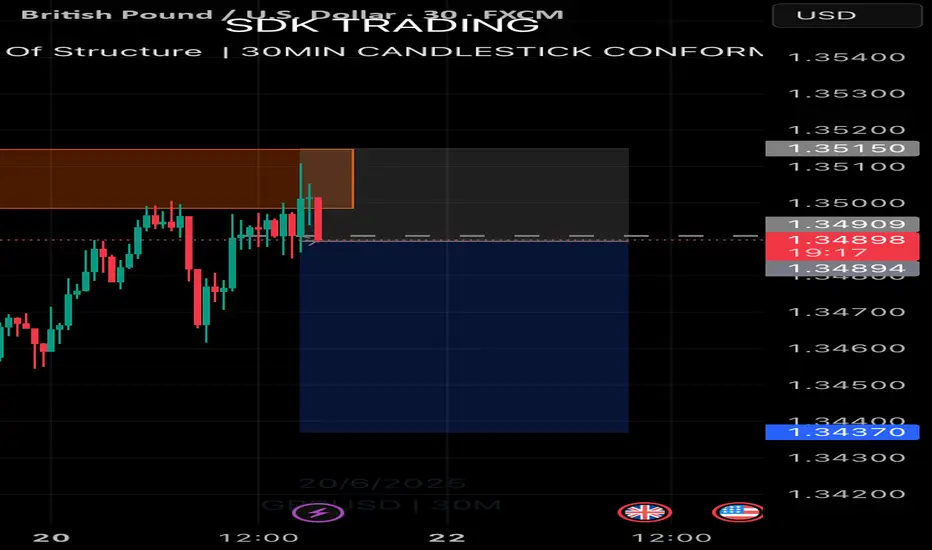
GBPUSD ShortDaily biased is to the downside. Price has retested and rejected a 30min orderblock. There is also a change of character on the 30min timeframe to the downside. Take profit is at 1.3459 and stop loss is at 1. 35150.
GBPUSD Wave Analysis – 20 June 2025
GBPUSD: ⬆️ Buy
- GBPUSD reversed from support zone
- Likely to rise to the resistance level at 1.3600
GBPUSD currency pair recently reversed up from the support zone located between the support level 1.3400 (former resistance from April), lower daily Bollinger Band and 50% Fibonacci correction of the upward impulse from May.he upward reversal from this support zone continues the active daily uptrend from the start of this year.
GBPUSD currency pair can be expected to rise to the next resistance level at 1.3600 (which stopped the previous impulse wave (5) earlier this month).

GBP/USD Stable as BoE Vote SplitsThe pound steadied near 1.34 following the Bank of England’s decision to hold rates. The vote revealed deeper division than expected, with six members supporting a hold and three pushing for a 25 basis point cut, contrary to forecasts of a 7-2 split.
The BoE faces a tough balancing act as it weighs sticky inflation, geopolitical risks, and the economic drag of US tariffs.
Resistance is seen at 1.3500, while support holds at 1.3415.
Sell trade GBP/USD Sell Trade Note:
The GBP/USD pair is currently under bearish pressure, reflecting stronger USD sentiment due to expectations of prolonged higher interest rates by the Fed and weaker UK economic outlook. Key support levels to watch are around 1.2600 and 1.2550. A break below these may confirm further downside. Resistance is around 1.2700–1.2750; any retracements toward these levels could present new selling opportunities.
Sentiment: Bearish below 1.2700
Risk Factors: UK economic data, US Fed commentary, geopolitical events.
---
Let me know if you want a more technical or fundamental analysis.

The Day AheadFriday, June 20 – Key Economic Data & Central Bank Events
United States
Philadelphia Fed Business Outlook (June) – Regional manufacturing sentiment indicator.
Leading Economic Index (May) – Composite of 10 leading indicators, used to forecast future economic activity.
China
1-Year & 5-Year Loan Prime Rates – Benchmark lending rates set by the PBoC; key for signaling monetary policy stance.
United Kingdom
GfK Consumer Confidence (June) – Measures households’ economic sentiment.
Retail Sales (May) – Key consumer spending metric.
Public Sector Net Borrowing (May) – Government fiscal position.
Japan
National CPI (May) – Headline and core inflation data, relevant for BoJ policy stance.
Germany
Producer Price Index (PPI, May) – Upstream inflation measure, potential signal for consumer price trends.
France
Business Confidence (June) – Insight into industrial sentiment.
Retail Sales (May) – Consumer activity and domestic demand tracker.
Eurozone
Consumer Confidence (June, flash) – Early indication of household sentiment across the bloc.
M3 Money Supply (May) – Broad monetary aggregate, important for ECB’s inflation monitoring.
Canada
Retail Sales (April) – Key consumer spending indicator.
Industrial Product Price Index (May) – Measures price changes for goods sold by manufacturers.
Central Banks
ECB – Publishes its Economic Bulletin, offering insights into economic conditions and policy outlook.
Bank of Japan (BoJ) – Governor Kazuo Ueda speaks; markets will watch for commentary on yield curve control, inflation expectations, and timing of policy normalization.
This communication is for informational purposes only and should not be viewed as any form of recommendation as to a particular course of action or as investment advice. It is not intended as an offer or solicitation for the purchase or sale of any financial instrument or as an official confirmation of any transaction. Opinions, estimates and assumptions expressed herein are made as of the date of this communication and are subject to change without notice. This communication has been prepared based upon information, including market prices, data and other information, believed to be reliable; however, Trade Nation does not warrant its completeness or accuracy. All market prices and market data contained in or attached to this communication are indicative and subject to change without notice.

Uptrend on the market The market broke the zone before and it retraced back in the zone now it's gaining momentum going up...the is possibility it will reach 1.35300

GBPUSD 1-hour chartGBPUSD Long Idea 🚀
Looks like a clear break of structure on the 1H chart! Price has pushed through resistance and is now potentially retesting the previous supply zone as new demand. Looking for a bounce here to continue the upward momentum.
Targets: 1.3600🎯
Stop Loss: 1.34118⛔

GBPUSD SHORT/SELL 1:3.5Reason for selling:
* Break of structure
* B wave of corrective structure forming
* Expanding flat forming
* MACD divergence
* Liquidity under 1.33860
Strategy to use: FIB retracement on 50/61.8
Engulfing candle to the downside
Entry: 1.35616
Stop Loss: 1.36155
Take Profit: 1.33875

Idea on a ChartGBP/USD found a slight rebound to muscle back above 1.3450 on Thursday.
Despite near-term Greenback strength on geopolitical concerns, markets took a break during the midweek US holiday session.
Israel-Iran tensions continue to rise, and the Trump administration is drawing out a decision on getting involved directly.
GBP/USD found some room on the high side on Thursday, climbing back above the 1.3450 level after catching an early technical bounce from the 1.3400 handle. Broad-market flows have favored the US Dollar recently as Middle East tensions continue to rise, but US markets were dark for a national holiday on Thursday, giving Cable some room to breathe and easing off of USD bidding.