Lingrid | GBPUSD Potential Bounce at Key Psychological LevelThe price perfectly fulfilled my previous idea . FX:GBPUSD is consolidating above the upward trendline after forming a local double top near the 1.3787 resistance zone. The price is currently retesting the 1.3611–1.3660 support cluster, aligned with the trendline and previous impulse breakout area. A successful bounce from this zone could initiate another rally toward the upper boundary of the resistance range.
📈 Key Levels
Buy zone: 1.3600–1.3660 (trendline + support overlap)
Sell trigger: breakdown below 1.3600
Target: 1.3787 – resistance ceiling with prior rejection
Buy trigger: bullish reaction from 1.3611 area with strong candle close
💡 Risks
Breakdown below 1.3600 may expose deeper retracement to 1.3367
Repeated rejection at 1.3787 could form a longer-term double top
Macro data surprises could shift short-term direction suddenly
If this idea resonates with you or you have your own opinion, traders, hit the comments. I’m excited to read your thoughts!
GBPUSD_SPT trade ideas

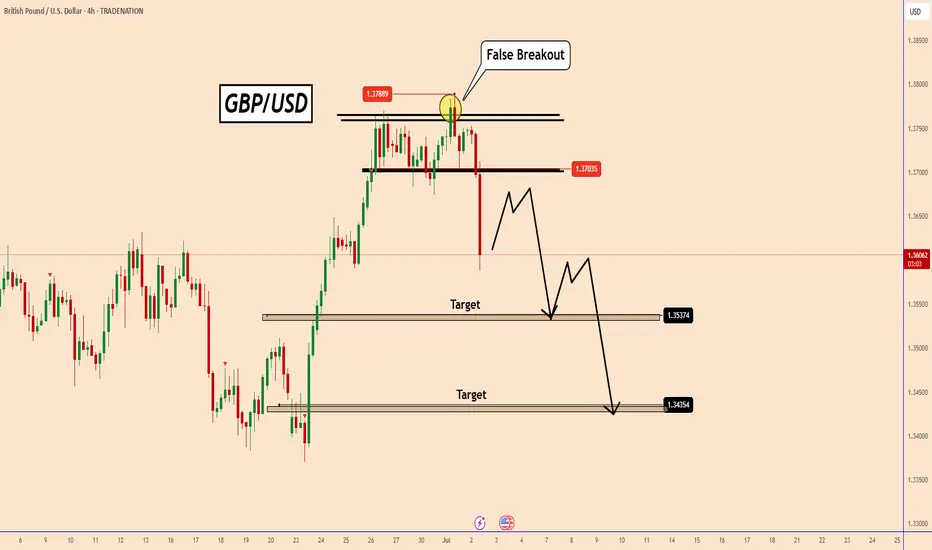
GBPUSD: Profit taking or a downward move?GBPUSD: Profit taking or a downward move?
Yesterday, GBPUSD reached a new high of 1.3788, last seen in February 2022.
From the chart it can be clearly seen that GBPUSD only created a false breakout to the upside.
Market participants expected USD to weaken, but it changed direction again and locked in many long positions.
Despite the ADP data today being a real dud from expectations of 95k to -33k, we can see that GBPUSD did not stop the decline.
I think this could be related to the FED and if they think that maybe this is the time to change Interest Rates at the July meeting. It could also be a liquidity release and it could rise again, but we cannot prove this yet with the current pattern.
Technical Analysis:
As long as the price stays below 1.3680 or below this small structure, the price could fall further.
Don't forget that tomorrow we also have NFP data and the US market will be preparing for a long weekend. The 4-hour candle is strong and bearish, so let's see.
You may find more details in the chart!
Thank you and Good Luck!
PS: Please support with a like or comment if you find this analysis useful for your trading day
Disclosure: I am part of Trade Nation's Influencer program and receive a monthly fee for using their TradingView charts in my analysis.
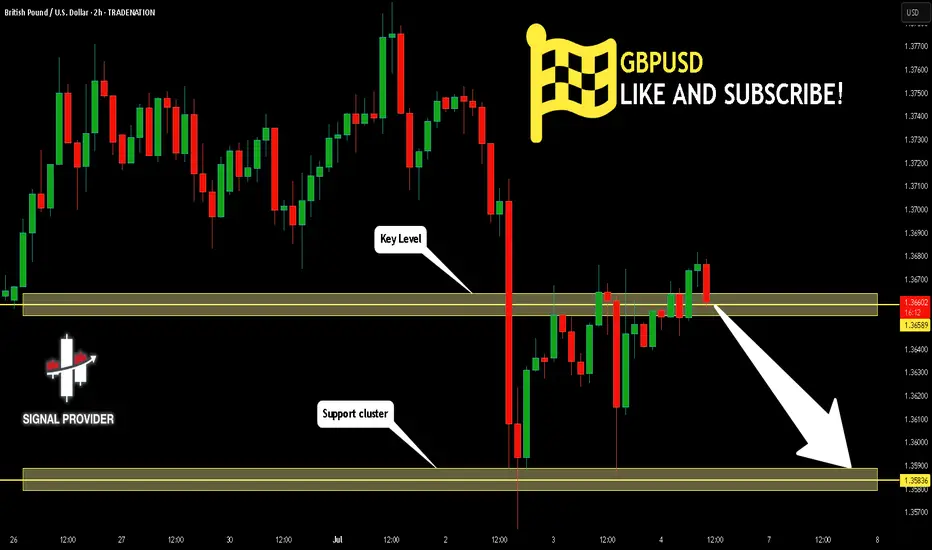
GBPUSD - 2 Selling opportunitiesLooking at GBPUSD
We have 2 opportunities to get short. Both have a build of liquidity before the areas of supply before them. This means we are looking for the early seller to get into the market before we get in so that all the early seller get stopped out.
As we can see the order flow on this is still bearish. So until the market shows me it want to go higher then we will remain bearish
Keep a close eye on this for tomorrow
GBPUSD -SHort TGT 1.3464GBPUSD is expected to hit long. However the pair will retrace to 1.3464 before futher long move.
GBPUSD Bearish Signal | Technical + Custom AlgoSmart Trend Signal | Technical Analysis + Custom Algorithm
This signal is the result of a combination of classic technical trend analysis and a proprietary software I personally developed.

Bullish bounce off pullback support?The Cable (GBP/USD) has bounced off the pivot, which has been identified as a pullback support, and could bounce to the 1st resistance, which is a pullback resistance.
Pivot: 1.3584
1st Support: 1.3519
1st Resistance: 1.3771
Risk Warning:
Trading Forex and CFDs carries a high level of risk to your capital and you should only trade with money you can afford to lose. Trading Forex and CFDs may not be suitable for all investors, so please ensure that you fully understand the risks involved and seek independent advice if necessary.
Disclaimer:
The above opinions given constitute general market commentary, and do not constitute the opinion or advice of IC Markets or any form of personal or investment advice.
Any opinions, news, research, analyses, prices, other information, or links to third-party sites contained on this website are provided on an "as-is" basis, are intended only to be informative, is not an advice nor a recommendation, nor research, or a record of our trading prices, or an offer of, or solicitation for a transaction in any financial instrument and thus should not be treated as such. The information provided does not involve any specific investment objectives, financial situation and needs of any specific person who may receive it. Please be aware, that past performance is not a reliable indicator of future performance and/or results. Past Performance or Forward-looking scenarios based upon the reasonable beliefs of the third-party provider are not a guarantee of future performance. Actual results may differ materially from those anticipated in forward-looking or past performance statements. IC Markets makes no representation or warranty and assumes no liability as to the accuracy or completeness of the information provided, nor any loss arising from any investment based on a recommendation, forecast or any information supplied by any third-party.

GBP_USD GROWTH AHEAD|
✅GBP_USD is trading in an uptrend
Along the rising support line
Which makes me bullish biased
And the pair is about to retest the rising support
Thus, a rebound and a move up is expected
With the target of retesting the level above at 1.3650
LONG🚀
✅Like and subscribe to never miss a new idea!✅
Disclosure: I am part of Trade Nation's Influencer program and receive a monthly fee for using their TradingView charts in my analysis.


GBP/USD Weekly Plan – 8th to 12th July 2025The British Pound is testing the upper range of its recent rally, just below a high-liquidity supply zone near 1.37898. While short-term bullish momentum remains intact, both the technical structure and upcoming macro events point towards a potential midweek reversal.
📉 Technical Breakdown – H4 Chart
Price has completed a full impulsive leg and is approaching a key supply zone (1.37703–1.37898), aligning with weekly highs.
Previous CHoCH + BOS formations show buyer strength, but recent rejections indicate exhaustion.
Liquidity sits below at 1.35013 and 1.33927, making downside targets attractive for short setups.
🔁 Trade Setups
✅ SELL GBP/USD
Entry: 1.37703
Stop Loss: 1.38000
TP1: 1.37100
TP2: 1.36513
TP3: 1.35013
Rationale: Selling into weak high and potential liquidity trap. Expecting rejection from the top of the weekly range.
✅ BUY GBP/USD
Entry: 1.33927
Stop Loss: 1.33600
TP1: 1.34500
TP2: 1.35237
TP3: 1.36900
Rationale: Buying from a strong demand zone and order block with FVG confluence. Clean upside potential if market respects structure.
🧠 Macro Context – What to Watch
🇬🇧 GBP Drivers:
BOE Governor Bailey Speaks (Twice this week) – May offer clarity on future monetary stance.
🇺🇸 USD Drivers:
Fed Chair Powell Speaks – Markets watching for tone on rate path.
NFP Jobs Report (Friday) – Forecast: 147K. A strong figure could support USD.
Unemployment Claims / Rate – A key pair of metrics for short-term dollar moves.
🧩 A hawkish Fed tone + strong NFP = stronger USD → pressure on GBP/USD.
📊 Key Zones
Zone Role Notes
1.37898 Weekly High Strong resistance + sell-side liquidity trap
1.37703 Sell Entry Within supply zone
1.33927 Buy Entry Order block + FVG zone, ideal reversal zone
1.35013 Major Target Previous BOS zone and liquidity below structure
⚠️ Strategy Guidance
Wait for confirmations on H1–H4 (CHoCH / FVG rejection).
Avoid new positions 1 hour before or after red-folder events (e.g., NFP, Bailey speech).
Trailing SL recommended once TP1 is reached.

Gbpusd Long SetupGbpusd (M,W,D Strong Bullish)
Daily Bullish trend channel
1:4hr Demand Zone +Fvg
2:1hr Demand Zone +Fvg
According to Seasonality :gbpusd Bullish (July)
GBPUSD BUY?Market is reacting to Fib area on Daily time frame. Based on 4HR TF, the market seems to be forming a possible reversal pattern which could lead to a possible reversal.
We could see BUYERS coming in strong should the current level hold.
Disclaimer:
Please be advised that the information presented on TradingView is solely intended for educational and informational purposes only.The analysis provided is based on my own view of the market. Please be reminded that you are solely responsible for the trading decisions on your account.
High-Risk Warning
Trading in foreign exchange on margin entails high risk and is not suitable for all investors. Past performance does not guarantee future results. In this case, the high degree of leverage can act both against you and in your favor

GBP/USD Bearish Trend Analysis GBP/USD Bearish Trend Analysis
The GBP/USD pair is currently exhibiting a bearish trend on the 1-hour chart, with the market forming lower lows, a clear indication of sustained selling pressure. This downward momentum suggests that traders are favoring short positions, and the bearish sentiment may continue in the upcoming trading sessions.
Bearish Flag Pattern Suggests Further Downside
Adding to the bearish outlook, the price action is forming a bearish flag pattern, which is typically a continuation signal in a downtrend. This pattern consists of a sharp decline (the flagpole) followed by a slight upward or sideways consolidation (the flag). A breakdown below the flag’s support could trigger another wave of selling, reinforcing the bearish bias.
Key Support Levels to Watch
If the downtrend continues, the market could target the following support levels:
- 1.35850 – The initial downside target, likely to act as a short-term support zone.
- 1.35100 – A deeper support level that may come into play if selling pressure intensifies.
A break below these levels could open the door for further declines, potentially extending toward 1.34500 or lower, depending on market momentum.
Resistance Level as a Key Barrier
On the upside, the 1.37900 level serves as a critical resistance. If the price retraces higher, this zone could act as a strong barrier where sellers might re-enter. A sustained break above this resistance could invalidate the bearish outlook, signaling a potential trend reversal or consolidation phase.
Trading Strategy Considerations
- Bearish Scenario: Traders may look for short opportunities near resistance levels or upon a confirmed breakdown below the bearish flag.
- Risk Management: A stop-loss above 1.37900 (or a recent swing high) could help mitigate risk if the market reverses unexpectedly.
- Bullish Caution: If GBP/USD breaks above 1.37900 with strong momentum, the bearish thesis may need reevaluation.
Conclusion
The GBP/USD pair remains bearish in the short term, supported by the lower lows and the bearish flag pattern. Traders should monitor the 1.35850 and 1.35100 support levels for potential downside targets, while keeping an eye on 1.37900 as a key resistance that could determine whether the downtrend continues or reverses. Proper risk management remains essential in navigating this market structure.

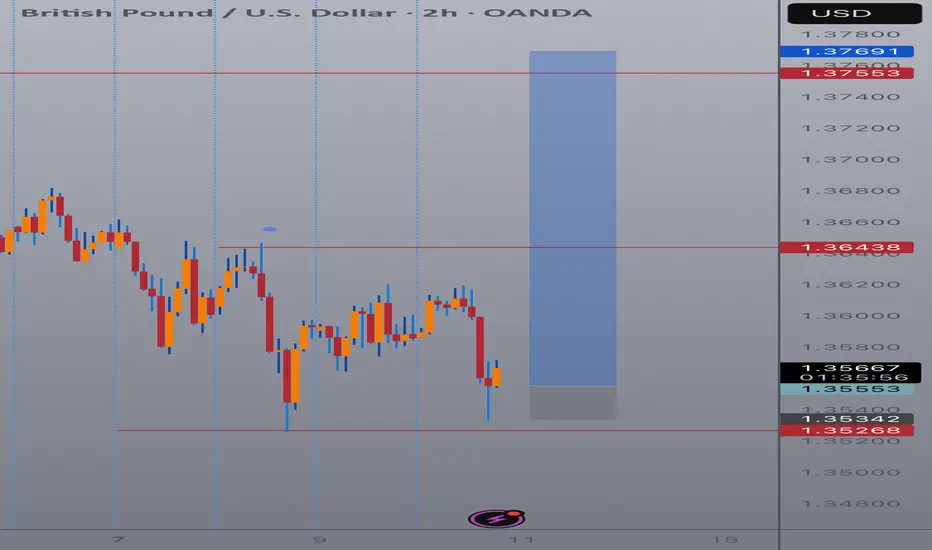
GBPUSD Bearish Bias Expected till 1.35250Little bit sign of strength observed by the lower wicks rejections but each price price shows no real intention to upside yet. We can expect atleast for the short term toward sell side min 1.35250, if hold and reverse we can move trade to Breakeven, otherwise our main target will be near 1.35300 area.
GBPUSD - trade - market structureGBPUSD - trade - market structure , easy setup, clean setup , good probability, if this happen is a big win, use risk and trade managment
GBPUSD Will Go Lower! Sell!
Take a look at our analysis for GBPUSD.
Time Frame: 2h
Current Trend: Bearish
Sentiment: Overbought (based on 7-period RSI)
Forecast: Bearish
The market is testing a major horizontal structure 1.365.
Taking into consideration the structure & trend analysis, I believe that the market will reach 1.358 level soon.
P.S
Overbought describes a period of time where there has been a significant and consistent upward move in price over a period of time without much pullback.
Disclosure: I am part of Trade Nation's Influencer program and receive a monthly fee for using their TradingView charts in my analysis.
Like and subscribe and comment my ideas if you enjoy them!
GBPUSD SHORTWe have a break of structure. we waiting for a fair value gap on lower time frame in order to sell to those zone. lets wait and see how it goes

Market Analysis: GBP/USD DipsMarket Analysis: GBP/USD Dips
GBP/USD failed to climb above 1.3800 and corrected some gains.
Important Takeaways for GBP/USD Analysis Today
- The British Pound is showing bearish signs below the 1.3700 support against the US dollar.
- There is a key bearish trend line forming with resistance near 1.3650 on the hourly chart of GBP/USD at FXOpen.
GBP/USD Technical Analysis
On the hourly chart of GBP/USD at FXOpen, the pair failed to stay above the 1.3750 pivot level. As a result, the British Pound started a fresh decline below 1.3720 against the US Dollar.
There was a clear move below 1.3700 and the 50-hour simple moving average. The bears pushed the pair below 1.3650. Finally, there was a spike below the 1.3600 support zone. A low was formed near 1.3562 and the pair is now consolidating losses.
There was a minor move above the 1.3615 level. On the upside, the GBP/USD chart indicates that the pair is facing resistance near the 1.3650 level. There is also a key bearish trend line forming with resistance near 1.3650.
The next major resistance is near the 50% Fib retracement level of the downward move from the 1.3788 swing high to the 1.3562 low at 1.3675. A close above the 1.3670 resistance zone could open the doors for a move toward the 1.3700 zone. The 61.8% Fib retracement level is at 1.3700. Any more gains might send GBP/USD toward 1.3790.
On the downside, there is a key support forming near 1.3615. If there is a downside break below the 1.3615 support, the pair could accelerate lower. The next major support is near the 1.3560 zone, below which the pair could test 1.3500. Any more losses could lead the pair toward the 1.3440 support.
This article represents the opinion of the Companies operating under the FXOpen brand only. It is not to be construed as an offer, solicitation, or recommendation with respect to products and services provided by the Companies operating under the FXOpen brand, nor is it to be considered financial advice.

GBPUSD → Correction before the bullish trend continuesFX:GBPUSD is forming a trading range for consolidation of potential ahead of a possible continuation of growth as part of a countertrend correction.
The dollar is trying to recover from its decline due to a local change in the fundamental background, but the global trend for the DXY is bearish. This could provide support for the GBP to continue growing, provided that the bulls hold their defense above the 0.5 Fibonacci zone of the main impulse movement.
The market is holding GBPUSD within the trading range of 1.359 - 1.3675. The trend is bullish, and within the correction, liquidity may be captured from 1.359 before further growth.
Resistance levels: 1.3675, 1.3764
Support levels: 1.359, 1.3511
If the reaction to the subsequent retest of support at 1.359 is weak, we can consider a continuation of the correction to the 0.7-0.79 Fibonacci zone, which would be the most favorable entry point for us (focus on 1.3511 — a false breakout will increase interest in buying). In the current situation, the focus is on 1.359.
Best regards, R. Linda!

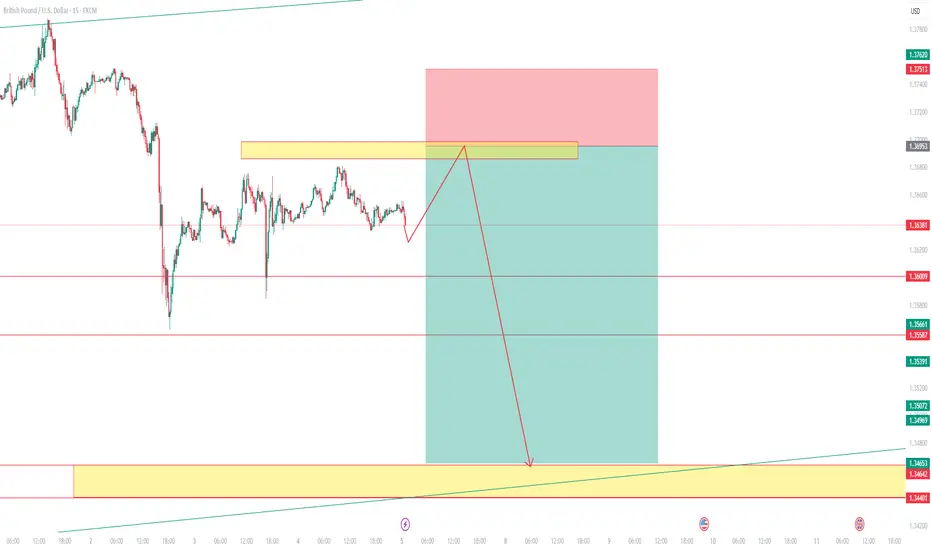
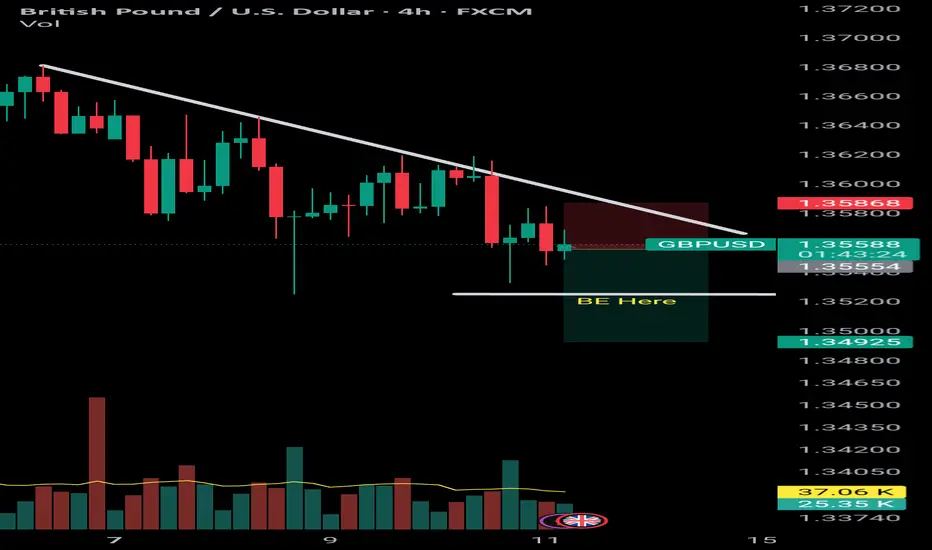
GBPUSD Pauses After Hitting First Target Amid USD-Driven TurbuleGBPUSD Pauses After Hitting First Target Amid USD-Driven Turbulence
Following our previous analysis, GBPUSD reached its first downside target and is currently experiencing a brief pause.
The U.S. has begun sending letters to multiple trading partners, stirring market uncertainty. This diplomatic disruption is strengthening the USD, giving it a tactical edge.
Should GBPUSD correct back toward 1.3600, there's potential for renewed downside movement in the coming days—particularly if market clarity improves.
🎯 Next key targets:
1.3435
1.3330
You may find more details in the chart!
Thank you and Good Luck!
PS: Please support with a like or comment if you find this analysis useful for your trading day
Disclosure: I am part of Trade Nation's Influencer program and receive a monthly fee for using their TradingView charts in my analysis.

GBP/USD - Day Trading Analysis With Volume ProfileOn GBP/USD, it's nice to see a strong sell-off from the price of 1.37000. It's also encouraging to observe a strong volume area where a lot of contracts are accumulated.
I believe that sellers from this area will defend their short positions. When the price returns to this area, strong sellers will push the market down again.
Strong S/R zone from the past and Volume cluster are the main reasons for my decision to go short on this trade.
Happy trading,
Dale

GBPUSD I Weekly CLS I Model 1 I Target 50%Hey, Market Warriors, here is another outlook on this instrument
If you’ve been following me, you already know every setup you see is built around a CLS Footprint, a Key Level, Liquidity and a specific execution model.
If you haven't followed me yet, start now.
My trading system is completely mechanical — designed to remove emotions, opinions, and impulsive decisions. No messy diagonal lines. No random drawings. Just clarity, structure, and execution.
🧩 What is CLS?
CLS is real smart money — the combined power of major investment banks and central banks moving over 6.5 trillion dollars a day. Understanding their operations is key to markets.
✅ Understanding the behavior of CLS allows you to position yourself with the giants during the market manipulations — leading to buying lows and selling highs - cleaner entries, clearer exits, and consistent profits.
📍 Model 1
is right after the manipulation of the CLS candle when CIOD occurs, and we are targeting 50% of the CLS range. H4 CLS ranges supported by HTF go straight to the opposing range.
"Adapt what is useful, reject what is useless, and add what is specifically your own."
— David Perk aka Dave FX Hunter ⚔️
👍 Hit like if you find this analysis helpful, and don't hesitate to comment with your opinions, charts or any questions.

GBP/USD Potential Shorts from 1.37000This week, my analysis for GBP/USD focuses on the continuation of the bearish order flow. I currently have a clean 16-hour supply zone that remains unmitigated, where we may see a potential bearish reaction in alignment with the prevailing downtrend. If price breaks through this zone, I will shift focus to an extreme 2-hour supply zone higher up.
There are several imbalances and pools of liquidity resting below that serve as potential downside targets. Additionally, I’m noticing the formation of engineered liquidity beneath current price, which further supports the bearish outlook.
Confluences for GBP/USD Sells:
The U.S. Dollar has reacted from a strong demand zone, suggesting we could see continued bullish pressure on the dollar, which may weigh on GBP/USD.
GBP/USD has shown a clear change of character to the downside, confirming bearish market structure—this is a pro-trend trade setup.
We have both a clean 16-hour and an extreme 2-hour supply zone, offering high-probability entry points for potential shorts.
Multiple liquidity targets below, including Asia session lows and unfilled imbalances, align well with the bearish narrative.
P.S. My next potential long opportunity lies at the 6-hour demand zone near 1.34400. From there, I’ll be watching for price to slow down, accumulate orders, and potentially shift structure to the upside.
Wishing everyone a successful and profitable trading week!
