GBPUSD remains within a bullish channelGBP/USD is currently trading within an ascending channel, showing bullish structure overall. The price is testing support near 1.3529, with potential for a rebound toward 1.3568 and 1.3632 if the structure holds. However, a decisive break below 1.34616 would be a strong bearish signal and could mark a shift in trend direction from bullish to bearish, opening the door for deeper declines. Traders should monitor price action closely around this level for potential trend reversal confirmation.
GBPUSD_SPT trade ideas

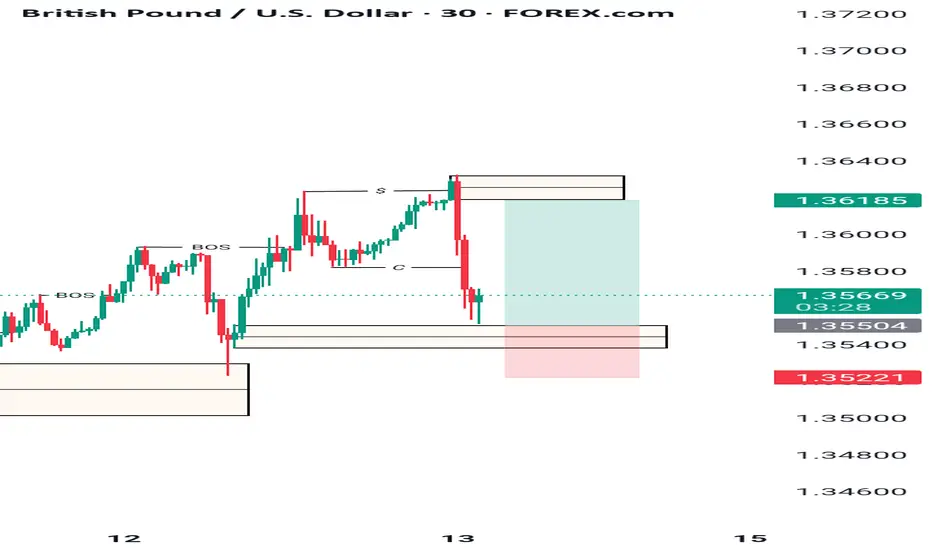
GBPUSD SHORT FORECAST Q2 W24 D13 Y25GBPUSD SHORT FORECAST Q2 W24 D13 Y25
Professional Risk Managers👋
Welcome back to another FRGNT chart update📈
Diving into some Forex setups using predominantly higher time frame order blocks alongside confirmation breaks of structure.
Let’s see what price action is telling us today!
💡Here are some trade confluences📝
✅Weekly order block
✅15' order block
✅Intraday 15' break of structure
✅Tokyo ranges to be filled
🔑 Remember, to participate in trading comes always with a degree of risk, therefore as professional risk managers it remains vital that we stick to our risk management plan as well as our trading strategies.
📈The rest, we leave to the balance of probabilities.
💡Fail to plan. Plan to fail.
🏆It has always been that simple.
❤️Good luck with your trading journey, I shall see you at the very top.
🎯Trade consistent, FRGNT X

BUY Positioncurrently looking at a BUY position to zone Bullish trend my judgement should push to the upside

Bearish outlook for GBPUSD with 1.34557 as target.Price action has entered the sellside of the curve in a market maker sell model. This has warranted bearish price action till 1.34557.

GBPUSD H4 I Bullish Bounce OffBased on the H4 chart analysis, we can see that the price is falling toward our buy entry at 1.3519, which is a pullback support that aligns closely with the 61.8% Fibo retracement.
Our take profit will be at 1.3588, which is a pullback resistance level.
The stop loss will be placed at 1.3455, a swing low support.
High Risk Investment Warning
Trading Forex/CFDs on margin carries a high level of risk and may not be suitable for all investors. Leverage can work against you.
Stratos Markets Limited (tradu.com ):
CFDs are complex instruments and come with a high risk of losing money rapidly due to leverage. 63% of retail investor accounts lose money when trading CFDs with this provider. You should consider whether you understand how CFDs work and whether you can afford to take the high risk of losing your money.
Stratos Europe Ltd (tradu.com ):
CFDs are complex instruments and come with a high risk of losing money rapidly due to leverage. 63% of retail investor accounts lose money when trading CFDs with this provider. You should consider whether you understand how CFDs work and whether you can afford to take the high risk of losing your money.
Stratos Global LLC (tradu.com ):
Losses can exceed deposits.
Please be advised that the information presented on TradingView is provided to Tradu (‘Company’, ‘we’) by a third-party provider (‘TFA Global Pte Ltd’). Please be reminded that you are solely responsible for the trading decisions on your account. There is a very high degree of risk involved in trading. Any information and/or content is intended entirely for research, educational and informational purposes only and does not constitute investment or consultation advice or investment strategy. The information is not tailored to the investment needs of any specific person and therefore does not involve a consideration of any of the investment objectives, financial situation or needs of any viewer that may receive it. Kindly also note that past performance is not a reliable indicator of future results. Actual results may differ materially from those anticipated in forward-looking or past performance statements. We assume no liability as to the accuracy or completeness of any of the information and/or content provided herein and the Company cannot be held responsible for any omission, mistake nor for any loss or damage including without limitation to any loss of profit which may arise from reliance on any information supplied by TFA Global Pte Ltd.
The speaker(s) is neither an employee, agent nor representative of Tradu and is therefore acting independently. The opinions given are their own, constitute general market commentary, and do not constitute the opinion or advice of Tradu or any form of personal or investment advice. Tradu neither endorses nor guarantees offerings of third-party speakers, nor is Tradu responsible for the content, veracity or opinions of third-party speakers, presenters or participants.

SELL GBPUSD for bullish trend reversal STOP LOSS: 1.3720SELL GBPUSD for bullish trend reversal
STOP LOSS: 1.3720
Regular Bearish Divergence
In case of Regular Bearish Divergence:
* The Indicator shows Lower Highs
* Actual Market Price shows Higher Highs
We can see a strong divergence on the MACD already and There is a strong trend reversal on the daily time frame chart.....
The daily time frame is showing strength of trend reversal from this level resistance so we
are looking for the trend reversal and correction push from here .....
TAKE PROFIT : take profit will be when the trend comes to an end, feel from to send me a direct DM if you have any question about take profit or anything
Remember to risk only what you are comfortable with….....trading with the trend, patient and good risk management is the key to success here

Who else is ready for GU possible buys?GU has reached a supply zone after taking out liquidity and filled up imbalance. We're looking for a push upside into the order block formed.
NO TRADE IS GUARANTEED, USE PROPER RISK MANAGEMENT!!!
GBPUSD(20250613)Today's AnalysisMarket news:
The number of initial jobless claims in the United States for the week ending June 7 was 248,000, higher than the expected 240,000, the highest since the week of October 5, 2024. The monthly rate of the core PPI in the United States in May was 0.1%, lower than the expected 0.30%. Traders once again fully priced in the Fed's two interest rate cuts this year.
Technical analysis:
Today's buying and selling boundaries:
1.3585
Support and resistance levels
1.3685
1.3648
1.3624
1.3547
1.3522
1.3485
Trading strategy:
If the price breaks through 1.3624, consider buying in, the first target price is 1.3648
If the price breaks through 1.3585, consider selling in, the first target price is 1.3547

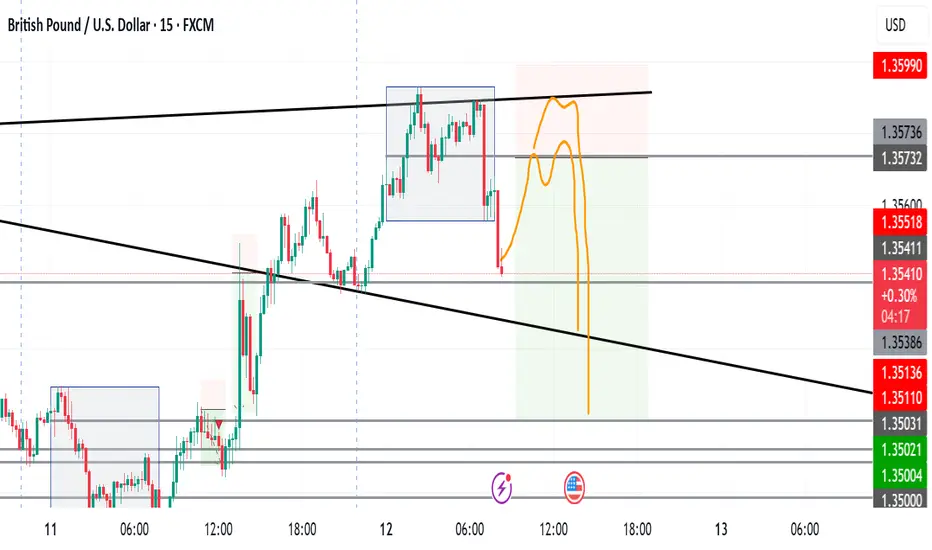
Possible bearish outlook Seeing how price reacted the previous liquidity, I would e looking for bearishness to the Downside

GBP/USD Rally Resumes – Bullish Targets AheadHi everyone,
As outlined in our previous GBP/USD analysis (idea linked below), the Cable confirmed its continued rally following a decisive break above the 1.35195 level. This was quickly followed by a move through our highlighted levels at 1.35630 and 1.35934.
As previously noted, the clearance of these levels strengthens our expectation for further upside, with the next key level of interest around 1.36850. We'll be watching to see how price action develops from here.
We’ll continue to provide updates on the projected path for GBP/USD as price approaches this target.
The longer-term outlook remains bullish, and we expect the rally to continue extending further from the 1.20991 January low.
We’ll be keeping you updated throughout the week with how we’re managing our active ideas. Thanks again for all the likes/boosts, comments and follows — we appreciate the support!
All the best for the week ahead. Trade safe.
BluetonaFX

Potential bullish rise?The Cable (GBP/ISD) has bounced off the pivot and could rise to the 1st resistance.
Pivot: 1.3580
1st Support: 1.3540
1st Resistance: 1.3662
Risk Warning:
Trading Forex and CFDs carries a high level of risk to your capital and you should only trade with money you can afford to lose. Trading Forex and CFDs may not be suitable for all investors, so please ensure that you fully understand the risks involved and seek independent advice if necessary.
Disclaimer:
The above opinions given constitute general market commentary, and do not constitute the opinion or advice of IC Markets or any form of personal or investment advice.
Any opinions, news, research, analyses, prices, other information, or links to third-party sites contained on this website are provided on an "as-is" basis, are intended only to be informative, is not an advice nor a recommendation, nor research, or a record of our trading prices, or an offer of, or solicitation for a transaction in any financial instrument and thus should not be treated as such. The information provided does not involve any specific investment objectives, financial situation and needs of any specific person who may receive it. Please be aware, that past performance is not a reliable indicator of future performance and/or results. Past Performance or Forward-looking scenarios based upon the reasonable beliefs of the third-party provider are not a guarantee of future performance. Actual results may differ materially from those anticipated in forward-looking or past performance statements. IC Markets makes no representation or warranty and assumes no liability as to the accuracy or completeness of the information provided, nor any loss arising from any investment based on a recommendation, forecast or any information supplied by any third-party.

GBP/USDDaily and 4h closed above, took a long position (buy)
Have currently set for a 1/1 since we are in "NO MANS LAND" but may hold for a 1/2 depending on how price moves.
GBPUSDGBP/USD: 10-Year Bond Yield, Interest Rate, Interest Rate Differential, and Upcoming Economic Data (June 2025)
1. Bank of England (BoE) Interest Rate and 10-Year Bond Yield
Current BoE Base Interest Rate:
4.25% as of May 2025, following a 25 basis point cut from 4.50%. This marked the fourth rate cut since August 2024 amid easing inflation and slowing UK economic growth.
The Monetary Policy Committee (MPC) voted 5–4 in favor of the cut, with some members preferring a larger cut and others favoring holding rates steady.
UK 10-Year Government Bond Yield:
As of early June 2025, UK 10-year gilt yields have been fluctuating around 4.47% to 4.8%, influenced by global risk sentiment, inflation expectations, and BoE policy signals.
Yields have generally trended lower due to expectations of further BoE rate cuts and global economic uncertainties.
2. Upcoming Economic Data for GBP/USD
Next BoE Interest Rate Decision:
Scheduled for Thursday, June 19, 2025, at 11:00 UTC.
Markets expect the BoE to hold rates at 4.25%, but some analysts anticipate further cuts later in 2025 due to slowing growth and easing inflation pressures.
The MPC has emphasized a cautious, data-dependent approach amid global trade tensions and domestic economic uncertainties.
Key UK Economic Indicators to Watch:
UK CPI Inflation: Inflation has eased to around 3.5% in April 2025 but remains above the 2% target; future prints will guide BoE policy.
GDP Growth: UK growth has slowed since mid-2024, with risks from global trade tensions and Brexit-related adjustments.
Labour Market Data: Loosening labor market conditions and wage growth trends will influence the BoE’s rate path.
Trade and Tariff Developments: US tariff policies and potential UK-US trade deal announcements could impact market sentiment and currency flows.
Outlook
The GBP/USD pair is influenced by the interest rate and yield differentials, with the USD currently benefiting from higher yields and a more hawkish Fed stance.
The BoE’s cautious approach and expectations of gradual rate cuts amid slowing growth may limit GBP upside in the near term.
Upcoming UK inflation and labor data, along with the June 19 BoE meeting, will be critical for market direction.
#gbpusd

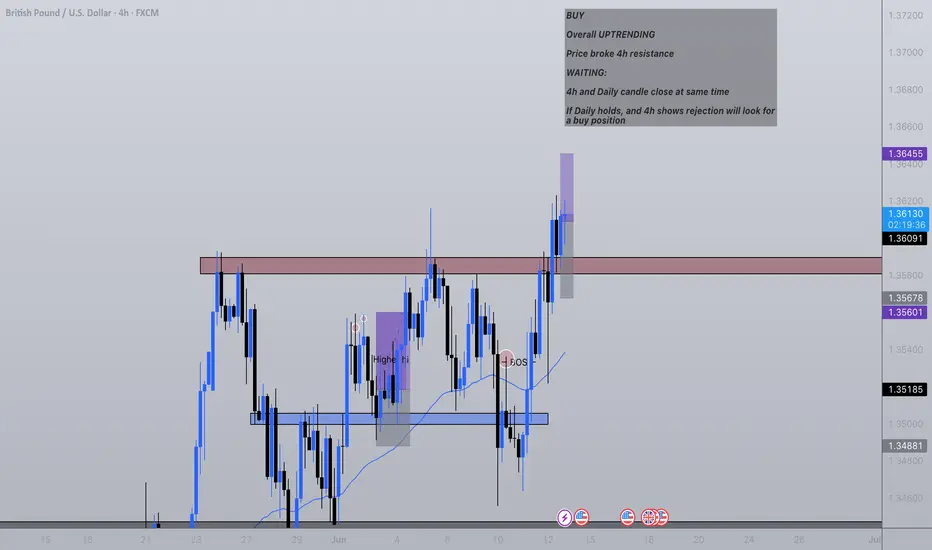
GBP/USD BUYKeep it simple
Overall bullish trending (upward trending)
Respected resistance broken
Daily has not been able to close above in recent weeks
Lower time frames could not hold above
WAIT FOR:
Daily close
4h close


GU running wellGU playing out. A potential for huge gains here with a partial left to run if TP is hit
London Take 1 - GBPUSD - 12/6/2025SO this is what I see and anticipating ...more updates will follow.
PINK ZONE initially is ENTRY/KILL ZONE not entry and stoploss, screenshots after I am in the trade will update to atual short position with EP, SL & TP and my notes will elaborate.
News later at NY ...will be staying safe but looking to catch some pips
GBP/USD Sell OpportunityHi Traders.
We see we reached the Top of the HTF Structure and formed a Duuble Top and M Style Pattern
The Right Part of the Double Top
is also a LTF HnS Pattern.
We breakout from this structure and now forming some Bearish correction.

CHECK GBPUSD SIGNAL READ CAPTAINgbpusd sell now ✅
entry point (1.35900) (1.35850)
TAKE PROFIT 1: (1.35700)
TAKE PROFIT 2: (1.35450)
LAST TARGET (1.35200)
STOP LOSS (1.36150)

GBPUSD TECH.Hello everyone.
First of all, in this week, I feel so bearish :D
The market may seem very soon so bearish, if after we will have some downfall very soon...
I hope we will get in some profit situation, if the price will enter this "white break lined colored" channel... Because after that, the price may move many times there in that channel...
So, what we can wait in this situation is when the price will go down and starts making some sideways trend and will get horizontal trend...
Thank you!
Have a Profitable Day! ^^

GBPUSDfsten your setbelt for weken gbp nd stronger usd the mrket got mnipulted for tking buy stop for mking more selling


