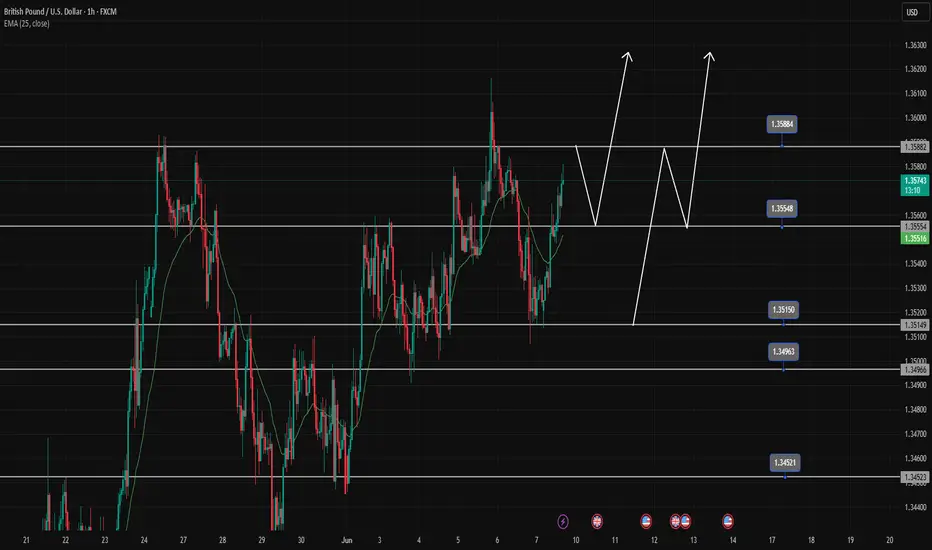
GBPUSD [Possible longsHere' how I'm watching GBPUSD for a potential buy trade. I reckon the buy would hold, although I'd be risking 0.5% of my equity because we didn't see the market take out previous high with deliberate candle closes, and that could mean that there are sellers lurking somewhere around.
However, until the sell is confirmed, the trend is our friend.
DYOR
GBPUSD_SPT trade ideas

09/06/2025: WILL WE SEE A BREAKOUT ABOVE 1.3550?GBP/USD PLAN – 09/06/2025: WILL WE SEE A BREAKOUT ABOVE 1.3550?
🌍 Macroeconomic & Fundamental Context:
UK Economic Outlook (BoE): The Bank of England (BoE) is under pressure due to inflation and has to make decisions regarding interest rate policy. Diverging opinions on whether to raise or lower rates are creating uncertainty in the market.
US Economic Outlook (Fed): The Federal Reserve's monetary policy continues to be a major influence on the USD, especially as the Fed maintains its rate hikes to control inflation.
US-UK Trade Relations: Trade negotiations between the US and the UK will remain an important factor this week, and any new developments could impact GBP/USD.
📉 Technical Analysis – GBP/USD:
On the H4 and H1 timeframes, GBP/USD is consolidating within a corrective structure, and price has broken several key Fibonacci levels. The EMA indicators (13, 34, 89) are showing strong momentum.
Key Resistance Levels:
1.3550 – This is a major resistance level. If broken, GBP/USD could continue its rally towards 1.3612.
Key Support Levels:
1.3520 – A short-term support level. If this breaks, price may retrace back to 1.3470.
🎯 Trading Scenarios for Today:
🟢 BUY ZONE:
Buy Zone: 1.3520 – 1.3500
SL: 1.3480
TP: 1.3550 → 1.3570 → 1.3600 → 1.3620 → 1.3650
If price retraces to 1.3520 – 1.3500, this would be an ideal buying opportunity with a target at 1.3550. Look for confirmation from technical indicators and the current trend.
🔴 SELL ZONE:
Sell Zone: 1.3550 – 1.3570
SL: 1.3590
TP: 1.3520 → 1.3500 → 1.3470 → 1.3450 → 1.3420
If price reaches the resistance zone of 1.3550 – 1.3570, consider selling with targets at the support levels below.
🟡 Scalping:
Buy Scalping: 1.3520 → 1.3500
Sell Scalping: 1.3570 → 1.3600
Look for short-term opportunities when price moves within the range.
⚠️ Important Notes:
Pay close attention to short-term fluctuations and any major economic data releases from the BoE and Fed.
Risk management is key during volatile periods.
📌 Conclusion:
GBP/USD is in a short-term corrective phase, but a breakout above 1.3550 could trigger a strong rally. Traders should monitor support and resistance levels carefully and ensure risk management is in place.

GBPUSDGBP/USD 10-Year Bond Yield, Interest Rate Differential, Carry Trade, and Uncovered Interest Rate Parity
1.the current 10-Year Bond Yields or UK 10-Year Gilt Yield: 4.63% (as of June 9, 2025), down slightly from recent highs but elevated due to persistent inflation concerns,while the US 10-Year Treasury Yield stands at 4.50% (as of June 9, 2025), reflecting fiscal uncertainties and moderated Fed rate cut expectations.
2.the Interest Rate Differential will be The 10-year yield spread (UK minus US) ,which is +0.13% (4.63% – 4.50%), favoring UK gilts.
The policy rate differential (BoE: 4.25%, Fed: 4.25–4.50%) is neutral to slightly negative for GBP, as the Fed holds rates steady while the BoE recently cut.
3. Carry Trade Implications
The modest yield spread provides a limited carry trade advantage for GBP over USD. Investors borrowing in USD to buy GBP assets gain a small yield pickup (~0.13%), but this is offset by:
Currency risk: GBP/USD volatility.
Economic uncertainty: UK inflation (3.5% y/y) remains sticky, while US growth and fiscal risks dominate.
4. Uncovered Interest Rate Parity (UIP)
UIP predicts the GBP should depreciate against USD by ~0.13% annually to offset the higher UK yield. However, deviations are common due to:
Risk premiums: Safe-haven USD demand during global uncertainty.
Diverging central bank policies: BoE’s recent rate cut vs. Fed’s cautious stance.
Inflation dynamics: UK CPI (3.5%) exceeds US forecasts (2.5%), pressuring BoE to maintain tighter policy despite cuts.
Key Data: UK services PMI (June 13) and US CPI (June 11) will dictate near-term momentum. A stronger US CPI print could widen the rate differential in favor of USD, pressuring GBP.
stay cautious .
#gbpusd

SHORT ON GBP/USDGBP/USD has just broken a uptrend line and has given us a nice break and retest to that same trendline.
The bearish have shown up and the dollar is currently looking bullish
I will be selling GBP/USD to the next level of demand for 50-80 pips

GBPUSD Sell- Go for sell if setup given then manage your trade
- potentially go lower
- Refine entry with smaller SL for better RR, if your strategy allow
A Message To Traders:
I’ll be sharing high-quality trade setups for a period time. No bullshit, no fluff, no complicated nonsense — just real, actionable forecast the algorithm is executing. If you’re struggling with trading and desperate for better results, follow my posts closely.
Check out my previously posted setups and forecasts — you’ll be amazed by the high accuracy of the results.
"I Found the Code. I Trust the Algo. Believe Me, That’s It."

CHECK GBPUSD SIGNALS READ CAPTAIN GBPUSD Sell zone
TRADE
Entry point 1.35795
Take profit Target 1.34816
Stop loss 1.35949
Follow money Menagment

GBPUSD Edges HigherGBPUSD Edges Higher
GBP/USD is attempting a fresh increase above the 1.3500 resistance.
Important Takeaways for GBP/USD Analysis Today
- The British Pound is attempting a fresh increase above 1.3515.
- There was a break above a key bearish trend line with resistance at 1.3535 on the hourly chart of GBP/USD at FXOpen.
GBP/USD Technical Analysis
On the hourly chart of GBP/USD at FXOpen, the pair declined after it failed to clear the 1.3615 resistance. The British Pound even traded below the 1.3575 support against the US Dollar.
Finally, the pair tested the 1.3500 zone and is currently attempting a fresh increase. The bulls were able to push the pair above the 50-hour simple moving average and 1.3540. There was a break above a key bearish trend line with resistance at 1.3535.
The pair tested the 50% Fib retracement level of the downward move from the 1.3616 swing high to the 1.3507 low. It is now showing positive signs above 1.3540.
On the upside, the GBP/USD chart indicates that the pair is facing resistance near 1.3575 and the 61.8% Fib retracement level of the downward move from the 1.3616 swing high to the 1.3507 low.
The next major resistance is near 1.3590. A close above the 1.3590 resistance zone could open the doors for a move toward 1.3615. Any more gains might send GBP/USD toward 1.3650.
On the downside, immediate support is near the 1.3515. If there is a downside break below 1.3515, the pair could accelerate lower. The first major support is near the 1.3500 level. The next key support is seen near 1.3450, below which the pair could test 1.3420. Any more losses could lead the pair toward the 1.3350 support.
This article represents the opinion of the Companies operating under the FXOpen brand only. It is not to be construed as an offer, solicitation, or recommendation with respect to products and services provided by the Companies operating under the FXOpen brand, nor is it to be considered financial advice.

Buy opportunity when price retraces to break the topGBPUSD encounters resistance at 1.358, there is a high possibility that there will be a price reaction to 1.35500 to create a Dow break 1.358 towards higher levels.
GBPUSD is increasing very strongly again in the main trend, we wait for a retracement to the support zones, which is a strong buying opportunity.
1.358-1.355-1.351-1.345 are BUY zones when the price has a reaction of buying force at these price zones.
GBPUSD BULLISH OR BEARISH DETAILED ANALYSISGBPUSD is showing strong bullish momentum after successfully bouncing off the key support zone around 1.34300. This level, which previously acted as a major resistance, has now flipped into solid support, confirming a classic breakout-retest structure. With the daily chart printing higher highs and higher lows, the market is clearly building a bullish continuation structure. Price action above this level signals that the bulls are gaining confidence, and we are now setting up for a clean run toward the 1.38000 target in the coming sessions.
Fundamentally, the British pound is currently benefitting from improved economic sentiment in the UK. With services PMI holding firm and inflation slowly coming under control, there’s growing speculation that the Bank of England could maintain a more hawkish stance compared to the Fed. Meanwhile, the US dollar is facing pressure due to softer labor data and increased expectations for a potential rate cut later this year. This divergence between the BoE and Fed is creating a favorable environment for GBP strength against USD.
From a technical perspective, the bounce off support is being validated with strong bullish candlesticks and momentum continuation. The market structure remains intact with a bullish trendline, and Fibonacci confluence levels are lining up perfectly to support higher price objectives. The nearest resistance sits just under 1.36000, and a break above that would likely trigger accelerated buying pressure toward the 1.38000 handle. Traders watching for trend continuation setups will find this level highly attractive.
GBPUSD is preparing for another bullish wave, and this structure remains one of the cleaner technical patterns in the majors right now. As long as the pair holds above 1.34300, the bias remains bullish with potential for extended gains. Monitor DXY and Fed rate sentiment closely, but with current fundamentals aligning with technicals, this setup is shaping up to be a high-probability bullish continuation.

a lower move expected after liquidity raidMonday should seek liquidity higher from previous sessions then a move lower will be expected. this is also seen by the dollar move lower first to go higher

Sell GBPUSDGBPUSD may fall from this area judging from the current trend and movement of price within this rising channel. Overall, this pair is bullish, this is only a pull back trade before the bulls resume next week.

GBP/USD – 1H Chart Pattern: Bullish Momentum AB=CD GBP/USD – 1H Chart
Pattern: Bullish AB=CD
Trend: Bullish Momentum Detected
🔹 Entry (EP): Instant Buy @ 1.35694
🔹 Stop Loss (SL): 1.35004
🔹 Take Profit (TP1): 1.36352
🔹 Take Profit (TP2): — (Trail if desired or wait for new structure)
🔹 Lot Size: 0.14
🔹 Risk/Reward Ratio: 1:1
🔹 Risk: $100 💸
🔹 Reward: $100 💰
📊 The AB=CD harmonic pattern confirms a potential bullish reversal zone, and price action aligns with this projection on the 1H chart. Clean setup for short-term intraday traders.
⚠️ As always, manage risk properly and adjust your strategy based on market conditions.
#GBPUSD #ForexTrading #PriceAction #HarmonicPattern #TradingSetup #ForexSignals #TechnicalAnalysis #ABCDPattern #1HRChart #RiskReward #BullishSetup

The Day Ahead🇺🇸 United States
NY Fed 1-Year Inflation Expectations: Rose slightly to 3.1% in May from 3.0% in April. This suggests increasing consumer concerns about short-term inflation, potentially influencing Fed policy.
Wholesale Trade Sales (April): Awaiting data.
🇨🇳 China
May CPI: Up 0.3% YoY, but fell 0.1% MoM — indicating weak consumer demand.
May PPI: Fell 1.4% YoY, a slower decline than before, suggesting factory-gate prices may be stabilizing.
Trade Balance: Surplus widened to $103.22 billion. Exports rose 4.8% YoY, but exports to the U.S. dropped 34.5%, reflecting trade tensions.
🇯🇵 Japan
Economy Watchers Survey (May): Sentiment remains cautious due to global economic uncertainties.
Bank Lending (May) and BoP Current Account/Trade Balance (April): Data not yet released but a current account surplus is expected.
🇪🇺 ECB
Frank Elderson (ECB Executive Board): Speaking today. Markets will watch closely for signals on future ECB rate moves in light of recent inflation and growth data.
This communication is for informational purposes only and should not be viewed as any form of recommendation as to a particular course of action or as investment advice. It is not intended as an offer or solicitation for the purchase or sale of any financial instrument or as an official confirmation of any transaction. Opinions, estimates and assumptions expressed herein are made as of the date of this communication and are subject to change without notice. This communication has been prepared based upon information, including market prices, data and other information, believed to be reliable; however, Trade Nation does not warrant its completeness or accuracy. All market prices and market data contained in or attached to this communication are indicative and subject to change without notice.

GU-Mon-9/06/25 TDA-GU back in the range after NFPAnalysis done directly on the chart
Follow for more, possible live trades update!
When sometimes you don't take trades, you
can always take notes and learn more than
you already know about market movement,
price fluctuations, developing better pattern
recognition.
Active in London session!
Not financial advice, DYOR.
Market Flow Strategy
Mister Y


GBPUSD INTRADAY Uptrend continuation supported at 1.3500The GBP/USD currency pair maintains a bullish sentiment, supported by a rising trendline and sustained higher lows. The recent intraday price action suggests a corrective pullback within an overall uptrend, indicative of a consolidation phase rather than a reversal.
Key Support Level: 1.3500
This level aligns with a previous consolidation zone and is acting as a pivotal support. A pullback toward this level could offer a potential buying opportunity, especially if bullish momentum returns.
Upside Targets (on bullish continuation from 1.3500):
1.3610 – Initial resistance from prior swing high
1.3650 – Intermediate resistance level
1.3700 – Long-term target and potential top of the current bullish channel
Bearish Scenario (if 1.3500 fails):
A daily close below 1.3500 would invalidate the current bullish setup, signaling a potential shift in trend. In that case:
Immediate support at 1.3480
Deeper retracement could extend to 1.3450
Conclusion
The broader trend in GBP/USD remains bullish, with the current consolidation viewed as a potential pullback rather than a reversal. The 1.3500 level is critical — a bounce from here could resume the uptrend toward 1.3610 over time. However, a break and close below 1.3500 would weaken the bullish case and open the door to further downside. Traders should monitor price action closely around this key level for confirmation.
This communication is for informational purposes only and should not be viewed as any form of recommendation as to a particular course of action or as investment advice. It is not intended as an offer or solicitation for the purchase or sale of any financial instrument or as an official confirmation of any transaction. Opinions, estimates and assumptions expressed herein are made as of the date of this communication and are subject to change without notice. This communication has been prepared based upon information, including market prices, data and other information, believed to be reliable; however, Trade Nation does not warrant its completeness or accuracy. All market prices and market data contained in or attached to this communication are indicative and subject to change without notice.

Bullish bounce off pullback support?The Cable (GBP/USD) is falling towards the pivot which is a pullback support and could bounce to the 1st resistance.
Pivot: 1.3411
1st Support: 1.3100
1st Resistance: 1.3714
Risk Warning:
Trading Forex and CFDs carries a high level of risk to your capital and you should only trade with money you can afford to lose. Trading Forex and CFDs may not be suitable for all investors, so please ensure that you fully understand the risks involved and seek independent advice if necessary.
Disclaimer:
The above opinions given constitute general market commentary, and do not constitute the opinion or advice of IC Markets or any form of personal or investment advice.
Any opinions, news, research, analyses, prices, other information, or links to third-party sites contained on this website are provided on an "as-is" basis, are intended only to be informative, is not an advice nor a recommendation, nor research, or a record of our trading prices, or an offer of, or solicitation for a transaction in any financial instrument and thus should not be treated as such. The information provided does not involve any specific investment objectives, financial situation and needs of any specific person who may receive it. Please be aware, that past performance is not a reliable indicator of future performance and/or results. Past Performance or Forward-looking scenarios based upon the reasonable beliefs of the third-party provider are not a guarantee of future performance. Actual results may differ materially from those anticipated in forward-looking or past performance statements. IC Markets makes no representation or warranty and assumes no liability as to the accuracy or completeness of the information provided, nor any loss arising from any investment based on a recommendation, forecast or any information supplied by any third-party.

GBPUSD H1 Bearish eversal Based on the H1 chart analysis, we can see that the price is rising toward our sell entry at 1.3567, which is a pullback resistance.
Our take profit will be at 1.3537, a pullback support level.
The stop loss will be placed at 11.3602, above the recent swing-high resistance level.
High Risk Investment Warning
Trading Forex/CFDs on margin carries a high level of risk and may not be suitable for all investors. Leverage can work against you.
Stratos Markets Limited (tradu.com/uk ):
CFDs are complex instruments and come with a high risk of losing money rapidly due to leverage. 63% of retail investor accounts lose money when trading CFDs with this provider. You should consider whether you understand how CFDs work and whether you can afford to take the high risk of losing your money.
Stratos Europe Ltd (tradu.com/eu ):
CFDs are complex instruments and come with a high risk of losing money rapidly due to leverage. 63% of retail investor accounts lose money when trading CFDs with this provider. You should consider whether you understand how CFDs work and whether you can afford to take the high risk of losing your money.
Stratos Global LLC (tradu.com/en ):
Losses can exceed deposits.
Please be advised that the information presented on TradingView is provided to Tradu (‘Company’, ‘we’) by a third-party provider (‘TFA Global Pte Ltd’). Please be reminded that you are solely responsible for the trading decisions on your account. There is a very high degree of risk involved in trading. Any information and/or content is intended entirely for research, educational and informational purposes only and does not constitute investment or consultation advice or investment strategy. The information is not tailored to the investment needs of any specific person and therefore does not involve a consideration of any of the investment objectives, financial situation or needs of any viewer that may receive it. Kindly also note that past performance is not a reliable indicator of future results. Actual results may differ materially from those anticipated in forward-looking or past performance statements. We assume no liability as to the accuracy or completeness of any of the information and/or content provided herein and the Company cannot be held responsible for any omission, mistake nor for any loss or damage including without limitation to any loss of profit which may arise from reliance on any information supplied by TFA Global Pte Ltd.
The speaker(s) is neither an employee, agent nor representative of Tradu and is therefore acting independently. The opinions given are their own, constitute general market commentary, and do not constitute the opinion or advice of Tradu or any form of personal or investment advice. Tradu neither endorses nor guarantees offerings of third-party speakers, nor is Tradu responsible for the content, veracity or opinions of third-party speakers, presenters or participants.

GBPUSD is relatively stable, main uptrendOANDA:GBPUSD performed relatively steady among major currencies. The UK's avoidance of Trump's new steel and aluminum tariffs supported the pound and market sentiment remained relatively upbeat.
The UK releases April GDP and employment data this week, and markets are paying close attention. If the unemployment rate rises, that could drag the pound down; if it shows a healthy labour market, that could push it higher.
Bank of England Governor Bailey said he would continue to adopt a “gradual and cautious” interest rate cut strategy, reflecting a cautious stance amid heightened market volatility. The statement was interpreted by the market as hawkish, which helped support the pound. Britain is not a target of Trump’s new tariff policy, and the market believes that the US-UK trade relationship is relatively friendly, which has boosted the British stock market and the pound.
The fact that the UK is not affected by Trump’s steel and aluminium tariffs is a positive for the pound, but this week’s jobs data will be key. If unemployment rises in April, it could undermine sterling’s gains. The market is positive about the Bank of England’s cautious monetary policy stance, believing that this will help the pound maintain its strength in the short term.
On the daily chart, OANDA:GBPUSD is temporarily capped by the 1.35877 price level of the 0.618% Fibonacci extension and the overall technical outlook remains overwhelmingly bullish.
Key supports are seen by the rising price channel and the EMA21, while the bullish RSI has yet to reach overbought levels, suggesting that there is still plenty of room for GBP/USD to move higher in terms of momentum. As long as GBP/USD remains within the price channel, it will remain bullish in the short term, and once GBP/USD breaks above 1.35911, which is the nearest horizontal resistance, it will be eligible to continue its technical rise towards the next target around 1.37104 in the short term.
During the day, the bullish outlook of GBP/USD will be noticed by the following technical positions.
Support: 1.35015 – 1.34441
Resistance: 1.35877 – 1.35911

GBPUSD(20250609)Today's AnalysisMarket news:
Fed Harker: Amid uncertainty, the Fed may still cut interest rates later this year. Musallem: There is a 50% chance that the trade war will lead to a sustained inflation outbreak. Tariffs may push up inflation within one or two quarters. The ECB cut three key interest rates by 25 basis points. Lagarde hinted that the rate cut cycle will end, and the market is no longer fully pricing in another 25 basis point rate cut this year.
Technical analysis:
Today's buying and selling boundaries:
1.3538
Support and resistance levels:
1.3615
1.3586
1.3568
1.3509
1.3491
1.3462
Trading strategy:
If the price breaks through 1.3538, consider buying in, with the first target price of 1.3568
If the price breaks through 1.3509, consider selling in, with the first target price of 1.3491

GBPUSD bearish movement on HTFGBPUSD will make bearish movement after making BSL in weekly key level area.

GBPUSD ANALYSISAfter seeing the previous week close above 135.000 we could expect a retest of that area before the market continues to the upside, but in the mean time the daily and 4hr are currently showing bearish type setups which could be a sign that the retracement on the weekly could form

GBPUSD DAILY OUTLOOK - OVERBROUGHTGBPUSD heavily bullish
No valid pullbacks -expecting price to drop
GBPUSD has over brought and current price momentum shows that sellers can get in power
Enough sell side liquidity has been created for price to drop to discount levels
Use 2/4 hour time frame as guide and confirm if trend will shift
