GU| Building the Bullish Case4H showing strong bullish momentum, so I’ve dropped down to the 30M to catch continuation setups.
Right now, I’m watching for SSL to get taken before I look for LTF confirmations and entries.
Letting price do its thing first—patience is part of the play. 🧠
Waiting mode: activated. 🎯
– Inducement King
Bless Trading!
GBPUSD_SPT trade ideas

Market next move 🔍 Disruption/Critique of the Current Target Analysis:
1. Lack of Technical Justification:
The chart marks a “Target” level without referencing a clear technical basis (e.g., resistance, Fibonacci level, or moving average).
Without a corresponding pattern or indicator signal (e.g., breakout, double bottom, divergence), the target seems arbitrary.
2. Volume Spike Misinterpretation:
While there’s a volume spike in the last candle, it's accompanied by a bearish candle, suggesting potential selling pressure, not buying strength.
A bullish continuation would ideally require a green candle with increasing volume, which is absent here.
3. Market Context Ignored:
No consideration of broader market context such as macroeconomic news, DXY strength, or interest rate expectations which heavily impact GBP/USD.
The U.S. flag icon indicates upcoming news – trading before such events can be risky and invalidate the technical target.
4. Resistance Zone Overlooked:
The “Target” lies near the 1.3500 psychological level, which often acts as resistance. This isn’t discussed or marked.
Recent price action near that level shows rejection, making it a questionable target without strong buying confirmation

SELLS ON GBPUSD There is a continuation trend that is still seeking for liquidity before the buys. Market is still delivering bearish.

Long term vision on Pound, seems bullish.Not muc to say, graph is so clear.
If we look at the long term chart - which starts in 2008 crisis, trend broken in 2024 summer.
We can see a clean breakout from the fallen wedge, also there is a cup % handle breakout in the last candle.
As a supporting point, my power indicators are also supporting a long signal.
So it's a clear bullish signal on my side.
Be aware that each candle represents 3 months.
Wondering about your thoughts!

GBPUSD: If Trump could lower the rates! Hello Traders, If Trump could lower the race, we will see more bullish weeks for the pair. At least for this week I'm more Bullish!
The indicated levels are determined based on the most reaction points and the assumption of approximately equal distance between the zones.
Some of these points can also be confirmed by the mathematical intervals of Murray.
You can enter with/without confirmation. IF you want to take confirmation you can use LTF analysis, Spike move confirmation, Trend Strength confrimation and ETC.
SL could be placed below the zone or regarding the LTF swings.
TP is the next zone or the nearest moving S&R, which are median and borders of the drawn channels.
*******************************************************************
Role of different zones:
GREEN: Just long trades allowed on them.
RED: Just Short trades allowed on them.
BLUE: both long and short trades allowed on them.
WHITE: No trades allowed on them! just use them as TP points

GBPUSD Is Bearish! Short!
Here is our detailed technical review for GBPUSD.
Time Frame: 12h
Current Trend: Bearish
Sentiment: Overbought (based on 7-period RSI)
Forecast: Bearish
The market is trading around a solid horizontal structure 1.347.
The above observations make me that the market will inevitably achieve 1.325 level.
P.S
Please, note that an oversold/overbought condition can last for a long time, and therefore being oversold/overbought doesn't mean a price rally will come soon, or at all.
Disclosure: I am part of Trade Nation's Influencer program and receive a monthly fee for using their TradingView charts in my analysis.
Like and subscribe and comment my ideas if you enjoy them!

GBPUSD BULLISH OR BEARISH DETAILED ANALYSIS ??GBPUSD has successfully completed its retest of the 1.34300–1.34500 support zone and is now showing strong signs of resuming its bullish momentum. The recent structure confirms a classic bullish continuation pattern, as price bounced cleanly off a critical support level that previously acted as resistance. This level has now flipped into a solid demand zone, giving buyers confidence to push toward the 1.40000 psychological target. Price action continues to respect the uptrend with higher lows forming since mid-April, suggesting strength and institutional accumulation.
From a macroeconomic perspective, the British pound remains fundamentally supported. Recent UK inflation data surprised to the upside, causing the market to delay rate cut expectations from the Bank of England. In contrast, the US dollar is weakening due to rising expectations that the Federal Reserve could initiate rate cuts later this year as inflation cools and labor market data softens. This divergence in policy outlooks between the BoE and the Fed is fueling bullish pressure on GBPUSD, making the 1.40000 level a realistic and high-probability target.
Technical confluence also supports this bullish wave. Fibonacci retracement levels drawn from the recent swing low to the high align closely with the support zone at 1.34300, which acted as a perfect retest before the next leg higher. Additionally, the bullish engulfing candles and consistent daily closes above the support level add further confirmation to the upside bias. As long as the pair holds above 1.34300, the structure favors bulls with strong momentum to test and potentially break the 1.38000 intermediate level on the way to 1.40000.
GBPUSD remains a high-confidence bullish opportunity, aligning both technically and fundamentally. The recent breakout and retest phase is complete, and the pair now appears poised for a sustained rally. With bullish market sentiment, favorable UK data, and USD softness across the board, this setup offers an excellent risk-to-reward ratio for medium-term swing traders targeting the 1.40000 zone.

GBPUSD sell ? There is nothing hard here, just follow the trend if it does not go that way its okkay, but just draw on wave fib retracement , it did hit blue zone and just now go down. Pretty simple setup , massive RRR here and as i said if it dont go this way its okkay, just wait for next one. These are 8H candles they should be more precise than smaller candles. Will see how it goes
GL Traders
NOT ADVICE !

GBPUSDOn monthly char, we saw the pattern from the supply roof which brings us to monthly close today ,GBPUSD short could be the next bias based on the economic data and structure, however if uk economy show strong resilience and the 10 bond yield continues to rise and interest rate stay steady ,British pounds could up swing on demand, if buy condition favors carry traders.
#gbpusd #dollar #gbp

GBPUSD - Predictive Analysis & ForecastingGBPUSD
Scales
- S: 1.3169 activation triggers 1.3347 (unless falls to 1.3100)
- M1: 1.3426 activation triggers 1.3131 pivot
- M2: 13555 activation triggers 1.3109
- L: pending at 1.3664
Forecast & Targets
- ST: bearish risk down to 1.3100
- MT: bullish, up to 1.3664
#GBPUSD #Forex #CROW2.0
4xForecaster
------
Originally published on BlueSky

GBPUSD May 30 Bias and Logic for a sell off dayGBPUSD
May 30
Bias and Logic for a sell off day
*Cycle consolidation coming into Asia
*Previous buy side liquidity taken at NY 9 Macro coming into NY close to consolidation
*Premium on the day with a sell off idea for Asia and London, to rebalance yesterdays inefficiencies
Dealer delivery price takes NY 9 macro buy stop then creates smooth equal highs, likely hood of it swinging high to take liquidity to drop for the sell profile Im anticipating
*higher equal highs 1.35226 not taken made me nervous, sometimes price is greedy
*Price swings up 21:00 macro to take noted equal highs
* note the higher highs wicking at the 50% level
*note how its just the wicks no bodies touch the 50
I was using this logic to frame EUR short sell trade I was hunting for

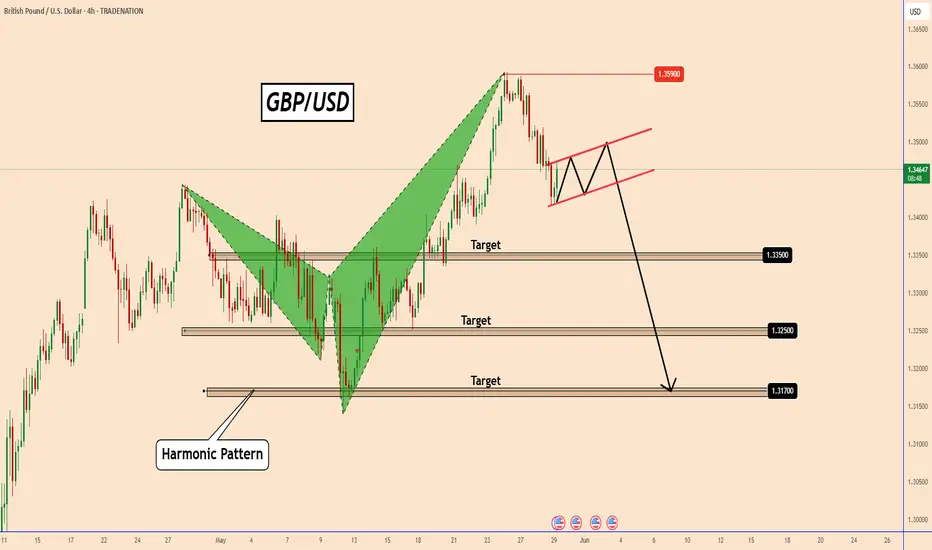
GBPUSD Poised for a Bearish MoveGBPUSD Poised for a Bearish Move
On the 4-hour chart, GBPUSD has completed an ugly variation of a Harmonic Pattern.
While the pattern itself is not ideal, it successfully prevented the price from rising above 1.3590.
The market surged unexpectedly a few days ago, following Trump’s aggressive 50% tariff proposal on Europe, but today, GBPUSD is reversing course.
Yesterday, a trade court blocked Trump’s tariffs, ruling that he overstepped his authority with broad import duties.
This decision gave a boost to the US dollar, and after a brief pause, GBPUSD may now be setting up for a bearish trend.
Targets: 1.3350 | 1.3250 | 1.3170
You may find more details in the chart!
Thank you and Good Luck!
❤️PS: Please support with a like or comment if you find this analysis useful for your trading day❤️
Disclosure: I am part of Trade Nation's Influencer program and receive a monthly fee for using their TradingView charts in my analysis.
GBP/USD💰Symbol: { GBP/USD }
🟩Price: { 1.34581 }
🟥Stop: { 1.34215 }
1️⃣profit: { 1.34835 }
2️⃣profit: { 1.35216 }
3️⃣profit: { 1.35719 }
📊Check your chart before entering.
🚨Check before use to make sure there is no important news.🚨

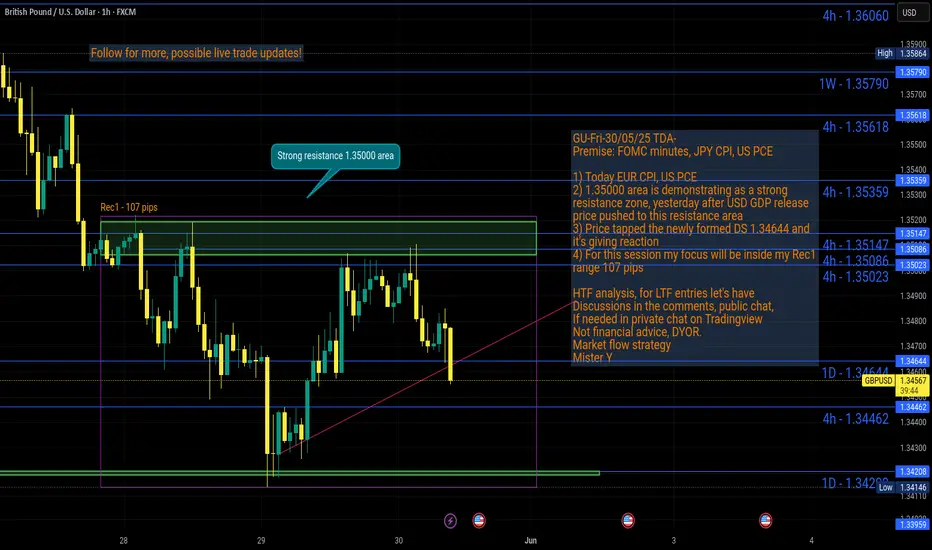
GU-Fri-30/05/25 TDA-Strong resistance 1.35000 zone! Analysis done directly on the chart
Follow for more, possible live trades update!
I trade zone to zone, from support to resistance,
and vice versa. Once I see price entering my
zone of interest, I see how candle reacts to the
level.
Not financial advice, DYOR.
Market Flow Strategy
Mister Y
Correction The correction is expected to end at the current support level and the start of an uptrend is expected.
If the price breaks through the 78.6% level, a continuation of the downtrend is likely.

Inducement has been swept Here is a buy trade on Gbpusd , and my inducement just got cleared out so it's a positive buy for me

Falling towards 61.8% Fibonacci support?The Cable (GBP/USD) is falling towards the pivot, which serves as pullback support and could bounce to the 1st resistance, which acts as pullback resistance.
Pivot: 1.3315
1st Support: 1.3159
1st Resistance: 1.3586
Risk Warning:
Trading Forex and CFDs carries a high level of risk to your capital and you should only trade with money you can afford to lose. Trading Forex and CFDs may not be suitable for all investors, so please ensure that you fully understand the risks involved and seek independent advice if necessary.
Disclaimer:
The above opinions given constitute general market commentary, and do not constitute the opinion or advice of IC Markets or any form of personal or investment advice.
Any opinions, news, research, analyses, prices, other information, or links to third-party sites contained on this website are provided on an "as-is" basis, are intended only to be informative, is not an advice nor a recommendation, nor research, or a record of our trading prices, or an offer of, or solicitation for a transaction in any financial instrument and thus should not be treated as such. The information provided does not involve any specific investment objectives, financial situation and needs of any specific person who may receive it. Please be aware, that past performance is not a reliable indicator of future performance and/or results. Past Performance or Forward-looking scenarios based upon the reasonable beliefs of the third-party provider are not a guarantee of future performance. Actual results may differ materially from those anticipated in forward-looking or past performance statements. IC Markets makes no representation or warranty and assumes no liability as to the accuracy or completeness of the information provided, nor any loss arising from any investment based on a recommendation, forecast or any information supplied by any third-party.

GBP/USD H1 Multiple Trade ScenariosScenario A: Bullish Pullback (Preferred)
Entry: Buy 1.341–1.344 on a clear bullish rejection candle
Stop-Loss: 1.338 (below the recent higher-low)
Take-Profit:
TP1: 1.352 (first resistance/lower-high)
TP2: 1.360 (recent swing-high)
Scenario B: Breakout Play
Trigger: H1 candle closes above 1.352
Entry: Long on a retest of 1.352 as new support
Stop-Loss: 1.350
Take-Profit: 1.361–1.365 (measured extension above the prior high)
Scenario C: Counter-Trend Short
Zone: 1.350–1.352 resistance area
Entry: Short on a bearish rejection candle up in that zone
Stop-Loss: 1.353
Take-Profit:
Target: 1.344 (minor support)
Extended: 1.341 (higher-low area)

GBPUSD M15 | Bearish Drop Based on the M15 chart, the price is approaching our sell entry level at 1.3486, a pullback resistance that aligns close to the 50% Fibo retracement.
Our take profit is set at 1.3448, a pullback support.
The stop loss is set at 1.3520, an overlap resistance.
High Risk Investment Warning
Trading Forex/CFDs on margin carries a high level of risk and may not be suitable for all investors. Leverage can work against you.
Stratos Markets Limited (tradu.com ):
CFDs are complex instruments and come with a high risk of losing money rapidly due to leverage. 63% of retail investor accounts lose money when trading CFDs with this provider. You should consider whether you understand how CFDs work and whether you can afford to take the high risk of losing your money.
Stratos Europe Ltd (tradu.com ):
CFDs are complex instruments and come with a high risk of losing money rapidly due to leverage. 63% of retail investor accounts lose money when trading CFDs with this provider. You should consider whether you understand how CFDs work and whether you can afford to take the high risk of losing your money.
Stratos Global LLC (tradu.com ):
Losses can exceed deposits.
Please be advised that the information presented on TradingView is provided to Tradu (‘Company’, ‘we’) by a third-party provider (‘TFA Global Pte Ltd’). Please be reminded that you are solely responsible for the trading decisions on your account. There is a very high degree of risk involved in trading. Any information and/or content is intended entirely for research, educational and informational purposes only and does not constitute investment or consultation advice or investment strategy. The information is not tailored to the investment needs of any specific person and therefore does not involve a consideration of any of the investment objectives, financial situation or needs of any viewer that may receive it. Kindly also note that past performance is not a reliable indicator of future results. Actual results may differ materially from those anticipated in forward-looking or past performance statements. We assume no liability as to the accuracy or completeness of any of the information and/or content provided herein and the Company cannot be held responsible for any omission, mistake nor for any loss or damage including without limitation to any loss of profit which may arise from reliance on any information supplied by TFA Global Pte Ltd.
The speaker(s) is neither an employee, agent nor representative of Tradu and is therefore acting independently. The opinions given are their own, constitute general market commentary, and do not constitute the opinion or advice of Tradu or any form of personal or investment advice. Tradu neither endorses nor guarantees offerings of third-party speakers, nor is Tradu responsible for the content, veracity or opinions of third-party speakers, presenters or participants.

OMH or peaked already... let me know your thoughts :)So we are at a potential reversal situation.
I'lll try to update my idea in the next days, but this is what I've got at the moment.
There's room for OMH, but if you're playing it safe, I'm shorting from now, and then if this changes, I may consider hedging for some small play win, but otherwise my target is down for the mid term movement.
Thoughts?

Relative Equal HighsThere is a tone of liquidity up there and we are shaping up for the 2nd leg up on the buy side of the curve.

GBPUSD - SO MANY BULLISH SIGNS ! confirmed TPs HIT GBPUSD- Market is moving in a Bullish Channel since long. Market has formed Bullish continuation pattern and that's how we can predict a projection of TPs which is also well within a channel. Market has also retraced and bounced back from the FIB LEVEL of 0.382 which is also a good support level followed by the 3 white soldiers pattern.
ENTRY POINT & STOPLOSS with TPs :
we plan entry on the break out of resistance level (market has instant entry point) which is break of HH and keeping our SL below the HL / FIB 0.382 level or the resistance level.
