GBP/USD Breakout (28.05.2025)The GBP/USD Pair on the M30 timeframe presents a Potential Selling Opportunity due to a recent Formation of a Breakout Pattern. This suggests a shift in momentum towards the downside in the coming hours.
Possible Short Trade:
Entry: Consider Entering A Short Position around Trendline Of The Pattern.
Target Levels:
1st Support – 1.3424
2nd Support – 1.3380
🎁 Please hit the like button and
🎁 Leave a comment to support for My Post !
Your likes and comments are incredibly motivating and will encourage me to share more analysis with you.
Best Regards, KABHI_TA_TRADING
Thank you.
Disclosure: I am part of Trade Nation's Influencer program and receive a monthly fee for using their TradingView charts in my analysis.
GBPUSD_SPT trade ideas

GBP/USD Got the Breakout - Can Bulls Hold the Higher-Low? GBP/USD has broken out to a fresh three-year-high, finally pushing above the Fibonacci level of 1.3414. That pushed directly into a test above the 1.3500 handle, and prices have since pulled back.
Given dynamics in the USD, that bullish trend in Cable remains of attraction if we do see USD-weakness continue. But, if strength remains in DXY and USD, there's greater pullback potential for GBP/USD, with supports at 1.3250 and 1.3000 of interest for longer-term strategies. And if looking for that USD-strength backdrop, EUR/USD can be a more attractive venue given the context of a lower-high there even as GBP/USD has ripped up to a three-year-high.
For short-term pullback scenarios, traders would likely want to see support retained at prior Fibonacci resistance, around 1.3414. - js

GU sellAfter completing the 5 impulsive waves, GU should be forming a corrective pattern. We anticipate a bearish move targeting the fib levels 50%, 61.8%, or 78.6%.

GBP/USD – Fundamentals Support LONG Bias, Pound Outperforms Doll📝 Idea Description (EN):
📊 Fundamental Analysis:
🔹 🇬🇧 GBP – Strong Currency:
CPI inflation at 3.5% – highest in the G7 → pressure to keep rates elevated
Q1 GDP growth +0.7% – strong economic performance
2-year bond yields at 4.08% – market anticipates tight monetary policy
CBI retail sales -27 – short-term consumer weakness
Market expects pause or delay in rate cuts → bullish signal for GBP
🔹 🇺🇸 USD – Weak/Neutral Fundamentals:
Consumer confidence rose (98 vs 87), but...
Durable goods orders -6.3% → business spending is slowing
Fiscal expansion: Trump proposes $3.8 trillion in new spending
USD Index (DXY) down 5% since April → weakening dollar
✅ Summary:
The British pound currently holds a clear fundamental advantage. The Bank of England may delay rate cuts due to persistent inflation, while the U.S. dollar faces fiscal concerns and weakening industrial data.
➡️ Mid- to Long-term Direction: LONG
➡️ Breakout target: 1.3590+
⚠️ Disclaimer:
This content is not financial advice. It is intended for educational and analytical purposes only. Always consider your own risk management and trading strategy.

GU BUYMake is clearly looking for retracement for a better buy on GU. join jme me has we make this money together

Market next move 🧠 Disruptive Analysis:
🔴 1. False Breakout Potential
The marked box shows a consolidation zone. While the green candle breaks slightly above it, this might be a trap (false breakout). If there's no strong follow-through, price may sharply retest or drop back inside the box—a classic bull trap.
🔴 2. Bearish Volume Profile
Volume spiked on the initial drop, and even though there's some green candle volume, it’s not convincingly higher than previous bars. This could imply weak buyer commitment at this level, suggesting a potential reversal downward.
🔴 3. Overhead Resistance
Even if price breaks out, it faces immediate resistance around 1.3485–1.3500, where multiple wicks formed earlier. This could stall or reject the move, invalidating the bullish "Target."
🔴 4. Economic Risk
The U.S. economic event icons below suggest incoming USD-related news. If the data is USD-positive (e.g., strong employment or inflation), it could strengthen the dollar and push GBP/USD lower, negating the bullish move entirely.

LONG GBP/USD — Trade IdeaLONG GBP/USD — Three Talking Points
Macro & Central-Bank Divergence
UK growth beats, retail sales jump and service-CPI re-accelerates to 5.4 % y/y. Markets have pushed BoE-cut odds to near-zero for June and just one 25 bp trim by year-end, while the Fed is still priced for two cuts in 2025.
IMF nudges 2025 UK GDP up to 1.2 %. In contrast, the dollar narrative is hampered by ballooning U.S. deficit worries and tariff-policy whiplash. Net policy path favours sterling over the dollar.
Technical Structure Remains Bullish
Price action is riding a January-origin ascending channel; Monday’s spike to 1.3600 set a new three-year high, but the pull-back stalled exactly where the 21-DMA, prior breakout shelf and channel floor cluster (mid-1.34s).
14-day RSI ≥ 60 yet still shy of overbought, signalling bullish momentum with room to run.
Holding the 1.3440/70 zone keeps the next leg toward 1.3600/1.3750 in play; only a daily close below 1.3370 would break the channel and negate the setup.
Event Risk Favouring Upside Skew
BoE speakers (Pill today, Bailey tomorrow) are likely to echo the “cautious & gradual” line—supportive, not dovish.
FOMC minutes may sound hawkish, but the market has largely heard it; any dovish nuance quickly re-ignites dollar selling.
Friday’s PCE vs. Tokyo CPI: a soft U.S. core PCE print alongside sticky Japan inflation would weigh on USDJPY and bleed into broader USD softness, lifting cable toward our T1/T2 objectives.
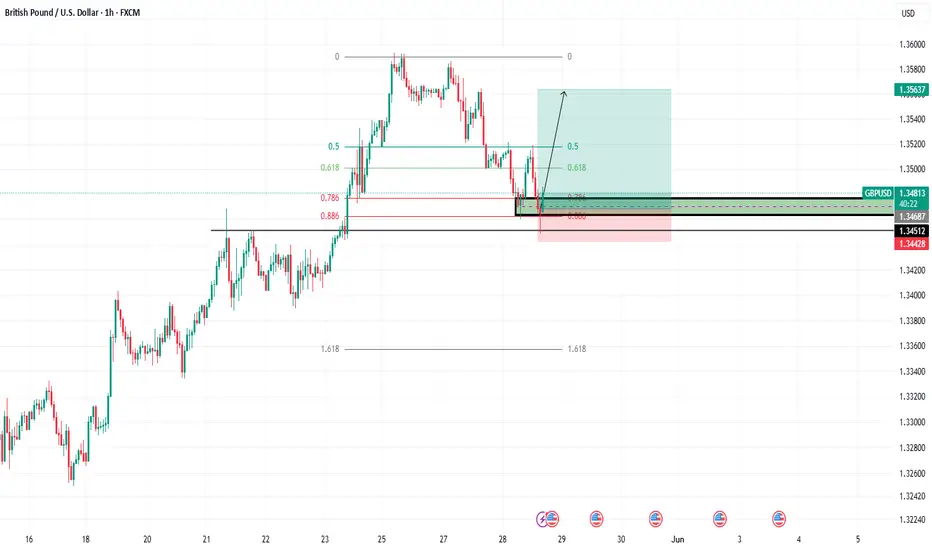
GBP/USD Correction Potentially Complete – Key Breakout LevelsHi everyone,
GBP/USD has been undergoing a short-term correction since the start of the week. Our view is that this correction may now be complete, with the bullish trend potentially resuming.
For confirmation, we’re watching for a break above the 1.35195 level, followed by a move through 1.35934.
If these levels are cleared, we anticipate further upside. We’ll continue to share updates on the projected path for GBP/USD should price action reach our key zone.
The longer-term outlook remains bullish, and we expect the rally to extend further from the 1.20991 January low.
We’ll be keeping you updated throughout the week with how we’re managing our active ideas. Thanks again for all the likes/boosts, comments and follows — we appreciate the support!
All the best for the week ahead. Trade safe.
BluetonaFX

BUY GBPUSD🚨 BUY ALERT – GBP/USD 🚨
📈 Action: Buy GBP/USD
🕒 Timing: Enter Now – Anticipating momentum shift
🗓️ Catalyst: Impact expected as FOMC event unfolds
📊 Reasoning: Market is positioning ahead of key U.S. monetary policy update. Potential volatility can push GBP/USD higher.
📌 Note:
Use tight risk management due to expected volatility.
Monitor FOMC outcome for confirmation or exit signals.
Trade smart — fundamentals + timing = opportunity.
GU POSSIBLE SHORT TERM BULL MARKETGot buy limit entry on this pair. Looking for price to start pushing up. Support should hold strong.

GBP/USD Bearish Signal | Technical + Custom AlgoSmart Sell Signal | GBP/USD – Powered by Custom Algorithm & Technical Precision
This sell signal is generated by a proprietary trading system I’ve developed, combining pure technical trend logic with automated decision-making.
The algorithm:
Confirms reversal signals through layered filter logic
Defines clean entry, stop-loss, and target zones — all fully automated
No human judgment, no discretionary trades — just objective data turned into actionable analysis.
🧠 Built on precision. Backed by testing.
📉 Current outlook: Bearish sentiment confirmed on multi-timeframe structure.
📌 Disclaimer: This is not financial advice. For educational and analytical purposes only.

GBPUSD's Potential Trend ChangeHi there,
GBPUSD currently shows bullish potential up to 1.34000, with 1.35113 open as a target, meaning the price could reach that level if the support area holds.
Potential bearish interest lies in a break below 1.32549, targeting the area around 1.29875. However, the price may drop further to 1.2800, with a bias toward 1.26000.
Happy Trading,
K.
Not a trading advice.

GBP/USD Bearish Break & Retest Setup (1H)Price has broken below a key ascending trendline and appears to be forming a lower high near the broken structure zone. I’m watching for a retest and bearish rejection from this area to confirm a short setup.
Confluences:
• Break of trendline (structure shift)
• Potential lower high forming
• EMA 20/50 curling downward
• Looking for bearish rejection candle on 1H
Entry: On confirmation of rejection
Target zone: 1.3404 → 1.3316 → 1.3260
Invalidation: Break back above the retest zone

GBPUSD May 28 Asia Hind sight studyGBPUSD
May 28 Asia Hindsight study
Admittedly I took this short and yet got in late and got stopped out, in hesitation and broke even and let it go. Darn. Here is what I observed and for my continued to studies to trust.
Premium range
Parent sentiment bullish
May 27/28 Delivery
*Price takes equal lows
*Price closes in a FVG consolidating
*20:00 Asia open price takes minor equal highs liquidity in a premium expecting for price to lower to a discount
Elements to ICT model 2022
*minor liquidity taken with a frames out bias and targets started to hunt for model 2022
*bias is bear for Asia to reach for equal lows, DXY in a discount to reach for equal highs for confidence
*20:41 4 candle pattern still learning if it is an order block
*20:46 price creates the swing low
*20:50 Price creates a FVG-first presented FVG
*20:52 entry candle macro time -should have been!!!!!!
*22:45 price takes first target of equal lows
*0:45 exit when price takes second target of equal lows
Note Review the 1 min chart for the classic ICT model 2022 candle formation.

GBPUSDthis move probbly hppen next week so i wit for next week buy oportunity becuse this week no mrket mover news nd next week more ggresive nd voltile week so i wit for it.

GBPUSDGBPUSD
sell. Market Execution. trade 1:2. riesgo 0.50%
We entered Sell because the market is respecting the sellers' zone.

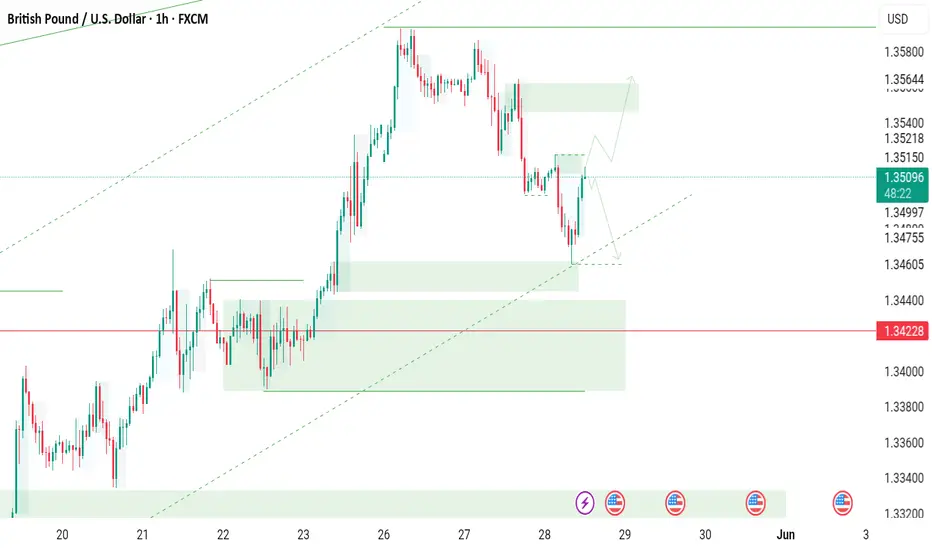
GBP/USD 1H CHART PATTERNThis GBPUSD 1-hour chart shows a recent bullish move followed by a retracement. Indicators like Ichimoku and DEMA are applied, with price currently around 1.35254. There’s visible resistance near 1.35800 and price has pulled back after reaching highs. The marked zones highlight support levels where price may react. Current market sentiment suggests a short setup aiming for lower levels, respecting the overall trend shift. Watching the price action at support zones will be important to manage risk and confirm momentum.
Entry: 1.35100
1st target: 1.34780
2nd target: 1.34500

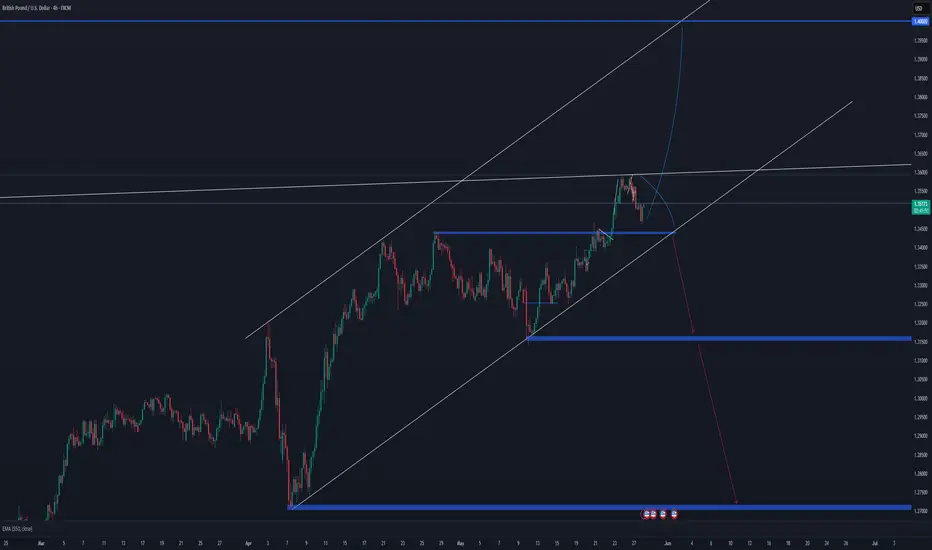
POTENTIAL TARGET FOR BULL RUN 1.4000 OR REVERSAL BACK TO 1.3000Swing traiding will take a longer time to achieve, but the behaviour of GPBUSD is showing 130 pips sell is a form of pull back to make another bullish impulse of 250 to 300 pips and it does that, it is closer to 1.4000 by then.
It could also imply that it is about to create a lower high or retest of this month's high as we are getting close to the end of May.
Bossfx Clean Swing SetupYou're looking at a 1-hour chart of GBP/USD with several important technical analysis elements in play. I'll break it down like a seasoned trader, covering market structure, Fibonacci, price action, and provide a trade plan based on the current setup.
🔍 Chart Breakdown (GBP/USD – H1)
🧠 1. Market Structure
Overall trend: Bullish, as price is making higher highs and higher lows.
Recent behavior: Price reached a high near 1.35911, then started to pull back — potentially forming a lower high.
Short-term correction: A bearish flag or wedge is developing, possibly indicating a breakdown before continuation or reversal.
📐 2. Fibonacci Analysis
The swing high is around 1.35911, and the swing low is around 1.31440.
The chart includes retracement levels:
50% zone → 1.33676
61.8% golden zone → 1.33148
78.6% deep retracement → 1.32739
🧠 These levels are key liquidity pools where price may bounce, consolidate, or reverse.
📉 3. Bearish Trade Setup
A bearish engulfing zone is highlighted near 1.35714–1.35825 (red box) — likely a supply zone or order block.
Price rejected this zone and is beginning to drop.
Your projected path shows a move toward 1.33200, right above the 78.6% fib — likely your target.
🎯 Trade Plan (Bearish Swing Idea)
Item Value
🟢 Entry Around 1.35500–1.35700 (supply zone retest if price comes back up)
🔴 Stop Loss Above 1.35950 (last swing high)
🎯 Take Profit 1 1.34014 (minor support / fib cluster)
🎯 Take Profit 2 1.33610 (61.8% fib)
🎯 Take Profit 3 1.33200 (main fib target / liquidity sweep)
➡️ Risk-to-Reward (R:R): Roughly 1:2.5 – 1:3.5, depending on exact entry and target.
🔁 Alternative Bullish Scenario (Plan B)
If price holds above 1.35000 and breaks above 1.35911:
Expect continuation toward 1.36500–1.37000
Re-evaluate the short setup immediately
📊 Tactical Notes:
Timeframe: H1 = medium-term swing (1–2 days)
Use alerts on TradingView for:
Entry zone re-entry
Break of 1.3500 trendline
Touch of 1.33200

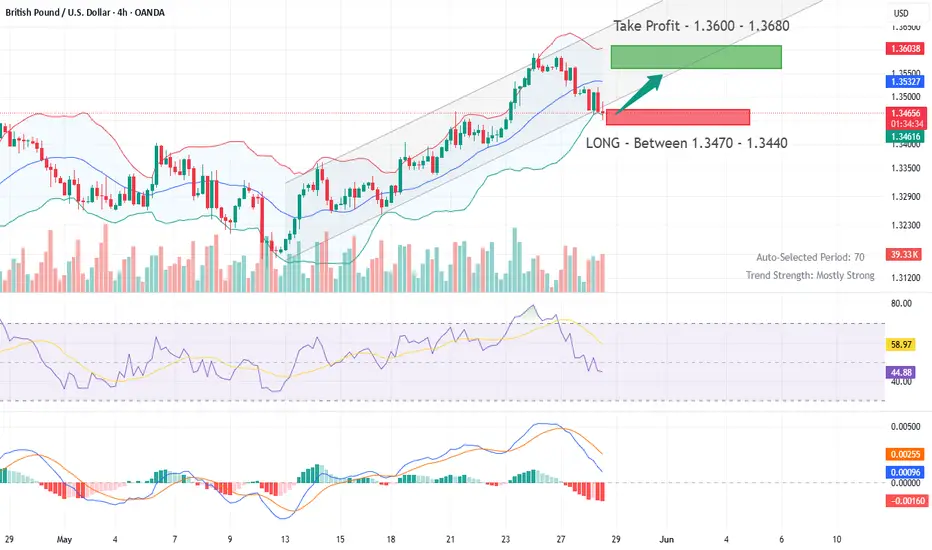
GBP/USD Analysis: Price Searching for SupportGBP/USD Analysis: Price Searching for Support
In the second half of May, the British pound showed notable strength: from its 12 May low, GBP/USD climbed to a peak on 26 May — marking its highest level in over three years.
Demand for the pound has been driven by several factors:
→ A surge in inflation. CPI data released last Wednesday came in above expectations. As a result, market participants interpreted this as a reason for the Bank of England to remain cautious about cutting interest rates. Holding rates at elevated levels is generally considered bullish for the pound.
→ The pound’s relative resilience amid trade tensions, particularly following a newly signed agreement with the US, as well as strengthening trade ties between the UK and the EU.
Can the pound continue to rise? The GBP/USD chart offers reasons for doubt.
Technical Analysis of the GBP/USD Chart
Recent price movements have formed an ascending channel (outlined in blue), and earlier this week, demand was so strong that the pair briefly moved above the upper boundary. But what happened next?
That strong buying momentum appears to have faded — resulting in a sequence of lower highs (A→B→C→D), suggesting that the market may be searching for a foothold. Today’s bounce (highlighted by the arrow) hints that such a foothold may have been found. But how reliable is it? And can the uptrend be resumed?
→ From a bullish perspective: Support may be provided by the lower boundary of the channel, reinforced by the 1.345 level.
→ From a bearish perspective: The 1.352 level is acting as resistance, further strengthened by the median line.
It is possible that the area marked by lower highs (A→B→C→D) could ultimately prove to be an insurmountable barrier for the developing uptrend on the GBP/USD chart.
This article represents the opinion of the Companies operating under the FXOpen brand only. It is not to be construed as an offer, solicitation, or recommendation with respect to products and services provided by the Companies operating under the FXOpen brand, nor is it to be considered financial advice.

GBP/USD BEST PLACE TO SELL FROM|SHORT
Hello, Friends!
The BB upper band is nearby so GBP-USD is in the overbought territory. Thus, despite the uptrend on the 1W timeframe I think that we will see a bearish reaction from the resistance line above and a move down towards the target at around 1.334.
Disclosure: I am part of Trade Nation's Influencer program and receive a monthly fee for using their TradingView charts in my analysis.
✅LIKE AND COMMENT MY IDEAS✅

GU OUTLOOK 1h structure bearish
Sign if retracement on the 4h
Waiting for structure shift to confirm realignment on all timeframes.
Also when a setup is presented on the supply zone, I might look for sell
GU 4H Outlook 4h also bullish.
Price is currently in a retracement.
Most probably sells are the only viable option for now but we will wait and see how price forms during the new York session
