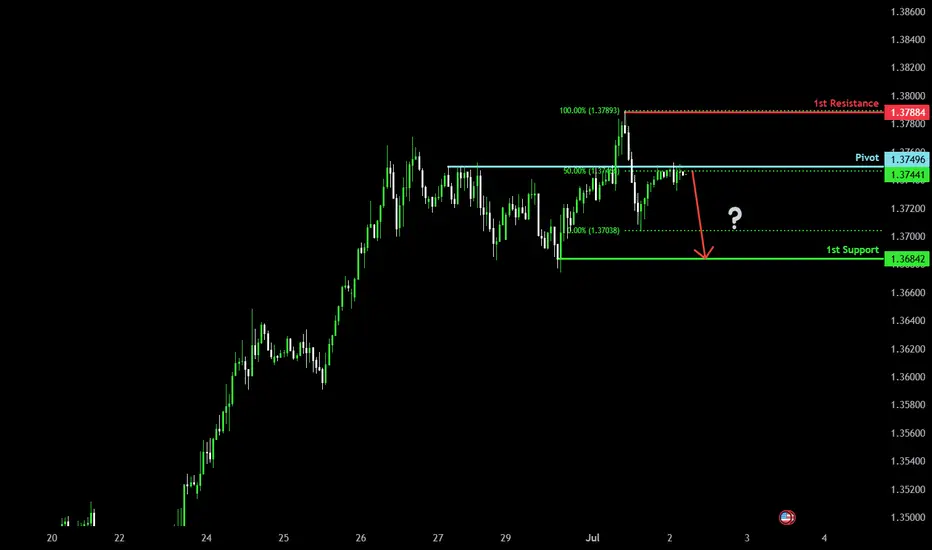
Bearish drop?The Cable (GBP/USD) is reacting off the pivot and could drop to the 1st support.
Pivot: 1.3749
1st Support: 1.3684
1st Resistance: 1.3788
Risk Warning:
Trading Forex and CFDs carries a high level of risk to your capital and you should only trade with money you can afford to lose. Trading Forex and CFDs may not be suitable for all investors, so please ensure that you fully understand the risks involved and seek independent advice if necessary.
Disclaimer:
The above opinions given constitute general market commentary, and do not constitute the opinion or advice of IC Markets or any form of personal or investment advice.
Any opinions, news, research, analyses, prices, other information, or links to third-party sites contained on this website are provided on an "as-is" basis, are intended only to be informative, is not an advice nor a recommendation, nor research, or a record of our trading prices, or an offer of, or solicitation for a transaction in any financial instrument and thus should not be treated as such. The information provided does not involve any specific investment objectives, financial situation and needs of any specific person who may receive it. Please be aware, that past performance is not a reliable indicator of future performance and/or results. Past Performance or Forward-looking scenarios based upon the reasonable beliefs of the third-party provider are not a guarantee of future performance. Actual results may differ materially from those anticipated in forward-looking or past performance statements. IC Markets makes no representation or warranty and assumes no liability as to the accuracy or completeness of the information provided, nor any loss arising from any investment based on a recommendation, forecast or any information supplied by any third-party.
GBPUSD_SPT trade ideas
GBP/USDPrice action trading is a methodology in financial markets where traders make decisions based on the actual price movements of an asset over time, rather than relying heavily on technical indicators or fundamental analysis. It involves observing and interpreting patterns and trends in price charts to predict future price movements.

High-Reward GBPUSD Setup: Entry 1.3598, TP 1.3867, SL 1.3478The GBP/USD pair has recently shown a clean bullish breakout from a short-term consolidation zone. Price has decisively moved above the 1.3478–1.3480 support-turned-resistance level, which previously acted as a ceiling within a rising channel. This breakout is meaningful—it comes after a retracement toward the lower boundary of the ascending structure, suggesting that buyers are once again gaining control.
The recent bullish candle has closed strong and full-bodied, indicating momentum. Historically, as you mentioned, GBPUSD tends to follow through for a few sessions once a bullish breakout begins. This is visible in prior moves throughout March and April, where an initial spike was often followed by two or three additional bullish candles. That behavior adds confluence to this setup.
Moreover, there is a clear path for price to move toward the long-term resistance near 1.3867, which aligns well with prior supply zones and the upper boundary of historical price reactions.
📈 Trade Idea
• Entry: 1.3598 (current price after breakout confirmation)
• Stop Loss: 1.3478 (just below the support flip and last swing low)
• Take Profit: 1.3867 (next major resistance level)
• Risk–Reward Ratio: ~2.24:1
This setup offers a clean bullish continuation pattern with room to run. If the pair maintains its current momentum, reaching the target in the next few trading days is entirely plausible. Any daily close above 1.3600 with volume would further validate the trend.

Bearish reversal off pullback resistance?The Cable (GBP/USD) is reacting off the pivot and could drop to the 1st support which is a pullback support.
Pivot: 1.3632
1st Support: 1.3533
1st Resistance: 1.2711
Risk Warning:
Trading Forex and CFDs carries a high level of risk to your capital and you should only trade with money you can afford to lose. Trading Forex and CFDs may not be suitable for all investors, so please ensure that you fully understand the risks involved and seek independent advice if necessary.
Disclaimer:
The above opinions given constitute general market commentary, and do not constitute the opinion or advice of IC Markets or any form of personal or investment advice.
Any opinions, news, research, analyses, prices, other information, or links to third-party sites contained on this website are provided on an "as-is" basis, are intended only to be informative, is not an advice nor a recommendation, nor research, or a record of our trading prices, or an offer of, or solicitation for a transaction in any financial instrument and thus should not be treated as such. The information provided does not involve any specific investment objectives, financial situation and needs of any specific person who may receive it. Please be aware, that past performance is not a reliable indicator of future performance and/or results. Past Performance or Forward-looking scenarios based upon the reasonable beliefs of the third-party provider are not a guarantee of future performance. Actual results may differ materially from those anticipated in forward-looking or past performance statements. IC Markets makes no representation or warranty and assumes no liability as to the accuracy or completeness of the information provided, nor any loss arising from any investment based on a recommendation, forecast or any information supplied by any third-party.

GBP/USD KILLEDGBP/USD milked using smart money concepts. us as displined traders we are patient we follow the rules of our trade setups harlemz fx

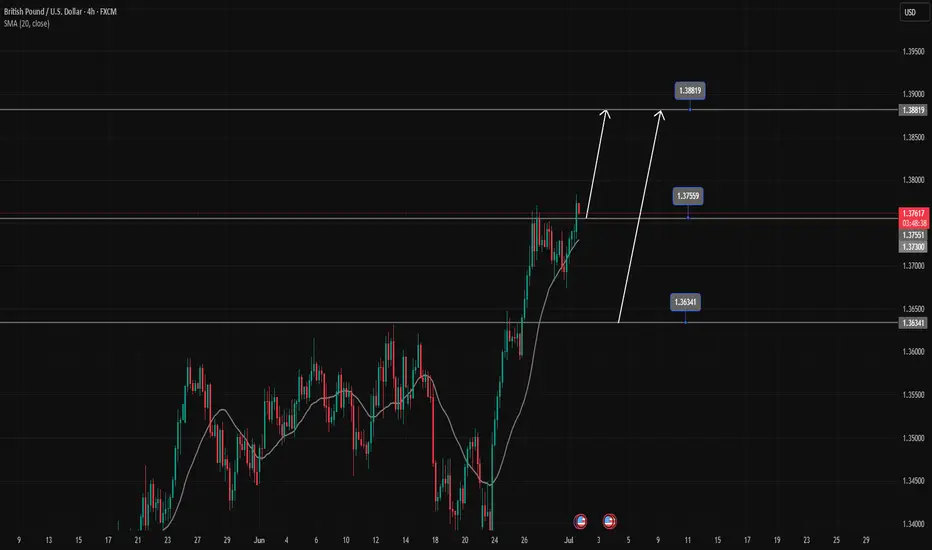
GBPUSD's strong uptrend continuesGBPUSD is in a strong uptrend, Price has just broken the resistance zone of 1.37500.
All the bullish momentum is heading towards the resistance zone of 1.388.
If there is a close of the h4 candle below the resistance zone of 1.375, there will likely be a Pullback to 1.363 to find more buying momentum towards the target at the resistance zone of 1.388
📈 Key Levels
Support: 1.375-1.363
Resistance: 1.388
📊 Recommended Trade Setups
BUY GBPUSD 1.375-1.373 Stoploss 1.37000
BUY GBPUSD 1.363-1.361 Stoploss 1.35800
SELL GBPUSD 1.388-1.390 Stoploss 1.39300
GBPUSD BullishWe are expecting a long continuation on GU after a clear BOS and liquidity sweep on the 1H candle. We patiently wait for a bullish rejection or strong bullish momentum candle as confirmation for entries. Apply proper risk management.

Falling towards pullback support?GBP?USD is falling towards the support level which is a pullback support that lines up with the 38.2% Fibonacci retracement and could drop from this level to our take profit.
Entry: 1.3609
Why we like it:
There is a pullback support level that lines up with the 38.2% Fibonacci retracement.
Stop loss: 1.3534
Why we like it:
There is a pullback support.
Take profit: 1.3746
Why we like it:
There is a pullback resistance.
Enjoying your TradingView experience? Review us!
Please be advised that the information presented on TradingView is provided to Vantage (‘Vantage Global Limited’, ‘we’) by a third-party provider (‘Everest Fortune Group’). Please be reminded that you are solely responsible for the trading decisions on your account. There is a very high degree of risk involved in trading. Any information and/or content is intended entirely for research, educational and informational purposes only and does not constitute investment or consultation advice or investment strategy. The information is not tailored to the investment needs of any specific person and therefore does not involve a consideration of any of the investment objectives, financial situation or needs of any viewer that may receive it. Kindly also note that past performance is not a reliable indicator of future results. Actual results may differ materially from those anticipated in forward-looking or past performance statements. We assume no liability as to the accuracy or completeness of any of the information and/or content provided herein and the Company cannot be held responsible for any omission, mistake nor for any loss or damage including without limitation to any loss of profit which may arise from reliance on any information supplied by Everest Fortune Group.


GBPUSD | 26.06.2025SELL 1.37400 | STOP 1.38200 | TAKE 1.36400 | After consolidation around the medium-term highs, a corrective downward movement is likely and price consolidation under the level of 1.37000.

GBP/USD BEARS ARE STRONG HERE|SHORT
Hello, Friends!
GBP/USD pair is in the uptrend because previous week’s candle is green, while the price is clearly rising on the 3H timeframe. And after the retest of the resistance line above I believe we will see a move down towards the target below at 1.358 because the pair overbought due to its proximity to the upper BB band and a bearish correction is likely.
Disclosure: I am part of Trade Nation's Influencer program and receive a monthly fee for using their TradingView charts in my analysis.
✅LIKE AND COMMENT MY IDEAS✅

Sell GBPUSDGBPUSD looking to go short from the resistance. This resistance has proven a strong barrier for price as observed. Sells here with the stop loss just hovering above 1,365

GBPUSD H4 I A short-term Bearish DropBased on the H4 chart analysis, we can see that the price is currently at our sell entry at 1.3723 which is an overlap resistance.
Our take profit will be at 1.3631 a pullback support that aligns closely with the 38.2% Fib retracement.
The stop loss will be placed at 1.3787, above a swing high resistance level.
High Risk Investment Warning
Trading Forex/CFDs on margin carries a high level of risk and may not be suitable for all investors. Leverage can work against you.
Stratos Markets Limited (tradu.com ):
CFDs are complex instruments and come with a high risk of losing money rapidly due to leverage. 63% of retail investor accounts lose money when trading CFDs with this provider. You should consider whether you understand how CFDs work and whether you can afford to take the high risk of losing your money.
Stratos Europe Ltd (tradu.com ):
CFDs are complex instruments and come with a high risk of losing money rapidly due to leverage. 63% of retail investor accounts lose money when trading CFDs with this provider. You should consider whether you understand how CFDs work and whether you can afford to take the high risk of losing your money.
Stratos Global LLC (tradu.com ):
Losses can exceed deposits.
Please be advised that the information presented on TradingView is provided to Tradu (‘Company’, ‘we’) by a third-party provider (‘TFA Global Pte Ltd’). Please be reminded that you are solely responsible for the trading decisions on your account. There is a very high degree of risk involved in trading. Any information and/or content is intended entirely for research, educational and informational purposes only and does not constitute investment or consultation advice or investment strategy. The information is not tailored to the investment needs of any specific person and therefore does not involve a consideration of any of the investment objectives, financial situation or needs of any viewer that may receive it. Kindly also note that past performance is not a reliable indicator of future results. Actual results may differ materially from those anticipated in forward-looking or past performance statements. We assume no liability as to the accuracy or completeness of any of the information and/or content provided herein and the Company cannot be held responsible for any omission, mistake nor for any loss or damage including without limitation to any loss of profit which may arise from reliance on any information supplied by TFA Global Pte Ltd.
The speaker(s) is neither an employee, agent nor representative of Tradu and is therefore acting independently. The opinions given are their own, constitute general market commentary, and do not constitute the opinion or advice of Tradu or any form of personal or investment advice. Tradu neither endorses nor guarantees offerings of third-party speakers, nor is Tradu responsible for the content, veracity or opinions of third-party speakers, presenters or participants.

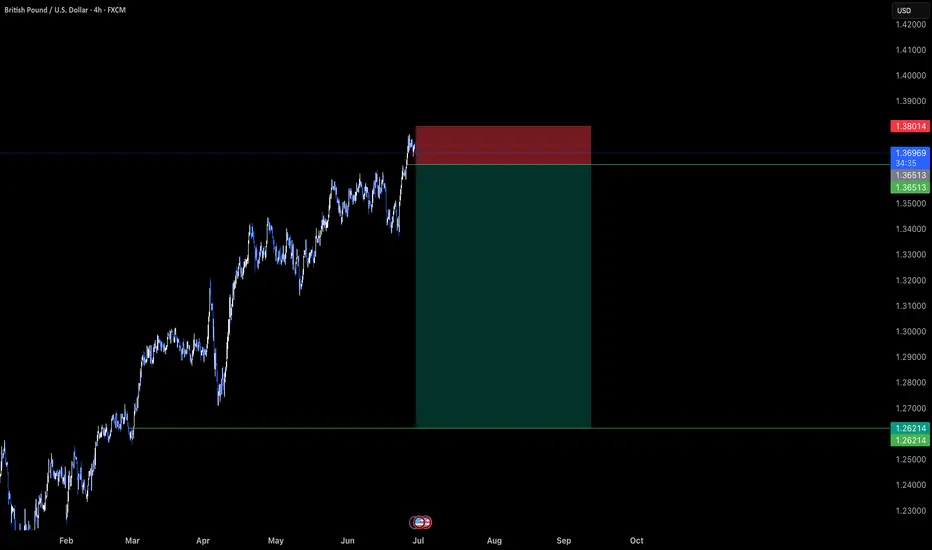
GBPUSD: The Big Short Opportunity?(Breakout Confirmation Needed)🚨 GBP/USD BANK HEIST ALERT: The Bearish Robbery Plan (Swing/Day Trade) 🚨
🔥 Steal Pips Like a Pro – Thief Trading Strategy Inside! 🔥
🌟 GREETINGS, MARKET PIRATES! 🌟
🤑 To all the Money Makers, Risk Takers & Midnight Breakers!
Based on our 🔥Thief Trading Style🔥 (a deadly mix of technical + fundamental + intermarket analysis), we’re plotting a massive bearish heist on GBP/USD ("The Cable").
This is not financial advice—just a strategic robbery plan for those who dare to trade smart.
📉 THE HEIST STRATEGY (SHORT ENTRY FOCUS)
🎯 Target Zone: 1.32300 (or escape earlier if the market turns)
⚡ High-Risk, High-Reward Play: Oversold market, consolidation, trend reversal setup.
💣 Trap Level: Where bullish traders get wrecked.
🔑 ENTRY RULES:
"The Heist is ON!" – Wait for breakout confirmation at 1.33800 before striking.
Sell Stop Orders below breakout MA OR Sell Limit Orders (15-30 min timeframe).
Retest Entry? Ideal if price retraces to recent low/high before dropping.
📌 ALERT SETUP: Don’t miss the breakout—set a chart alert!
🛑 STOP LOSS (Risk Management):
Thief SL at 1.34800 (Swing/Day Trade basis – 3H period).
🚨 Pro Tip: "Yo, rebels! You can place SL wherever you want… but if you ignore this level, don’t cry later. Your risk, your rules."
🎯 PROFIT TARGET:
First Take-Profit: 1.32300 (or bail earlier if momentum fades).
Scalpers: Ride the short side only. Use trailing SL to lock profits.
📰 FUNDAMENTAL BACKUP (Why This Heist Works)
Before executing, check:
✅ COT Report (Are big players dumping GBP?)
✅ Macro News (UK vs. USD economic strength)
✅ Intermarket Analysis (DXY, Bonds, Equities correlation)
✅ Sentiment & Seasonality (Is the crowd too bullish?)
⚠️ WARNING: NEWS & VOLATILITY ALERTS
Avoid new trades during high-impact news (unless you love gambling).
Use trailing stops to protect profits if the market flips.
💥 BOOST THIS HEIST! 💥
🚀 Like & Share to strengthen our Thief Trading Squad!
💸 More heists = More profits. Stay tuned for the next robbery plan!
🤑 See you on the profitable side, bandits! 🏴☠️
🔴 DISCLAIMER: This is entertainment, not financial advice. Trade at your own risk.
#Forex #GBPUSD #TradingStrategy #ThiefTrading #BankHeist #SwingTrading #DayTrading
💬 COMMENT BELOW: Are you joining the heist or waiting for a better setup? 🚨👇

GBPUSD 1H | Bearish Divergence GBPUSD has reached a critical technical zone where multiple confluences are signaling a downside correction:
✅ Bearish Divergence spotted on RSI at the top, indicating momentum exhaustion.
✅ Price got rejected from a strong Daily Supply Zone, showing clear institutional selling pressure.
✅ On the LTF (Lower Timeframe), structure has shifted — new Lower Highs (LH) and Lower Lows (LL) are now printing, confirming a short-term bearish trend change.
✅ Price also broke the LTF trendline and is retesting, adding further bearish confluence.
📊 Bias:
Expecting a corrective move to the downside with targets around previous liquidity zones:
⚠️ Market is still sensitive to USD fundamentals this week, so watch key news events for volatility spikes.
🔔 Wait for proper confirmations and manage risk accordingly.

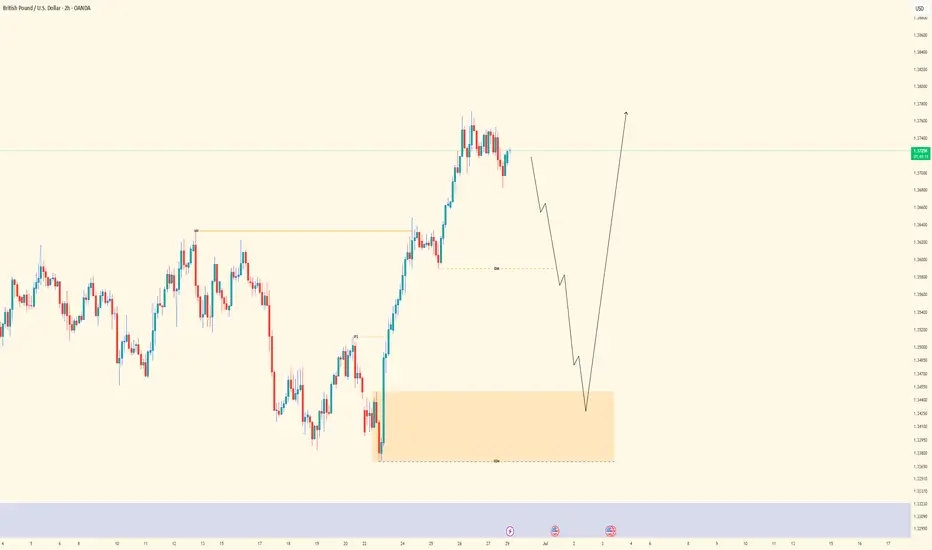
Bullish continuation?The Cable (GBP/USD) is falling towards the pivot, which acts as a pullback support and could bounce to the 1st resistance.
Pivot: 1.3617
1st Support: 1.3442
1st Resistance: 1.3795
Risk Warning:
Trading Forex and CFDs carries a high level of risk to your capital and you should only trade with money you can afford to lose. Trading Forex and CFDs may not be suitable for all investors, so please ensure that you fully understand the risks involved and seek independent advice if necessary.
Disclaimer:
The above opinions given constitute general market commentary, and do not constitute the opinion or advice of IC Markets or any form of personal or investment advice.
Any opinions, news, research, analyses, prices, other information, or links to third-party sites contained on this website are provided on an "as-is" basis, are intended only to be informative, is not an advice nor a recommendation, nor research, or a record of our trading prices, or an offer of, or solicitation for a transaction in any financial instrument and thus should not be treated as such. The information provided does not involve any specific investment objectives, financial situation and needs of any specific person who may receive it. Please be aware, that past performance is not a reliable indicator of future performance and/or results. Past Performance or Forward-looking scenarios based upon the reasonable beliefs of the third-party provider are not a guarantee of future performance. Actual results may differ materially from those anticipated in forward-looking or past performance statements. IC Markets makes no representation or warranty and assumes no liability as to the accuracy or completeness of the information provided, nor any loss arising from any investment based on a recommendation, forecast or any information supplied by any third-party.

GBPUSD GBPUSD has completed its bullish leg, reaching our previously identified target zone.
Current price action indicates potential exhaustion, and we are now actively monitoring for a short setup, targeting the 1.37200 level, which aligns with a minor inefficiency and previous structural support turned resistance.
This move is supported by overextended intraday momentum on the 15-minute chart, along with bearish divergence forming against key price levels — suggesting a potential retracement phase.
Risk Management Strategy:
Entry: Upon confirmation of a bearish setup (e.g., rejection from a lower high or failure to break recent highs with strength).
Stop-Loss: Placed above the most recent swing high or invalidation level, ensuring protection against false breakouts.
Target: 1.37200, offering a favorable risk-to-reward ratio of at least 1:2.
We’ll continue to monitor price behavior closely and adjust if momentum shifts or invalidation levels are breached.

GBPUSD GBPUSD is currently exhibiting short-term bearish momentum, targeting the fresh demand zone at 1.36416.
This level aligns with a key order block that could act as a pivot for the next bullish leg.
As long as price holds above this zone, we anticipate a potential bullish reversal from 1.36416 on the 15-minute timeframe. We’ll be monitoring for confirmation and continuation to the upside from that level.

GBPUSD - OUTLOOK This is my technical perspective on GBPUSD.
Fundamentally expecting the Dollar to strengthen in the coming weeks
"May fortune attend thee, and thy trade prosper." .......L2Earned
GBPUSD: Short Signal with Entry/SL/TP
GBPUSD
- Classic bearish pattern
- Our team expects retracement
SUGGESTED TRADE:
Swing Trade
Sell GBPUSD
Entry - 1.3710
Stop - 1.3765
Take - 1.3604
Our Risk - 1%
Start protection of your profits from lower levels
Disclosure: I am part of Trade Nation's Influencer program and receive a monthly fee for using their TradingView charts in my analysis.
❤️ Please, support our work with like & comment! ❤️

GBPUSD SHORT GBP/USD looks overextended and rejecting the 1.3750 level. At the same time, DXY is bouncing from the 97.00 support. This could suggest a possible pullback in GBP/USD.

GBPUSD| - Riding the Bullish Wave with Precision📌 Pair: GBPUSD
📈 Bias: Bullish
🕰 HTF View (4H):
Major external structure (HH) broken to the upside — clear bullish intent from smart money. Strong momentum confirms continued interest in pushing price higher.
🧭 MTF View (30M → 2H clarity):
Refined bullish structure forming on 30M. Using the 2H to filter noise and spot deeper liquidity. Watching closely for a sell-side sweep into OB for cleaner, higher-probability LTF entries.
🎯 Entry Criteria:
CHoCH flip → Liquidity sweep → OB mitigation
Perfect sequence = greenlight for execution.
🎯 Target: Structure highs above
🧠 Mindset Note:
Sometimes the best entries come after everyone else gets taken out. Be the one who waits, confirms, then strikes with intention.
Bless Trading!
GBP/USD Daily AnalysisPrice is bullish on the daily time frame.
After 4 consecutive bullish days, price printed a bearish inside candle on Friday.
This could potentially be the start of a correction back towards the moving averages and possibly towards the first Fibonacci retracement levels (38.2% and 50%).
If you agree with this analysis, look for a trade that meets your strategy rules.
